ORIGINAL RESEARCH
Diffusion-Weighted MR Imaging Derived Apparent
Diffusion Coefficient Is Predictive of Clinical
Outcome in Primary Central Nervous System
Lymphoma
R.F. Barajas, Jr J.L. Rubenstein J.S. Chang J. Hwang S. Cha
BACKGROUND AND PURPOSE: There is evidence that increased tumor cellular density within diagnostic specimens of primary central nervous system lymphoma (PCNSL) may have significant prognostic implications. Because cellular density may influence measurements of apparent diffusion coefficient (ADC) by using diffusion-weighted MR imaging (DWI), we hypothesized that ADC measured from contrast-enhancing regions might correlate with clinical outcome in patients with PCNSL.
MATERIALS AND METHODS:PCNSL tumors from 18 immunocompetent patients, treated uniformly with methotrexate-based chemotherapy, were studied with pretherapeutic DWI. Enhancing lesions were diagnosed by pathologic analysis as high-grade B-cell lymphomas. Regions of interest were placed around all enhancing lesions allowing calculation of mean, 25th percentile (ADC25%), and minimum ADC values. Histopathologic tumor cellularity was quantitatively measured in all patients. High and low ADC groups were stratified by the median ADC value of the cohort. The Welchttest assessed differences between groups. The Pearson correlation examined relationships between ADC measurements and tumor cellular density. Single and multivariable survival analysis was performed.
RESULTS: We detected significant intra- and intertumor heterogeneity in ADC measurements. An inverse correlation between cellular density and ADC measurements was observed (P⬍.05). ADC25% measurements less than the median value of 692 (low ADC group) were associated with significantly shorter progression-free and overall survival. Patients with improved clinical outcome were noted to exhibit a significant decrease in ADC measurements following high-dose methotrexate chemotherapy.
CONCLUSIONS:Our study provides evidence that ADC measurements within contrast-enhancing regions of PCNSL tumors may provide noninvasive insight into clinical outcome.
P
rimary central nervous system lymphoma (PCNSL) is a potentially curable brain tumor, the incidence of which is increasing among immunocompetent patients.1-3 An over-view of most clinical series suggests the existence of distinct prog-nostic subgroups of PCNSL with respect to response to high-dose methotrexate-based chemotherapy.4A significant fraction of pa-tients with PCNSL often exhibit disease refractoriness to this treatment regimen.4The initial response to therapy, typically as-sessed at 4- to 6-week intervals after the initiation of methotrex-ate, is evaluated by measurement of tumor contrast-enhance-ment on MR imaging.4-8In general, 70% of PCNSL tumors exhibit radiographic evidence of tumor response; however, only20%– 40% of these patients experience prolonged progression-free survival (PFS) and overall survival (OS).
Given the significant long-term adverse effects associated with concurrent whole-brain irradiation, there is great interest in identifying prognostic subgroups of patients with PCNSL.8 In particular, clinicians have sought to identify patients at low risk of recurrence who may simply be followed throughout the administration of chemotherapy without concurrent whole-brain irradiation. Conversely, patients at high risk for tumor recurrence may benefit from further chemotherapy or irradi-ation as a means of consolidirradi-ation of response.9,10
At present, there are no established imaging biomarkers predictive of prognosis in patients with PCNSL. An imaging biomarker of tumor refractoriness to methotrexate-based chemotherapy would greatly facilitate clinical decisions and might lead to the early initiation of second-line salvage therapy in patients with high-risk PCNSL tumors, which could poten-tially lead to improved treatment strategies and clinical out-comes. Diffusion-weighted imaging (DWI) is an MR imaging technique that measures the diffusion rate of unbound extra-cellular water molecules.11,12Early investigations into DWI demonstrated that densely packed tumor cells with a high nu-clear-to-cytoplasmic ratio could reduce water molecule mo-tion.11-14It has been previously proposed that PCNSL can be histologically subclassified on the basis of cellular growth pat-terns into high and low cellular density tumors, which may have prognostic implications.15,16
Recently, it has been reported that DWI-derived apparent diffusion coefficient (ADC) measurements inversely correlate
Received April 1, 2009; accepted after revision May 22.
From the Department of Radiology (R.F.B., J.S.C., S.C.), Neuroradiology Section; Division of Hematology/Oncology (J.L.R.); and Helen Diller Family Comprehensive Cancer Center (J.H.); University of California San Francisco, San Francisco, California.
This work was supported by NS045013 (S.C.) and TL1 RR024129 – 01 (R.F.B.) from the National Center for Research Resources, a component of the National Institutes of Health (NIH) and NIH Roadmap for Medical Research; by a National Cancer Institute Research Career Award, NIH Brain Tumor Specialized Programs of Research Excellence (SPORE) grant P50 CA097267; and by grants from Gabrielle’s Angel Foundation for Cancer Research and the American Cancer Society (J.L.R.).
R.F.B. and J.L.R. contributed equally to the authorship of this article.
Previously presented in part at: Annual Meeting of the American Society of Neuroradiology, May 31–June 5, 2008; New Orleans, Louisiana.
Please address correspondence to Soonmee Cha, MD, UCSF Department of Radiology, 350 Parnassus Ave, Ste 307, Room 307H, Box 0336, San Francisco, CA 94117; e-mail: [email protected]
Indicates open access to non-subscribers at www.ajnr.org
with histopathologic assessment of PCNSL tumor cellular density.14To our knowledge, a relationship between prethera-peutic ADC measurements and clinical outcome in patients with PCNSL has not been previously reported. We, therefore, evalu-ated whether pretherapeutic ADC measurements could stratify patients with PCNSL into prognostic subgroups, allowing iden-tification of patients whose tumors exhibited early disease pro-gression and shortened overall survival.
Materials and Methods
Patient Population
Eighteen patients (10 men, 8 women; mean age, 57⫾15 years; all immunocompetent) treated at the University of California San Fran-cisco, between October 2001 and February 2009, were selected for this retrospective study on the basis of the following criteria: histopatho-logic diagnosis of PCNSL as defined by the World Health Organiza-tion; negative human immunodeficiency virus status; and absence of extra-central nervous system (CNS) lymphoma based upon CT scans of the chest, abdomen, and pelvis. All patients had a pathologic diag-nosis of large B-cell CNS lymphoma and received identical trexate-based induction chemotherapy treatment. Notably, metho-trexate is the only treatment-related variable that has been reproducibly positively associated with favorable outcome in PC-NSL.17Of 70 patients who met the inclusion criteria for this
investi-gation, only 18 were studied on the basis of having received prethera-peutic contrast-enhanced MR imaging of the brain with DWI. Twelve of the 18 patients had pretherapeutic, interval, and posttreatment follow-up contrast-enhanced MR imaging of the brain with DWI.
Each methotrexate treatment cycle was administered in the hospital setting. During induction, patients received methotrexate (3– 8 g/m2) every 14 days. In patients who achieved a complete response
(CR), defined as resolution of contrast-enhancing lesions on follow-up MR imaging and, if indicated, by CSF cytologic analysis (if CSF cytology was positive for malignant cells at the time of diagnostic staging), to in-duction chemotherapy, 2–3 additional cycles of methotrexate (3– 8 g/m2) were administered every 14 –21 days as consolidation therapy.
Pa-tients who achieved a partial response, defined as an interval decrease in contrast-enhancing lesion volume, or who exhibited disease progression, defined as an interval increase in contrast-enhancing lesion volume or the development of new enhancing lesions on follow-up contrast-en-hanced MR imaging, were offered high-dose chemotherapy or whole-brain irradiation as salvage therapy. All patients with PCNSL included in this study underwent restaging with follow-up contrast-enhanced MR imaging within 5 cycles of methotrexate chemotherapy.5
MR Imaging Protocol
MR imaging data were obtained with a 1.5T clinical scanner (Signa Horizon, GE Healthcare, Milwaukee, Wisconsin). MR imaging exam-inations included conventional contrast-enhanced and DWI se-quences obtained according to a standardized protocol: 3-plane lo-calizer (TR/TE, 8.5/1.6 ms), sagittal T1-weighted spin-echo (TR/TE, 600/17 ms), axial 3D T2-weighted fast spin-echo (TR/TE, 3000/102 ms), axial fluid-attenuated inversion recovery (TR/TE/TI, 10,000/148/ 2200 ms), axial DWI echo-planar imaging (TR/TE, 10,000/99 ms; sec-tion thickness/intersecsec-tion gap, 5/0 mm; matrix size, 256⫻256⫻24; FOV, 24 cm; b-value, 1000 s/mm2) acquired in the transverse plane
throughout the infratentorial and supratentorial brain, and contrast-enhanced 3D spoiled gradient-recalled acquisition in the steady state
(SPGR) T1-weighted imaging (TR/TE, 34/8 ms; section thickness/ intersection gap, 1.5/0 mm).
MR Image Processing
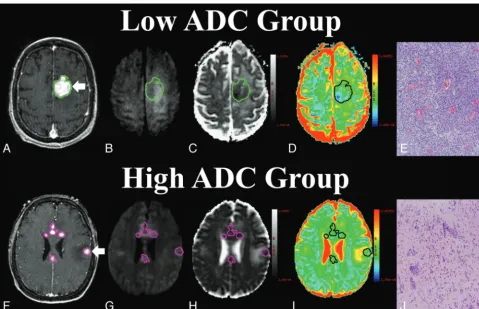
The contrast-enhanced 3D SPGR images and raw DWIs were trans-ferred to a commercially available diffusion image-processing work-station (Advantage Workwork-station, GE Healthcare). Image processing was performed in a blinded manner by using commercially available software (FuncTool, GE Healthcare; R.F.B.). The contrast-enhanced 3D SPGR images were aligned to the same axial location and resolu-tion as those of the DWIs. ADC maps were calculated on a voxel-by-voxel basis from the diffusion imaging sets. An example of the con-trast-enhanced SPGR image, ADC map, and region-of-interest is shown in Fig 1. For each transaxial plane, a region of interest was manually defined around contrast-enhancing regions from the con-trast-enhanced 3D SPGR image aligned to the DWI and ADC map, allowing ADC measurement and contrast-enhancing volume. The average of the mean (ADCmean), 25th percentile (ADC25%), and
min-imum ADC (ADCmin) values for all regions of interest was calculated
for all transaxial sections for each patient. In patients with multiple enhancing regions, regions of interest were placed around all enhancing regions, producing average ADC measurements derived from the entire enhancing tumor burden. The investigator responsible for the produc-tion of regions of interest was blinded to pathologic and clinical outcome (R.F.B.). All regions of interest were approved by an attending neurora-diologist certified by the American Board of Radiology with a Certificate of Added Qualification in neuroradiology (S.C.).
Histopathologic Analysis
All patients underwent surgical biopsy to establish the diagnosis of PCNSL. Diagnostic biopsy specimens were obtained from an enhanc-ing tumor component. Hematoxylin-eosin⫺stained (HE) tumor specimens were qualitatively graded as low cellular density, defined as the presence of normal brain elements between tumor cells in the pathologic specimen; high cellular density, defined as the absence of normal brain elements between tumor cells in the pathologic speci-men; or mixed cellular density, defined as a mixture of high and low cellular elements within the biopsy specimen (Fig 1).15,16
Histopatho-logic analysis was performed independently by 2 separate investiga-tors (R.F.B. and J.L.R.) blinded to biopsy location, MR imaging, and clinical outcome. Mean cellular density was quantitatively assessed for all biopsy specimens by manually counting and averaging the total number of HE-stained cell nuclei lying within a 5⫻5 ocular graticule grid covering an area of 0.25 mm2within 2– 6 separate microscopic
fields at a magnification of⫻20 (1.0 mm2).18
Statistical Analysis
All ADC values are reported as 100⫻10⫺6mm2/s. High and low ADC
groups were stratified by determining the median value from the co-hort range of ADCmin(384), ADC25%(692), and ADCmean(854)
mea-surements. Differences between groups were assessed by using a 2-sample Welchttest. This test generalizes the conventionalttest by not prescribing that between-group variances are equal. A Pearson correlation was used to analyze the relationships between ADC values and biopsy specimen⫺derived cellular density.
The 3 clinical end points analyzed in this study were the following: radiographic response following treatment, PFS, and OS. Time to an event was calculated from the initiation of treatment until death (OS), progression or death (PFS), or date of last follow-up for patients with-out an event. Single covariate survival analysis was performed by
us-BRAIN
ORIGINAL
ing a logrank test. A Cox proportional hazard model was used for multivariable survival analysis. A Fisher exact test was used to inves-tigate relationships between ADC group stratification and treatment response. APvalueⱕ.05 was considered statistically significant.
Results
Tumoral ADC Heterogeneity and Patient Characteristics Within the patient cohort, we identified a range in the distri-bution of intertumoral pretherapeutic ADCmean(636 –1016), ADC25%, (534 –906), and ADCminvalues (167– 614) obtained from the entire enhancing burden of all PCNSL tumors. Given the evidence that ADC measurements may be influenced by the degree of intratumoral cellular density, we investigated whether a relationship exists between ADC measurements and clinical outcome in patients with PCNSL.14-16We focused on the ADCminand ADC25%on the basis of the assumption that these measurements best represent the most cellular compo-nent within contrast-enhancing tumor.
There was no statistically significant difference in major clinical prognostic factors, including age and performance sta-tus, when patients were stratified between high and low ADC groups (P⬎.05, Tables 1 and 2). Most important, the time between diagnosis and initial treatment, the time between treatment and follow-up MR imaging, the number of metho-trexate treatment cycles between diagnosis and follow-up MR imaging, and the time between follow-up MR imaging exam-inations were not statistically different between high and low ADC groups (P⬎.05, Table 2).
Enhancing PCNSL Tumor Imaging Characteristics, ADC Measurements, and Correlation with Tumor Cellular Density
Pretherapeutic tumor enhancing volume was not statistically different between the low (mean, 11.0⫾17.4 mL) and high (4.49⫾ 2.61 mL) ADC groups (P ⫽.41). Posttherapeutic tumor-enhancing volume was also found not to be statis-tically different between the low (8.45⫾15.4 mL) and high (0.54⫾0.63 mL) ADC groups (P⫽.27). Additionally, the change in enhancing volume observed between pre- and post-therapeutic imaging series was found not to be statistically significant (Table 2,P⫽.37).
A trend suggesting a relationship between ADC groups and treatment response was identified (P⬍.01, Fisher exact test). All 9 patients in the high ADC25%group experienced a CR to methotrexate, while 7 of 9 patients in the low ADC25%group experienced only a partial response or overt tumor progression within the first 2 months of follow-up. Of note, the 2 patients from the low ADC25%group who did exhibit a CR to methotrex-ate-based therapy had higher ADC25%values than other patients in the low group (Table 1).
Pretherapeutic ADCmin, ADC25%, and ADCmean values within enhancing regions were significantly lower within the low ADC groups compared with the high ADC groups (Table 3). When comparing pre- and posttherapeutic ADC values, we noted that the differences in ADC25%and ADCmeanvalues be-tween these MR imaging examinations were statistically different between the low and high groups (P⬍.04, Table 3). Specifically,
[image:3.594.54.534.41.350.2]the high ADC25%and ADCmeangroups tended to exhibit a net decrease in ADC values between pre- and posttherapeutic fol-low-up MR imaging, while the low ADC25%and ADCmeangroups exhibited a net increase in ADC values (Table 3).
Quantitative analysis of cellular density was performed in a blinded manner independently by 2 investigators on diagnostic PCNSL tissue specimens obtained from enhancing tumor com-ponents for all 18 patients. An inverse correlation between cellu-lar density and ADC25%(R⫽ ⫺0.47,P⫽.05) and ADCmean(R⫽ ⫺0.54,P⫽.02) values was identified (Fig 2).
Pretherapeutic ADC Measurements Are Predictive of Clinical Outcome
Seven of the 18 patients exhibited either partial response or primary refractory disease with overt tumor progression within 4 methotrexate treatments administered in 2-week in-tervals. The ADC values for these 7 patients with primary re-fractory disease were significantly lower than those for pa-tients whose tumors exhibited a CR: ADCmean⫾SD (757⫾96
versus 876⫾74,P⫽.02), ADC25%(586⫾51 versus 774⫾74, P⬍.01), and ADCmin(244⫾84 versus 462⫾98,P⬍.01). Two of the 11 patients with an initial CR ultimately progressed, at 8 and 18 months, respectively (Fig 3A). Overall, 7 patients died as a result of progressive disease (Fig 3B). The mean follow-up time for all 18 patients in this study was 23.3 months (range, 1.1–57.3 months). The mean follow-up time for surviving pa-tients was 27.5 months (range, 3.5–57.3 months).
[image:4.594.56.532.57.263.2]Patients with enhancing tumors that contained ADC25% values of⬍692 (low ADC group) experienced earlier disease progression and shorter overall survival despite identical chemo-therapeutic treatment compared with that received by patients in the high ADC group. Patients in the low ADC group had greatly increased risk for both progression (P⫽.03, hazard ratio⫽0.21) and death (P⫽.02, hazard ratio⫽0.12) compared with the high ADC group (Table 2). Mean progression-free survival was also significantly shorter in the low ADC group compared with the high ADC group (Table 2). When we stratified patient outcome by median ADCminvalues (384), the PFS (P⫽.01, hazard ratio⫽
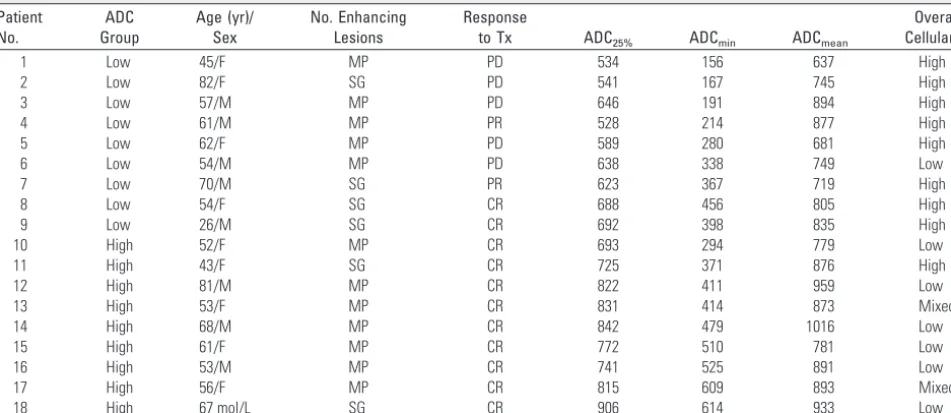
Table 1: Clinical, imaging, and pathologic patient population characteristicsa
Patient No.
ADC Group
Age (yr)/ Sex
No. Enhancing Lesions
Response
to Tx ADC25% ADCmin ADCmean
Overall Cellularity
1 Low 45/F MP PD 534 156 637 High
2 Low 82/F SG PD 541 167 745 High
3 Low 57/M MP PD 646 191 894 High
4 Low 61/M MP PR 528 214 877 High
5 Low 62/F MP PD 589 280 681 High
6 Low 54/M MP PD 638 338 749 Low
7 Low 70/M SG PR 623 367 719 High
8 Low 54/F SG CR 688 456 805 High
9 Low 26/M SG CR 692 398 835 High
10 High 52/F MP CR 693 294 779 Low
11 High 43/F SG CR 725 371 876 High
12 High 81/M MP CR 822 411 959 Low
13 High 53/F MP CR 831 414 873 Mixed
14 High 68/M MP CR 842 479 1016 Low
15 High 61/F MP CR 772 510 781 Low
16 High 53/M MP CR 741 525 891 Low
17 High 56/F MP CR 815 609 893 Mixed
18 High 67 mol/L SG CR 906 614 933 Low
Note:—ADC indicates apparent diffusion coefficient; MP, multiple; SG, single; Tx, treatment; PD, progressive disease; PR, partial response; CR, complete response; ADC25%, 25th percentile
ADC value; ADCmin, minimum ADC value; ADCmean, mean ADC value. a
[image:4.594.54.534.308.368.2]Patients are stratified on the basis of the median 25th percentile value.
Table 2: Comparison of prognostic factors, cellular density, and clinical outcomea
Age (yr) MMSE KPS
Days to Tx
Months to F/U MRI
No. Tx to F/U MRI
Change CE Volume
Months to Progression
Months to Death
Low ADC 56.7 (15.6) 25.2 (6.11) 62.2 (6.67) 13.8 (14.6) 8.3 (14) 2.00 (1.41) 2.50 (2.88) 9.4 (12.0) 15.8 (9.87) High ADC 59.3 (11.3) 25.7 (4.50) 66.7 (5.00) 13.4 (11.7) 4.0 (8.0) 1.70 (0.70) 3.92 (2.39) 30.0 (18.0) 30.9 (17.0)
Pvalue .70 .83 .13 .94 .39 .53 0.37 ⬍.01 .03
Note:—MMSE indicates pretherapeutic Mini-Mental State Examination score; KPS, Karnovsky performance status; Days to Tx, mean number of days between initial diagnosis by MR imaging and initiation of methotrexate-based chemotherapy; Months to F/U MRI, mean number of months between pre- and intratherapeutic MR imaging; No. Tx to F/U MRI, mean number of methotrexate treatments between pre- and intratherapeutic MR imaging; Change CE, difference in enhancing volume between pre-and posttherapeutic imaging series; Months to Progression, mean number of months to progression based on MR imaging if event occurred; Months to Death, mean number of months to death if event occurred.
aAll data are presented as mean (⫾SD). Patients are stratified based on median 25th percentile value.
Table 3: Comparison of MR imaging findingsa
ADCmin Change ADCmin ADC25% Change ADC25% ADCmean Change ADCmean
Low ADC 258 (109) ⫺18.7 (219) 608 (62) 84.7 (114) 771 (87.7) 116 (106) High ADC 469 (107) ⫺120 (224) 794 (67) ⫺55.5 (84.7) 889 (77.0) ⫺42 (74)
Pvalue ⬍.01 .31 ⬍.01 .04 ⬍.01 .01
Note:—Change ADCminindicates the difference between pre- and posttherapeutic ADCminvalues (negative values signify net decrease in value); Change ADC25%, difference between
pre-and posttherapeutic ADC25%values; Change ADCmean, difference between pre- and posttherapeutic ADCmeanvalues. a
All data are presented as mean (SD). All ADC values are reported as 100⫻10⫺6
mm2
[image:4.594.54.537.423.477.2]0.08) and OS (P⫽.01, hazard ratio⫽0.01) were significantly different between high and low ADC groups.
Patient outcome was observed to cluster into nonbimodal cohorts on the basis of ADC cutoff values (minimum, 375; 25th percentile, 700). When stratifying patient outcome by an ADCminvalue of 375, the PFS and OS were significantly differ-ent between high and low ADC groups (P ⬍.01). Patient stratification based on an ADC25%cutoff value of 700 revealed a significant difference in PFS (P⫽.02) and OS (P⬍.01) between high and low ADC groups.
Single covariate analysis of tumor cellular density and clinical prognostic factors in PCNSL, such as age (⬍60 ver-susⱖ60 years), total volume of enhancing lesion (⬍10 mL
versusⱖ10 mL), number of enhancing lesions (single ver-sus multiple), lesion location (infra- verver-sus supratentorial involvement), presenting Mini-Mental State Examination (MMSE) score (⬍25 versusⱖ25), and Karnovsky perfor-mance status (KPS) (⬍70 versus ⱖ70) did not influence PFS or OS (P⬎.05). Multivariate analysis incorporating tumor cellular density and common prognostic factors (age, total volume of enhancing lesion, number of enhanc-ing lesions, lesion location, presentenhanc-ing MMSE score, and KPS) and ADCmin(⬍384 versus⬎384) or ADC25%(⬍692 versus⬎692) suggested that pretherapeutic ADC value and KPS were the only factors predictive of clinical outcome (P⬍.05).
Fig 2.Scatterplots of cellular density measurements versus 25th percentile (ADC25%,A) and mean ADC (ADCmean,B) values within contrast-enhancing tumor regions for all 18 subjects
included in this study, demonstrating statistically significant inverse correlations (ADC25%,R⫽ ⫺0.47,P⫽.05; ADCmean,R⫽ ⫺0.54,P⫽.02).
Fig 3.AandB, Patient outcome as a function of ADC25%stratification into low and high groups. Kaplan Meier analysis (A) of progression-free survival (PFS) for patients stratified into
the low ADC25%group (⬍692, blue line) with a mean progression time of 9.4 months versus those stratified into high ADC25%group (⬎692, red line) with a mean progression time of
30.0 months (P⫽.02, logrank test). Kaplan Meier plot (B) of overall survival (OS) for patients stratified into the low ADC25%group (⬍692, blue line) with a mean survival of 15.8 months
versus those stratified into high ADC25%group (⬎692, red line) with a mean survival of 30.9 months (P⫽.01, logrank test).CandD, Patient outcome as a function of minimum ADC
[image:5.594.84.504.41.161.2] [image:5.594.54.534.195.512.2]Discussion
In this study, we found that pretherapeutic ADC tumor measure-ments within contrast-enhancing regions were predictive of clin-ical outcome in patients with PCNSL. Specifclin-ically, we found that ADC25%(⬍692) and ADCmin(⬍384) values were predictive of shorter PFS and OS. Additionally, an inverse correlation was found between ADC measurements and tumor cellular density. Finally, we found that patients with prolonged PFS and OS had a significant reduction in post-therapeutic ADC values.
Currently, there are no established imaging biomarkers predictive of clinical outcome in patients with PCNSL, a po-tentially curable disease. In our study, stratification of patients with PCNSL by pretherapeutic ADC measurements retro-spectively provided a robust measure of eventual clinical re-sponse to treatment and overall survival. This correlation was preserved even when other known prognostic variables were taken into account. To our knowledge, the use of prethera-peutic ADC values as a predictive factor of the clinical out-come in PCNSL has not been previously reported. The ability to identify patients at risk for primary refractory disease by using pretherapeutic ADC measurements has important clin-ical implications. A noninvasive pretherapeutic imaging bio-marker able to accurately identify patients at high risk for tu-mor refractoriness to methotrexate-based chemotherapy could greatly facilitate clinical decision-making, allowing the initiation of individualized second-line salvage therapies, which may result in improved clinical outcome.9,10,19,20
Poor clinical outcome in patients with PCNSL treated with high-dose methotrexate chemotherapy has been positively correlated with increased intratumoral expression of activated STAT6within high-density tumors based on histopathologic analysis of diagnostic tissue specimens.15,16,21Quantification ofSTAT6expression levels may eventually prove to be a sen-sitive and specific biomarker of clinical outcome; how-ever, its analysis requires an invasive procedure and is not currently widely clinically available. The results of our study indicate that DWI-derived ADC measurements could poten-tially be used as a noninvasive imaging biomarker for identi-fying PCNSL tumors of high cellular density, which are at high risk for refractoriness to conventional high-dose methotrexate-based induction strategies.
In this study, we detected an inverse correlation between ADC measurements and tumor cellular density. Specifically, lower ADC values were correlated with increasing tumor cel-lular density. The results from our study are essen-tially in agreement with those of previous investigations. ADC values have been noted to be markedly reduced in PCNSL compared with other enhancing intra-axial tumors.11-14,22-26 Guo et al14reported that ADC values were inversely related to tumor nuclear-to-cytoplasmatic ratios in their study of water diffusivity within PCNSL and high-grade astrocytomas.
Increased tumor cell density (as determined by counting lym-phoma cell nuclei/high-power field from diagnostic brain biop-sies) was found not to be a statistically significant predictor of clinical outcome. Additionally, a multivariable analysis of ADC measurements and tumor cell density found ADC to be the only predictor of clinical outcome. An important limitation of the quantification of tumor cell density by using microscopy in lym-phoma is the inherent variability in the size and morphology of diffuse proliferations of large lymphoid cells. For this reason, we
have also qualitatively defined tumor cell density on the basis of whether normal brain elements (neurons and glia) are detectable between the neoplastic cells within the pathologic specimen.16 Our results suggest that while ADC measurements correlate with tumor cell density, DWI is a more accurate predictor of clinical outcome, given the capacity of this technique to summate addi-tional unidentified prognostic biologic features of tumor aggres-siveness beyond cell density.
ADC measurements often facilitate the clinical differentia-tion of PCNSL from high-grade glioma and intra-axial meta-static disease.11-14,22-26The ability to presumptively diagnose PCNSL on the basis of noninvasive molecular biomarkers as well as MR imaging may have a significant impact on clinical management. Unlike high-grade glioma, gross total surgical resection of enhancing regions offers no significant improve-ment in clinical outcome in patients with PCNSL.27-30 The need to establish a definitive diagnosis necessitates tissue ac-quisition via stereotactic biopsy. Often clinicians rely on con-ventional anatomic contrast-enhanced MR imaging without using physiologic MR images, such as ADC measurements, when targeting enhancing tumor for biopsy. The results of our study suggest that localization of tumor regions with the low-est ADC measurements may allow the collection of pathologic specimens of highest potential prognostic significance and may minimize the rate of false-negative biopsy collection. Our results indicate that tissue sampling by using ADC-guided stereotactic biopsy in patients suspected of having PCNSL is an application worthy of further investigation.
In this study, we found that patients stratified to the high ADC group who subsequently were found to have improved PFS and OS were noted to exhibit a significant decrease in ADC measure-ments following high-dose methotrexate chemotherapy. This de-crease in ADC measurements could be suggestive of a net reduc-tion of extracellular water molecular moreduc-tion within treated lesions. We hypothesize that this decrease may, in part, be due to greater tumor cellular responsiveness to methotrexate-based che-motherapies within the high ADC group. This improved re-sponse may subsequently lead to treatment-induced cellular swelling, resulting from diminished cellular water homeostasis, which may lead to a decrease in extracellular space within con-trast-enhancing regions.31
Several other studies have demonstrated change in post-therapeutic ADC values following radiation and chemother-apy in primary glial brain tumors.31-34In a study of patients with unresectable glioma, Moffat et al31 used ADC-derived functional diffusion maps (fDMs) to monitor contrast-enhancing regions during the course of therapy. The fDMs were found to predict patient response at 3 weeks from the start of treatment, revealing that early changes in tumor diffu-sion values could be used as a prognostic indicator of subse-quent volumetric tumor response.34While fDMs have been suggested to be an early biomarker of eventual radiographic response in primary glial brain tumors, their utility as bio-markers in PCNSL has not previously been reported.
can occur before the manifestation of progressive contrast enhancement on serial follow-up MR imaging.4-7The results of our study suggest that the use of serial ADC measure-ments in conjunction with contrast-enhanced anatomic MR imaging may be clinically useful in assessing early response to methotrexate-based treatment in patients with PCNSL.
Our study had several limitations. First, the results of our study may have been influenced by its relatively small sample size and retrospective nature. Second, because post-therapeutic biopsy samples are not normally obtained, we were unable to determine the pathophysiologic basis for the observed changes in ADC values on posttherapeutic MR im-aging. We suggest that future studies may use image-guided stereotactic biopsy techniques to directly correlate tissue spec-imen characteristics with ADC measurements.
The technique for measuring ADC values described in this study was chosen to investigate PCNSL because it is robust and timely and clinically feasible. The image processing software and MR scanners used in this study are commercially available and frequently used in the clinical interpretation of MR im-ages because DWI has become a standard imaging sequence in the evaluation of many diseases.
Conclusions
Currently, there are no established imaging biomarkers that are prognostic of clinical outcome in patients with PCNSL. The results of our study suggest that pretherapeutic tumor ADC measurements may noninvasively predict clinical out-come in patients with PCNSL. We suggest that future studies apply image-guided stereotactic biopsy techniques to directly correlate tissue specimen characteristics with ADC measure-ments. Additional studies are needed to prospectively validate these preliminary observations to determine the impact of ADC measurements in facilitating pathologic diagnosis, prog-nostication, and treatment planning.
Acknowledgment
The first author thanks Bethany Barajas, MS, RN, for her help-ful comments regarding this manuscript.
References
1.Statistical Report: Primary Brain Tumors in the United States, 1998 –2002. Hins-dale, Ilinois: Central Brain Tumor Registry of the United States; 2005 2. Surawicz TS, McCarthy BJ, Kupelian V, et al.Descriptive epidemiology of
pri-mary brain and CNS tumors: results from the Central Brain Tumor Registry of the United States, 1990 –1994.Neuro Oncol1999;1:14 –25
3. Olson JE, Janney CA, Rao RD, et al.The continuing increase in the incidence of primary central nervous system non-Hodgkin lymphoma: a surveillance, epidemiology, and end results analysis.Cancer2002;95:1504 –10
4. Hochberg F, Baehring J, Hochberg E.Primary CNS lymphoma.Nat Clin Pract Neurol2007;3:24 –35
5. Abrey LE, Batchelor TT, Ferreri AJ, et al, for the International Primary CNS Lymphoma Collaborative Group.Report of an international workshop to standardize baseline evaluation and response criteria for primary CNS lym-phoma.J Clin Oncol2005;23:5034 – 43. Epub 2005 Jun 13
6. Glass J, Gruber ML, Cher L, et al.Preirradiation methotrexate chemotherapy of primary central nervous system lymphoma: long-term outcome.J Neuro-surg1994;81:188 –95
7. Gavrilovic IT, Hormigo A, Yahalom J, et al.Long-term follow-up of high-dose
methotrexate-based therapy with and without whole brain irradiation for newly diagnosed primary CNS lymphoma.J Clin Oncol2006;28:4570 –74 8. Abrey LE, DeAngelis LM, Yahalom J.Long-term survival in primary CNS
lymphoma.J Clin Oncol1998;16:859 – 63
9. Rubenstein JL, Fridlyand J, Abrey L, et al.Phase I study of intraventricular administration of rituximab in patients with recurrent CNS and intraocular lymphoma.J Clin Oncol2007;25:1350 –56. Epub 2007 Feb 20
10. Soussain C, Hoang-Xuan K, Taillandier L, et al.Intensive chemotherapy fol-lowed by hematopoietic stem-cell rescue for refractory and recurrent primary CNS and intraocular lymphoma.J Clin Oncol2008;26:2512–18
11. Le Bihan D, Turner R, Douek P, et al.Diffusion MR imaging: clinical applica-tions.AJR Am J Roentgenol1992;159:591–99
12. Rowley HA, Grant PE, Roberts TP.Diffusion MR imaging: theory and appli-cations.Neuroimaging Clin N Am1999;9:343– 61
13. Le Bihan D, Breton E, Lallemand D, et al.MR imaging of intravoxel incoherent motions: application to diffusion and perfusion in neurologic disorders. Radiology1986;161:401– 07
14. Guo AC, Cummings TJ, Dash RC, et al. Lymphomas and high-grade astrocytomas: comparison of water diffusibility and histologic characteris-tics.Radiology2002;224:177– 83
15. Rubenstein J, Shen A, Batchelor T, et al.Differential gene expression in central nervous system lymphoma.Blood2009;113:266 – 67
16. Rubenstein, J, Fridlyand, J, Shen, A., et al.Gene expression and angiotropism in primary CNS lymphoma.Blood2006;107:3716 –23
17. Blay JY, Conroy T, Chevreau C, et al.High-dose methotrexate for the treat-ment of primary cerebral lymphomas: analysis of survival and late neurologic toxicity in a retrospective series.J Clin Oncol1998;16:864 –71
18. Burger PC, Shibata T, Kleihues P.The use of the monoclonal antibody Ki-67 in the identification of proliferating cells: application to surgical neuropathol-ogy.Am J Surg Pathol1986;10:611–17
19. Matsumoto Y, Horiike S, Fujimoto Y, et al.Effectiveness and limitation of gamma knife radiosurgery for relapsed central nervous system lymphoma: a retrospective analysis in one institution.Int J Hematol2007;85:333–37 20. Ryken TC, Meeks SL, Pennington EC, et al.Initial clinical experience with
frameless stereotactic radiosurgery: analysis of accuracy and feasibility.Int J Radiat Oncol Biol Phys2001;51:1152–58
21. Roy S, Josephson SA, Fridlyand J, et al.Protein biomarker identification in the CSF of patients with CNS lymphoma.J Clin Oncol2008;26:96 –105 22. Ducreux D, Wu RH, Mikulis DJ, et al.Diffusion-weighted imaging and
single-voxel MR spectroscopy in a case of malignant cerebral lymphoma. Neuro-radiology2003;45:865– 68
23. Stadnik TW, Chaskis C, Michotte A, et al.Diffusion-weighted MR imaging of intracerebral masses: comparison with conventional MR imaging and histo-logic findings.AJNR Am J Neuroradiol2001;22:969 –76
24. Kitis O, Altay H, Calli C, et al.Minimum apparent diffusion coefficients in the evaluation of brain tumors.Euro J Radiol2005;55:393– 400
25. Reiche W, Hagen T, Schuchardt V, et al.Diffusion-weighted MR imaging im-proves diagnosis of CNS lymphomas: a report of four cases with common and uncommon imaging features.Clin Neurol Neurosurg2007;109:92–101 26. Toh CH, Castillo M, Wong AM, et al.Primary cerebral lymphoma and
glio-blastoma multiforme: differences in diffusion characteristics evaluated with diffusion tensor imaging.AJNR Am J Neuroradiol2008;29:471–75 27. O’Neill BP, Kelly PJ, Earle JD, et al.Computer-assisted stereotaxic biopsy for
the diagnosis of primary central nervous system lymphoma.Neurology
1987;37:1160 – 64
28. Murray K, Kun L, Cox J.Primary malignant lymphoma of the central nervous system, result of treatment of 11 cases and review of the literature.J Neursosurg
1986;65:600 – 07
29. O’Neill BP, Illig JJ.Primary central nervous system lymphoma.Mayo Clin Proc
1989;64:1005–20
30. McAllister LD, Doolittle ND, Guastadisegni PE, et al.Cognitive outcomes and long-term follow-up results after enhanced chemotherapy delivery for pri-mary central nervous system lymphoma.Neurosurgery2000;46:51– 61 31. Moffat BA, Chenevert TL, Lawrence TS, et al.Functional diffusion map: a
noninvasive MRI biomarker for early stratification of clinical brain tumor response.Proc Natl Acad Sci U S A2005;102:5524 –29
32. Chenevert TL, Stegman LD, Taylor JM, et al.Diffusion magnetic resonance imaging: an early surrogate marker of therapeutic efficacy in brain tumors. J Natl Cancer Inst2000;92:2029 –36
33. Mardor Y, Pfeffer R, Spiegelmann R, et al.Early detection of response to radi-ation therapy in patients with brain malignancies using conventional and high b-value diffusion-weighted magnetic resonance imaging.J Clin Oncol
2003;21:1094 –100

![3 {3,3 Dimethylspiro[2,3 dihydro 1H indole 2,3′ (3′H naphtho[2,1 b][1,4]oxazin)] 1 yl}propionic acid](data:image/gif;base64,R0lGODlhAQABAIAAAP///wAAACH5BAEAAAAALAAAAAABAAEAAAICRAEAOw==)