ORIGINAL RESEARCH
Voxel-Based Morphometry and Diffusion Tensor
Imaging of the Optic Pathway in Primary
Open-Angle Glaucoma: A Preliminary Study
A.K. Zikou G. Kitsos L.C. Tzarouchi L. Astrakas G.A. Alexiou M.I. Argyropoulou
BACKGROUND AND PURPOSE:Neuropathologic studies in experimental and human glaucoma have
demonstrated degenerative changes in the optic pathway. The purpose of this study was to assess the optic pathway in POAG by using VBM and DTI.
MATERIALS AND METHODS: Eighteen patients 57.05⫾11.38 years of age with POAG of 8.30⫾5.14 years’ duration and 18 control subjects underwent a complete ophthalmologic examination, including quantification of the RNFLT by using Stratus OCT 3, and brain imaging. The imaging protocol consisted of a T1-weighted high-resolution 3D spoiled gradient-echo sequence and a multisection spin-echo-planar diffusion-weighted sequence. Data preprocessing and analysis were performed by using Matlab 7.0 and SPM 5.
RESULTS: Left temporal and right nasal RNFLTs were significantly thinner than right temporal and left nasal RNFLTs. In patients, VBM revealed a significant reduction in the left visual cortex volume, the left lateral geniculate nucleus, and the intracranial part of the ONs and the chiasma. In addition, a significant decrease of FA was observed in the inferior fronto-occipital fasciculus, the longitudinal and inferior frontal fasciculi, the putamen, the caudate nucleus, the anterior and posterior thalamic radiations, and the anterior and posterior limbs of the internal capsule of the left hemisphere (P⬍.05).
CONCLUSIONS:Neurodegenerative changes of the optic pathway and several brain areas associated with the visual system can be observed by using VBM and DTI in patients with POAG, suggesting that glaucoma is a complex neurologic disease.
ABBREVIATIONS:BA ⫽ Brodmann area; C/D ⫽ cup to disc ratio; FA ⫽ fractional anisotropy; FMRIB⫽Functional MR Imaging of the Brain; GM⫽gray matter; LGN⫽lateral geniculate nucleus; MD⫽mean diffusivity; MNI⫽Montreal Neurologic Institute; OCT⫽optical coherence tomogra-phy; ON⫽optic nerve; POAG⫽ primary open-angle glaucoma; PSD⫽pattern SD; RNFLT ⫽ peripapillary retinal nerve fiber layer thickness; SAR ⫽ signal-intensity average ratio; VBM ⫽ voxel-based morphometry; WMH⫽white matter hyperintensities
P
OAG is a progressive optic neuropathy characterized by irreversible loss of retinal ganglion cells, degeneration of their axons in the ON, and visual field loss.1It is a significant cause of blindness throughout the world, and by 2020, it is predicted that close to 60 million people will have POAG.2 Raised intraocular pressure is known to be the major risk fac-tor for glaucoma, but despite effective medical and surgical treatment to reduce intraocular pressure, progressive vision loss is common among patients with glaucoma.3These obser-vations suggest that mechanisms independent of intraocular pressure are also implicated in the progression of the disease.4 Neurodegeneration may play an important role in the patho-genesis and progression of glaucoma,4,5and a variety of neu-roprotective agents are under investigation for application in glaucoma treatment. The fundamental common process ob-served in neurodegenerative disorders is death of a specific neuron population followed by antegrade or retrograde trans-synaptic spread of degeneration (wallerian degeneration) from abnormal to normal neurons.4Experimental studies in animal models and postmortem studies of human glaucoma provide evidence of the funda-mental process of neurodegeneration by demonstrating the death of retinal ganglion cells and the degeneration of the ON, LGN, and visual cortex.5-7The development of imaging mo-dalities for the early detection of these changes in vivo could be very important for more accurate evaluation of the disease severity and assessment of the therapeutic efficacy of treat-ment strategies. Conventional MR imaging and magnetiza-tion-transfer imaging have been used in the evaluation of POAG and, with the use of region-of-interest methods, have demonstrated ON atrophy and a decrease of the magnetiza-tion-transfer ratio suggestive of degeneration in the chiasma and the visual cortex.8
VBM is an objective automated technique that assesses brain volume changes throughout the whole brain without a priori identification of a region of interest. This approach is not biased toward any particular region of the brain and per-mits the identification of unsuspected potential regional structural changes in the brain.9VBM has been used in the study of patients with long-standing retinal field defects in whom it has demonstrated regional changes in the cortical GM volume.10
DTI provides noninvasive measures of microstructural WM integrity by measuring molecular diffusion and is highly sensitive in detecting axonal injury.11,12DTI has been used in
Received January 17, 2011; accepted after revision May 1.
From the Departments of Radiology (A.K.Z., L.C.T., M.I.A.), Ophthalmology (G.K.), Medical Physics (L.A.), and Neurosurgery (G.A.A.), Medical School, University of Ioannina, Ioannina, Greece.
Please address correspondence to Maria I Argyropoulou, MD, Medical School, University of Ioannina, 45110, Ioannina, Greece; e-mail: [email protected]
the evaluation of WM degeneration, and changes in diffusivity scalars have been found useful in the differential diagnosis between primary and wallerian (secondary) degeneration.13 DTI by using region-of-interest analysis has been used in the evaluation of the ON and the optic tract in experimental glau-coma and transient retinal ischemia, demonstrating changes in the diffusivity scalars compatible with wallerian degenera-tion.7,14,15High-field-strength DTI by using region-of-inter-est analysis in human glaucoma demonstrated a correlation between diffusivity scalars and glaucoma stage.16Voxelwise statistical analysis of DTI scalars assesses changes throughout the whole brain without a priori identification of a region of interest.9
Although POAG is a significant cause of blindness, it has not been an area of intensive research interest in imaging, and to the authors’ knowledge, no other study has used the above-mentioned imaging techniques to assess the human brain in the setting of this disease. The present study was designed to evaluate possible optic pathway neurodegeneration by using VBM and voxel-based DTI analysis in patients with POAG.
Materials and Methods
Subjects
Eighteen patients with bilateral POAG, 14 men and 4 women, 37–75 years of age (mean age, 57.05⫾11.38 years), and 18 age- and sex-matched disease-free control subjects were enrolled in the study. All patients fulfilled the diagnostic criteria for POAG of the American Academy of Ophthalmology, which are intraocular pressureⱖ21 mm Hg, glaucomatous optic disc and visual field abnormalities, and a nonoccludable anterior chamber angle without characteristics of con-genital or secondary glaucoma.17In patients, the disease duration
from the diagnosis of glaucoma was 1–20 years (mean, 8.30⫾5.14 years). To rule out strokes, microhemorrhages, demyelination, and small-vessel diseases, which can have marked impact on DTI and VBM parameters, we excluded patients with demyelinating disease, autoimmune disease (vasculitis), a history or clinical signs of cardio-vascular disease, peripheral artery disease, diabetes mellitus (fasting plasma glucose concentration,ⱖ126 mg dL⫺1, or use of antidiabetic
medications), and hypertension (arterial blood pressure,ⱖ140/90 mm Hg, or use of antihypertensive medications). Furthermore, to rule out retinal nerve-fiber-layer thickness changes or perimetric findings not directly related to POAC, we excluded patients with a history of ophthalmic surgery (including refractive surgery), ophthal-mic or orbital trauma, ON atrophy, uveitis, diabetic retinopathy, any form of cystoid macular edema, age-related macular degeneration, refractive errors in myopia, or hypermetropia⬎3.00 diopters and in astigmatism⬎1.00 diopters. Also patients with exfoliative glaucoma, acute glaucoma, or congenital glaucoma were excluded. Patients with any degree or form of cataract were also excluded to avoid any effects of cataracts on perimetric findings.
Clinical Examination
All patients and control subjects underwent complete ophthalmo-logic examination including visual acuity (optotype Snellen), intra-ocular pressure measurement (Goldmann tonometer), gonioscopy, funduscopy with evaluation of the C/D, by using the Discam imaging system (Marcher Enterprises, Hereford, United Kingdom), assess-ment of visual fields (Humphrey, 24 –2: mean deviation, PSD), and quantification of RNFLT by using Stratus OCT 3, Version 4 (Carl
Zeiss, San Diego, California). Before the OCT scan, all participants were subjected to pupillary dilation with 0.5% tropicamide and 0.5% phenylephrine. They then underwent optic disc scanning by using the fast RNFLT protocol, which is designed for the measurement of RN-FLT. The fast RNFLT protocol compresses the 3 sequential circular scans of 3.4-mm radius of the RNFLT protocol into 1 scan, performed in 1.92 seconds. The average RNFLT was extracted from the fast RNFLT protocol at a distance of 3.4 mm from the center of the optic disc, for each of the 4 peripupillary quadrants (inferior, superior, nasal, and temporal). The universal RNFLT (mean RNFLT score for all quadrants) was also recorded. Informed consent was obtained from all patients, and the study was approved by the institutional review board and was Health Insurance Portability and Accountabil-ity Act⫺compliant.
Imaging Protocol
All MR imaging examinations were performed on the same 1.5T unit (Gyroscan Intera; Philips Healthcare, Best, the Netherlands) by using a quadrature head coil. Subjects were asked to close their eyes and avoid any deliberate eye movements during image acquisition. The imaging protocol consisted of the following; 1) T1-weighted high-resolution (1⫻1⫻1 mm) 3D spoiled gradient-echo sequence (TR, 25 ms; TE, 4.6 ms; bandwidth 151.4 Hz/pixel; acquisition matrix, 256⫻228; FOV, 220 mm; SAR,⬍1.9/0 W/kg; scanning time, 5 min-utes and 43 seconds; number of signal intensity averages, 1), which was used for structural imaging; 2) a single-shot multisection spin-echo-planar sequence (TR, 9807 ms; TE, 131 ms; FOV, 230 mm; bandwidth, 13.8 Hz/pixel; matrix, 128⫻128; section thickness, 3 mm; maximum b-value, 700 s/mm2; 16 noncollinear diffusion
direc-tions; SAR,⬍0.3/0 W/kg; scanning time, 5 minutes and 34 seconds; number of signal intensity averages, 2; intersection gap, 0), which was used for DTI; and 3) a sagittal T2-weighted FLAIR sequence (TR, 6300 ms; TE, 120 ms; FOV, 250 mm; matrix, 256⫻256; bandwidth, 336.7 Hz/pixel; section thickness, 6 mm; intersection gap, 0.6; SAR, ⬍0.7/0 W/kg; scanning time, 2 minutes and 50 seconds; number of signal intensity averages, 2), which was used for evaluation of WMH.
Image Analysis
Morphometric preprocessing and analysis were performed by using Matlab, Version 7.0 (MathWorks, Natick, Massachusetts) and SPM 5 (Wellcome Department of Cognitive Neurology, London, UK). Pre-processing for the T1-weighted images involved the following: first, spatial normalization of all images to the T1 MNI template supplied with the SPM. The images were then segmented into GM, WM, and CSF compartments. Modulation of the segmented images was per-formed applying the Jacobian determinants derived from the spatial normalization step. Finally, GM. WM, and CSF partitions were smoothed with a Gaussian filter of 8⫻8⫻8 mm full-width at half maximum. Volume changes in patients with POAG relative to the control group were assessed at every brain voxel by estimating the
t-score at a significance threshold ofP⫽.05 corrected for multiple comparisons by using the false discovery rate approach.
Voxelwise statistical analysis of the FA and MD was performed by using tract-based spatial statistics, part of the FMRIB Software Library (http://www.fmrib.ox.ac.uk/analysis/techrep/tr04ss2/tr04ss2/node 19.html).18First, FA and MD images were created by fitting a tensor
model to the raw diffusion data by using the diffusion toolbox in FMRIB, and then they were extracted by using the brain-extraction tool.19The FA and MD data of all the subjects were then
aligned into a common space (FMRIB58_FA) by using the nonlinear
HEAD
&
NECK
ORIGINAL
image registration tool in FMRIB,20which uses a b-spline
represen-tation of the registration warp field.21Next, the mean FA image was
created and thinned to create a mean FA skeleton, which represents the centers of all tracts common to the group. The aligned FA and MD data of each subject were then projected onto this skeleton, and the resulting data were fed into voxelwise cross-subject statistics by using a permutation-based nonparametric inference method (RANDOM-IZE, Version 2.01, a tool of FSL software package). The map-wise false-positive rate (family-wise error) was controlled with aPvalue ⬍.05. One radiologist (L.C.T.) who was unaware of the clinical status of the patients and the control subjects evaluated the presence and the numbers of WMH on sagittal FLAIR sequences. The B0 images were also examined for evidence of T2* abnormalities (blood/ calcifications).
Statistical Analysis
All results were expressed as mean⫾SD. The single-sample Kol-mogorov-Smirnov test was used to estimate the distribution charac-teristics of the variables. The combined variables equal to the average of the RNFLT values of the nasal quadrant of 1 eye and the temporal quadrant of the other eye were calculated. The differences between clinical values of temporal and nasal RNFLTs of the right and left eyes, the combined RNFLTs, the C/D, mean deviation, visual acuity and PSD, and differences in WMH between patients and controls were estimated by using a 2-tailed pairedttest. Multilinear regression anal-ysis was used to evaluate the relationships between disease laterality (right eye versus left eye) and the clinical variables. Statistical analyses were performed by using the Statistical Package for the Social Sciences software, Version 16.0 (SPSS, Chicago, Illinois). APvalue⬍.05 was accepted as significant.
Results
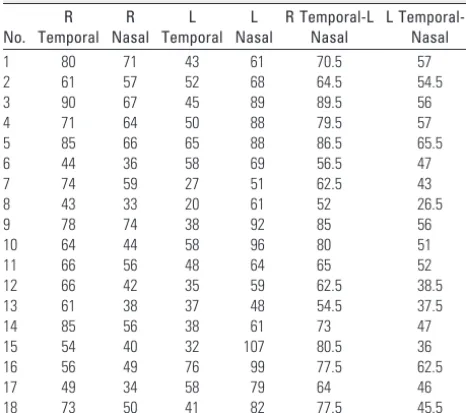
The normality of distribution of the variables was confirmed by the Kolmogorov-Smirnov test. Univariate analysis showed that in the left eye, the RNFLT was thinner in the temporal than in the nasal quadrant, whereas in the right eye, the RNFLT was thinner in the nasal than in the temporal quadrant (P⬍.001) (Tables 1 and 2). The combined left temporal and right nasal RNFLTs (48.8⫾13.82m) were significantly thin-ner than the right temporal and left nasal RNFLTs (71.16⫾ 16.36m) (P⬍.001). No significant differences were ob-served in the C/D, mean deviation, and PSD between the right and left eyes (Table 2). Multilinear regression analysis indi-cated that disease laterality was associated only with temporal RNFLT (P⬍.001) and nasal RNFLT (P⬍.001), and it was independent of the C/D (P⫽.397), mean deviation (P⫽
.942), and PSD (P⫽.367). There was a trend toward a greater number of WMH in patients (total, 162; mean, 9.0⫾9.8) compared with controls (total, 71; mean, 3.9⫾2.8) (P⫽
.056).
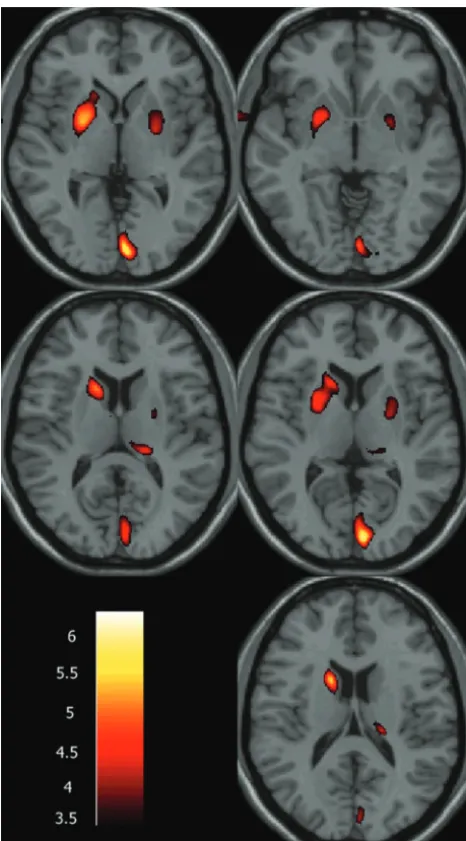
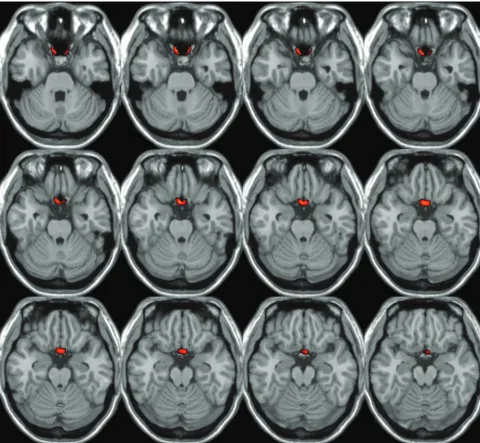
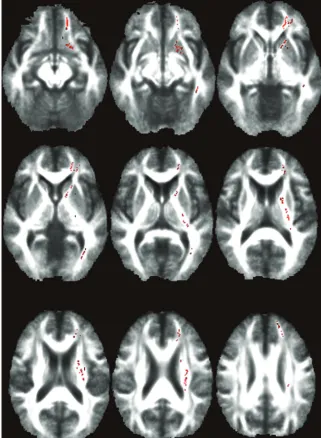
VBM revealed a significant volume reduction in patients with POAG in the intracranial part of the ONs and the chiasma in the left LGN and left visual cortex (BA17, BA18) (P⬍.05) (Table 3 and Figs 1 and 2). A significant decrease of FA was observed in patients with POAG in the inferior fronto-occip-ital fasciculus, the longitudinal and inferior frontal fasciculi, the putamen, the caudate nucleus, the anterior and posterior thalamic radiations, and the anterior and posterior limbs of the internal capsule of the left hemisphere (Table 4 and Fig 3) (P⬍.05). No MD differences were detected between patients with POAG and control subjects.
Discussion
[image:3.594.52.285.58.264.2]Glaucoma affects nearly 60 million individuals worldwide, and it is one of the leading causes of irreversible blindness. The pathologic hallmark of glaucoma is retinal ganglion cell loss. Although the retinal cell body lies within the eye, the larger part of its axon lies outside the eye, forming the ON, the chi-asma, and the optic tract; 90% of the retinal ganglion cells terminate in the LGN, the major relay station between the Table 1: RNFLT (m) using Stratus OCT 3 in the 18 patients
No. R Temporal R Nasal L Temporal L Nasal R Temporal-L Nasal L Temporal-R Nasal
1 80 71 43 61 70.5 57
2 61 57 52 68 64.5 54.5
3 90 67 45 89 89.5 56
4 71 64 50 88 79.5 57
5 85 66 65 88 86.5 65.5
6 44 36 58 69 56.5 47
7 74 59 27 51 62.5 43
8 43 33 20 61 52 26.5
9 78 74 38 92 85 56
10 64 44 58 96 80 51
11 66 56 48 64 65 52
12 66 42 35 59 62.5 38.5
13 61 38 37 48 54.5 37.5
14 85 56 38 61 73 47
15 54 40 32 107 80.5 36
16 56 49 76 99 77.5 62.5
17 49 34 58 79 64 46
18 73 50 41 82 77.5 45.5
Note:—R indicates right; L, left.
Table 2: Mean valuesⴞSDs of the C/D, MD, PSD, RNFLT using Stratus OCT 3 and visual acuity in the group of patients with POAG
C/D MD (dB) PSD (dB)
RNFLT Temporal (m)
RNFLT Nasal
(m) Visual Acuity
Right eye 0.68⫾0.21 ⫺9.76⫾10.24 5.81⫾4.78 66.66⫾14.07 52.0⫾13.22 0.91⫾0.23 Left eye 0.62⫾0.21 ⫺9.51⫾10.35 4.78⫾2.92 45.61⫾14.02 75.66⫾17.61 0.84⫾0.27
[image:3.594.300.532.69.154.2]PValue (pairedttest) .397 .942 .367 ⬍.001 ⬍.001 .41
Table 3: Location and size of significantly reduced GM areas in patients with glaucoma, relative to controlsa
Volume (mm3)
Z Score
Talairach Coordinates
(x, y, z) (mm) Region
1912 4.99 ⫺6,⫺90, 4 Left calcarine 4000 4.69 16, 10, 14 Right caudate 992 4.01 ⫺16,⫺28, 12 Left pulvinar 1800 3.89 ⫺24,⫺4,⫺2 Left putamen 368 3.74 24,⫺48, 64 Right superior parietal 80 3.29 ⫺8,⫺64, 56 Left precuneus aTalairach coordinates andzscores are for voxels of maximal statistical significance for
[image:3.594.59.532.672.730.2]retina and the visual cortex. The cells of the LGN project to the primary visual cortex, which corresponds to BA 17. The pri-mary visual cortex sends a large proportion of its connections to the secondary visual cortex, BAs 18 and 19. Neurons in the central nervous system may undergo atrophy or cell shrinkage in response to a given insult, and persistence of the pathologic state may lead to neuronal death. Wallerian degeneration is a well-known process in neurodegenerative diseases.5 Conse-quently, glaucomatous optic neuropathy can produce loss not only of retinal ganglion cells and their axons but also of neural cells in the LGN and, to some extent, even of the visual cortex. The present study, by using VBM and voxel-based DTI anal-ysis in patients with POAG, demonstrated several structural changes in the optic pathway.
VBM demonstrated a significant reduction in the intracra-nial part of the ONs and the chiasma. A previous study by
using magnetization-transfer imaging and conventional MR imaging also demonstrated ON atrophy and degeneration of the chiasma in patients with POAG.8In agreement with the present study, Kashiwagi et al,22by using conventional MR imaging, demonstrated atrophy of the retrobulbar ON in pa-tients with POAG and normal-tension glaucoma. The diame-ter of the ON and the chiasma height were both less in patients with glaucoma. Both parameters were also significantly corre-lated with mean deviation and the C/D.22
Another finding of the present study was a significant re-duction in volume of the left LGN. Experimental studies in monkey glaucoma have demonstrated ON fiber loss associ-ated with LGN degenerative changes, with overall LGN shrinkage and reduced neuron size.23A postmortem study of human glaucoma with bilateral visual-field loss, by using his-tomorphometry and ex vivo MR imaging, demonstrated re-duced LGN and neuron size.5Gupta et al,24after obtaining LGN height measurements in vivo by 1.5T MR imaging, re-ported LGN atrophy in patients with glaucoma with symmet-ric bilateral visual-field defects. In contrast, in the present study, more pronounced atrophy was found on the left side, and this is probably related to the more pronounced atrophy of the right nasal and left temporal retinal fibers found with OCT and may be due to the small sample, because POAG is often a bilateral condition.
In addition to LGN changes, a significant reduction of GM was demonstrated in the left visual cortex (BA17, BA18). Transneuronal degeneration has been suggested as the main mechanism responsible for cortical thinning in patients with glaucoma-induced ON damage.10A recent study showed de-generative changes in the visual cortex of 8 patients with POAG and 9 patients with age-related macular degeneration by using VBM.10Another study in patients with POAG dem-onstrated a low magnetization-transfer ratio in the chiasma and the GM and WM of the calcarine fissure, suggesting optic-pathway degeneration.8In the present study, the reduction of GM, predominately in the left visual cortex, may be explained by the most pronounced atrophy of the right nasal and left temporal retinal fibers found with OCT. These fibers project to the left LGN and the left visual cortex (BA17, BA18). This lateralization may again be related to the small sample because POAG is often a bilateral condition.
Voxel-based DTI demonstrated a significant unilateral de-crease of FA at the left hemisphere in the inferior fronto-oc-cipital fasciculus, the longitudinal and inferior frontal fascic-uli, putamen, caudate nucleus, anterior and posterior thalamic radiations, and anterior and posterior limbs of the internal capsule. DTI has been successfully applied to detect ON changes occurring in the rat model of glaucoma in which a reduction of FA was observed.7Region-of-interest analysis with 3T DTI applied in the study of human glaucoma demon-strated a correlation between diffusivity scalars of the ON and optic radiation and glaucoma stage.16WM fibers of the infe-rior fronto-occipital fasciculus reach the supeinfe-rior frontal re-gion (BA 8 and BA 6), and caudally these fibers reach the inferior parietal lobule and the dorsal parietal and occipital areas (BA 7, BA 39, BA 19). All these areas have been shown to play a role in visuospatial function.25The inferior longitudinal fasciculus connects the occipital and the anterior temporal lobes. The inferior longitudinal fasciculus originates in the Fig 1.VBM findings of differences in GM volume between patients with POAG and
[image:4.594.53.286.42.462.2]anterior temporal lobe, passes through the parahippocampal gyrus, and finally reaches the pulvinar. Tractography of the
human brain has demonstrated that function of the inferior longitudinal fasciculus is highly related to visual memory, and its possible damage causes impairment of visual memory.26In the present study, the pronounced FA reduction in the left hemisphere was in accordance with the OCT findings, which demonstrated a significantly thinner RNFLT on the left.
[image:5.594.54.535.44.487.2]A decrease of FA at the putamen, caudate, anterior and posterior thalamic radiations, and anterior and posterior limbs of internal capsule was also demonstrated in this study. The thalamic nuclei (50 – 60 nuclei) project toⱖ1 well-de-fined cortical area, by using the internal capsule, both the an-terior and posan-terior limbs. This portion of the internal capsule is known as the thalamic radiation. The pulvinar, one of the lateral thalamic nuclei, is associated with visual function. Elec-trophysiologic studies have described visually responsive neu-rons with various properties within the pulvinar (direction, Fig 2.VBM results for differences in WM volume between patients with POAG and disease-free control subjects. The results of the voxel-based morphometry analysis for differences in WM volume are superimposed on an axial T1-weighted brain template. The color scale encodes areas of significant differences in WM volume between patients with POAG and control subjects. Color represents regions of WM atrophy in patients with POAG. Statistically significant differences were found only in the axial images.
Table 4: Location and size of significantly reduced FA values in patients with glaucoma, relative to controlsa
PValue
MNI Coordinates
(x, y, z) (mm) Location of Local Maxima
.038 ⫺18, 37,⫺5 Inferior fronto-occipital fasciculus .046 ⫺13, 11,⫺8 Anterior thalamic radiation .040 ⫺19, 44, 0 Forceps minor
.033 ⫺17, 17,⫺4 Anterior thalamic radiation .033 ⫺17, 7,⫺9 Putamen
.033 ⫺29,⫺28, 6 Inferior fronto-occipital fasciculus .033 ⫺32,⫺67, 5 Inferior longitudinal fasciculus .036 ⫺29,⫺10, 21 Superior longitudinal fasciculus aMNI coordinates andPvalues for voxels of maximal statistical significance for each
[image:5.594.52.286.571.677.2]color, and orientation selectivity).27Thus, the neurogenera-tive changes observed in the present study may be related to glaucoma.
This study demonstrated volume changes in key areas of the visual system and FA decrease in structures playing a more peripheral role in vision. FA is a measure of directional depen-dence of diffusion and reflects fiber attenuation and coherence within a voxel, while MD reflects the magnitude of diffusion within a voxel.28Wallerian degeneration has been associated with a decrease in FA and a slight increase or lack of change in MD. The results of this study are indicative of brain tissue loss in the principal visual pathway and of a secondary degenera-tion in more extensive brain areas related to the visual system in patients with POAG.
This study had several limitations. First, the sample size was relatively small, limiting both statistical power and the ability to control for confounding variables. This small size might be the reason for the more pronounced left-sided degeneration observed, because POAG is often a bilateral condition. Sec-ond, histologic proof of the findings cannot be provided
be-cause this was a study involving human subjects. Third, the choice to require the subject to close his or her eyes during the examination may increase eye motion. Furthermore, a limita-tion of the VBM approach is the need for spatial smoothing and the problem of arbitrarily choosing the spatial smoothing extent. The interpretation of cross-subject differences in FA when the WM is mixed with significant amounts of GM is another problem. Another possible confound might be a with-in-scan head motion which can increase image blurring and bias FA. Finally, measuring FA values in regions where there are crossing tracts or tract junctions may be problematic, and an artificial lowering of FA value can occur at these junctions or crossing tracts.18
Conclusions
[image:6.594.52.374.46.485.2]ease. A variety of neuroprotective agents is currently under investigation, which may show promise for the treatment of glaucoma. In this context, VBM and DTI may be useful tools for identifying and monitoring neurodegenerative changes in patients with POAG. Further studies with a larger number of patients will be needed to confirm these observations.
References
1. Quigley HA, Broman AT.The number of people with glaucoma worldwide in 2010 and 2020.Br J Ophthalmol2006;90:262– 67
2. Leske MC.Open-angle glaucoma: an epidemiologic overview.Ophthalmic Epidemiol2007;14:166 –72
3. Boland MV, Quigley HA.Risk factors and open-angle glaucoma: classification and application.J Glaucoma2007;16:406 –18
4. Gupta N, Yu¨cel YH.Glaucoma as a neurodegenerative disease.Curr Opin Oph-thalmol2007;18:110 –14
5. Gupta N, Ang LC, Noel de Tilly L, et al.Human glaucoma and neural degen-eration in intracranial optic nerve, lateral geniculate nucleus, and visual cor-tex.Br J Ophthalmol2006;90:674 –78
6. Yucel YH, Zhang Q, Weinreb RN, et al.Effects of retinal ganglion cell loss on mango-, parvo-, koniocellular pathways in the lateral geniculate nucleus and the visual cortex in glaucoma.Prog Retin Eye Res2003;22:465– 81
7. Hui ES, Fu QL, So KF, et al.Diffusion tensor MR study of optic nerve degen-eration in glaucoma.Conf Proc IEEE Eng Med Biol Soc2007;4312–15 8. Kitsos G, Zikou AK, Bagli E, et al.Conventional MRI and magnetisation
trans-fer imaging of the brain and optic pathway in primary open-angle glaucoma.
Br J Radiol2009;82:896 –900
9. Astrakas LG, Argyropoulou MI.Shifting from region of interest (ROI) to voxel-based analysis in human brain mapping.Pediatr Radiol 2010;40: 1857– 67
10. Boucard CC, Hernowo AT, Maguire RP, et al.Changes in cortical grey matter density associated with long-standing retinal visual field defects.Brain
2009;132:1898 –906
11. Sundgren PC, Dong Q, Gomez-Hassan D, et al.Diffusion tensor imaging of the brain: review of clinical applications.Neuroradiology2004;46:339 –50 12. Neil J, Miller J, Mukherjee P, et al.Diffusion tensor imaging of normal and
injured developing human brain: a technical review.NMR Biomed2002;15: 543–52
13. Pierpaoli C, Barnett A, Pajevic S, et al.Water diffusion changes in wallerian
degeneration and their dependence on white matter architecture.Neuroimage
2001;13:1174 – 85
14. Song SK, Sum SW, Ju WK, et al.Diffusion tensor imaging detects and differ-entiates axon and myelin degeneration in mouse optic nerve after retinal isch-emia.Neuroimage2003;20:1714 –22
15. Sun SW, Liang HF, Le TQ, et al.Differential sensitivity of in vivo and ex vivo diffusion tensor imaging to evolving optic nerve injury in mice with retinal ischemia.Neuroimage2006;32:1195–204
16. Garaci FG, Bolacchi F, Cerulli A, et al.Optic nerve and optic radiation neuro-degeneration in patients with glaucoma: in vivo analysis with 3-T diffusion-tensor MR imaging.Radiology2009;252:496 –501
17. American Academy of Ophthalmology.Primary open-angle glaucoma.In: American Academy of Ophthalmology.Glaucoma, 2008 –2009. San Francisco: American Academy of Ophthalmology; 2008;85–96
18. Smith SM, Jenkinson M, Johansen-Berg H, et al.Tract-based spatial statistics: voxelwise analysis of multi-subject diffusion data.Neuroimage2006;31:1487– 505
19. Smith SM.Fast robust automated brain extraction.Hum Brain Map2002;17: 143–55
20. Andersson JLR, Jenkinson M, Smith S.Non-linear optimisation. FMRIB tech-nical report.TR07JA1. FMRIB Analysis Group Technical Reports. www.fmrib. ox.ac.uk/analysis/techrep. Accessed June 28, 2007
21. Rueckert D, Sonoda LI, Hayes C.Nonrigid registration using free-form deformations: application to breast MR images.IEEE Trans Med Imaging1999; 18:712–21
22. Kashiwagi K, Okubo T, Tsukahara S.Association of magnetic resonance imag-ing of anterior pathway with glaucomatous visual field damage and optic disc cupping.J Glaucoma2004;13:189 –95
23. Ito Y, Shimazawa M, Chen YN, et al.Morphological changes in the visual pathway induced by experimental glaucoma in Japanese monkeys.Exp Eye Res
2009;89:246 –55
24. Gupta N, Greenberg G, Noel de Tilly L, et al.Atrophy of the lateral geniculate nucleus in human glaucoma detected by magnetic resonance imaging.Br J Ophthalmol2009;93:56 – 60
25. Makris N, Papadimitriou GM, Sorg S, et al.The occipitofrontal fascicle in humans: a quantitative, in vivo, DT-MRI study.Neuroimage2007;37:1100 –11 26. Shinoura N, Suzuki Y, Tsukada M, et al.Impairment of inferior longitudinal fasciculus plays a role in visual memory disturbance.Neurocase2007;13: 127–30
27. Kaas JH, Lyon DC.Pulvinar contributions to the dorsal and ventral streams of visual processing in primates.Brain Res Rev2007;55:285–96