http://www.scirp.org/journal/wjet ISSN Online: 2331-4249
ISSN Print: 2331-4222
Characterization of the Effect of Programmed
Aeration on Energy Efficiency of Microalgae
Cultivation System
Robert Bocsi
*, Dora Rippel-Petho, Geza Horvath, Laszlo Hanak, Zoltan Hodai
Institute of Chemical and Process Engineering, Department of Chemical Engineering Science, University of Pannonia, Veszprem, Hungary
Abstract
With autotrophic microalgae cultivation, we can feed back the CO2 content of
process streams and we can get lots of valuable organic compounds, among others biofuel components. For the production of energy source, we must reckon with the energy balance of the whole process. Densification and processing of microalgae can consume 50% - 70% of the energy that can be extracted from the cells, therefore the cultivation should use such a little energy as it possible. In closed cultivation systems, there are three main ener-gy intensive steps: artificial illumination, dissolution of gas compounds and mixing. We have carried out our measurements in our lab-scale screening photobioreactor system for the investigation of the most energy effective pro-gram for aeration. We have found the aeration propro-gram considerable solution for lower energy consumption in algae cultivation.
Keywords
Energy efficiency, Microalgae, Cultivation, Aeration
1. Introduction
In 2014 the total biomass production of the World was near 71 Mtoe (~2.96 EJ). 50% of its total production was biodiesel. According to the BP World energy re-view, the production was 7.4% higher than in previous year. This can be a working force to research algae to energy systems [1].
When operating an algae cultivation system we should take care of energy balance also. Considering the product specification we should keep energy con-sumption at the level as low as it possible. So it is important to keep the low energy consumption as a design objective at the beginning.
How to cite this paper: Bocsi, R., Rippel- Petho, D., Horvath, G., Hanak, L. and Ho-dai, Z. (2017) Characterization of the Effect of Programmed Aeration on Energy Effi-ciency of Microalgae Cultivation System. World Journal of Engineering and Tech-nology, 5, 481-486.
https://doi.org/10.4236/wjet.2017.53041
Received: April 27, 2017 Accepted: August 8, 2017 Published: August 11, 2017
Copyright © 2017 by authors and Scientific Research Publishing Inc. This work is licensed under the Creative Commons Attribution International License (CC BY 4.0).
In an operating cultivation system, we should take care of the following needs of algae cells: sufficient flux of light in photosynthetically active radiation (PAR) spectra, carbon source, mixing, and temperature management.
Though sunlight can be used for cultivation, the length of daily light cycles cannot be influenced. Artificial light sources can be used also, if the spectra of emitted light is in the PAR region but we should calculate on additional energy consumption. The energy efficiency of the light source depends not only on heat conversion but there is a strong relationship of the ratio of PAR photon flux and total photon flux.
Ageing process can be also observed at artificial light sources that lead to low-er photon flux and lowlow-er efficiency [2][3].
There are two main reasons for algae suspension mixing. The first reason is the intensification of dissolving CO2 in suspension. The second reason is to keep
floating all algae cell to avoid sedimentation that leads to bad light distribution in the reactor. Near constant light flux the optical density increases by the in-creasing biomass concentration. In this case the lowering available photon flux at the deeper layer in algae suspension leads to light limitation. Proper gas dis-tribution system necessarily solves the mixing problem, however there might be necessary to use mechanical mixing especially in open pond. Direct sunlight can be used as light source but without system cooling the suspension will be heated to 40˚C or higher that is over the optimal range (20˚C - 35˚C) [4][5][6].
In photoautotrophic cultivation process CO2 is in dissolved or hydrogen
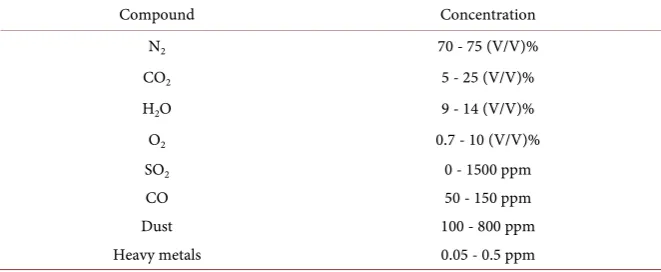
bonate form that depends on pH. Obvious solution that we use that kind of car-bon source is accessible on site. This source can be flue gas (average composition see in Table 1), natural gas or biogas. In this case, additional energy consump-tion can be occurred when the pressure of the input source is too low to be dis-persed thru gas distribution system. When undesirable components (dust, SOX,
H2S) are present then we should take care of partial or total separation before
feed into the reactors [7][8].
2. Materials and Methods
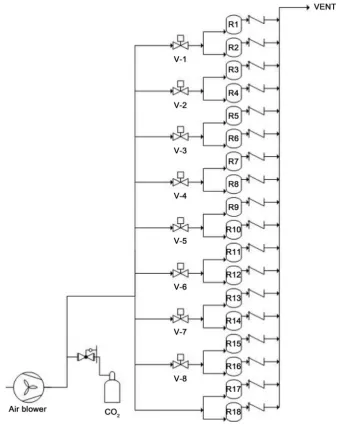
[image:2.595.207.538.599.735.2]We have set up the gas distribution system for our previously installed lab-scale PBR medium test system. CO2 input was mixed with filtered air and distributed
Table 1. Average flue gas composition.
Compound Concentration
N2 70 - 75 (V/V)%
CO2 5 - 25 (V/V)%
H2O 9 - 14 (V/V)%
O2 0.7 - 10 (V/V)%
SO2 0 - 1500 ppm
CO 50 - 150 ppm
Dust 100 - 800 ppm
by the following program.
2.1. Lab Scale PBR System and Gas Distribution System
The wall of the cylindrical reactors made of PET. The system contains mem-brane blower, T2.5 CO2 gas cylinder, and static gas mixer. Each 1 dm3 reactor
have individual immersed gas dispenser for uniform gas supplement with sole-noid valve for input and non-return valve for the gas output (see Figure 1).
For the execution of gas dispensing program we have used ADAM-5000/TCP (Advantech) Ethernet-based distributed DA & C system with ADAM-5069 8- channel relay module extension. The gas distribution program was adapted to
ADAMVIEW Data Acquisition software environment.
2.2. Gas Supply, Dosing Program
[image:3.595.203.541.293.719.2]Photoautotrophic creatures use CO2 and light for photosynthetic activity in light
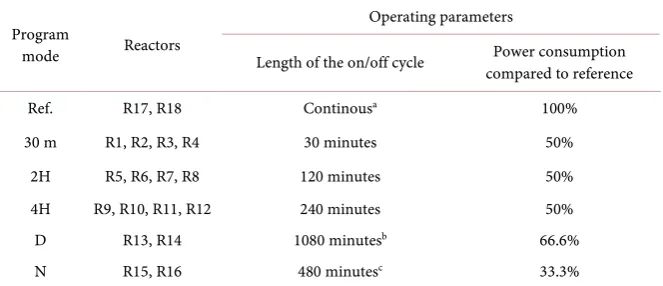
Table 2. Gas dispensing program and relative energy consumption.
Program
mode Reactors
Operating parameters
Length of the on/off cycle compared to reference Power consumption
Ref. R17, R18 Continousa 100%
30 m R1, R2, R3, R4 30 minutes 50%
2H R5, R6, R7, R8 120 minutes 50%
4H R9, R10, R11, R12 240 minutes 50%
D R13, R14 1080 minutesb 66.6%
N R15, R16 480 minutesc 33.3%
a. Reference mode, continous aeration; b. The time shift of mode was in light mode; c. The time shift of mode was in dark mode.
phase. In dark phase there is no light for the photosynthetic activity, so algae use no CO2.
The gas feed stream contains 8 (V/V)% CO2 mixed in air with 540 dm3/h total
gas flowrate.
We have designed the program that each pairs of solenoid working with the same time cycle but they are in opposite (on/off) status. So the number of opened or closed valves was the same in every minute. This was good for mini-mizing the of pressure fluctuation in gas distribution system. The D and N mode were the opposites.
The length of dosing time was between 30 minutes and 16 hours. Accordingly the power consumption of the gas distribution system for the reactors was be-tween 33% and 66% compared to reference (see in Table 2).
2.3. Other Operating Parameters
We used Sylvania Aquastar T8 fluorescent tube for the artificial lighting in 16/8 light dark cycles. This type of fluorescent tubes are intended to be used for pro-mote the growth of aquatic plants, because they have high emission maximum in red and blue light spectrum.
We have used PQS-1 PAR Quantum sensor paired with Logbox SD data log-ger (Kipp & Zonen) for the quantification of the irradiation. According the logged radiation data we have ascertained that there was no significant differ-ence between the intensity of irradiation in light cycles.
For cultivation batch we have used enrichedBG-11 culturing medium with 80 mg/dm3 nitrate content. BG-11 medium is commonly used for blue-green algae
cultivation. The modification was made for promote biomass production. The temperature of suspensions was 17˚C ± 1˚C.
The duration time of each test was 7 days.
measurement at 90˚C (R2 = 0.999).
3. Results and Discussion
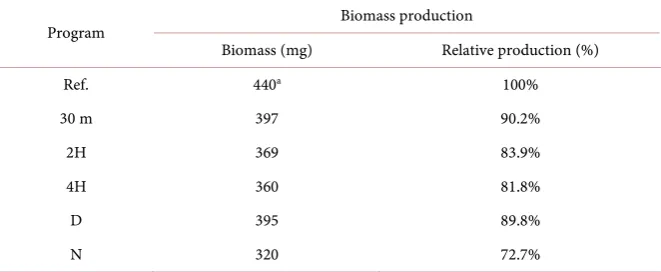
All cultivation tests were carried out in minimum two parallel reactors and it has been repeated twice. Table 3 contains the biomass production that occurred in each mode. Calculations made from the relevant measurement data and con-tained results where the maximum deviation was 5%.
The results can be aligned in 3 groups regarding to relative biomass produc-tion.
The first group contains 30 m and D where relative biomass production is ~ 90%. These settings are the nearest to continuous gas supplement mode.
The second group contains 4H and 2H mode where the relative biomass pro-duction is ~80%. In these modes there are such long time periods where partial sedimentation can start.
[image:5.595.208.539.359.495.2]The third group is the dark aeration mode. Here we can reach only ~73% rela-tive biomass production but in this case we use only 33% of reference energy consumption (Figure 2).
Table 3. Biomass production using gas dispenser program.
Program Biomass production
Biomass (mg) Relative production (%)
Ref. 440a 100%
30 m 397 90.2%
2H 369 83.9%
4H 360 81.8%
D 395 89.8%
N 320 72.7%
[image:5.595.209.514.461.714.2]a. Reference mode, continuous gas supply.
4. Conclusions
We have concluded that energy consumption of gas dispensing in algae cultiva-tion can be lowering to 50% for the price of 10% biomass loss.
Considering relative energy consumption and relative biomass production, we can state that 50% of energy saving can be reached with only 10% biomass loss by using 30 minutes aeration cycles.
Aeration in only dark phase can be a choice but we should consider its effects on sedimentation, and 30% biomass loss.
It could be reasonable to investigate how these correlations can be imple-mented in open pond systems.
References
[1] BP Statistical Review of World Energy, June 2015, bp.com/statistical review, 2016.02.24.
[2] Ogbonna, J.C. and Tanaka, H. (2000) Light Requirement and Photosynthetic Cell Cultivation: Development of Processes for Efficient Light Utilization in Photobio-reactors. Journal of Applied Phycology, 12, 207-218.
[3] Doucha, J., Straka, F. and Livansky, K. (2005) Utilization of Flue Gas for Cultivation of Microalgae (Chlorella sp.) in an Outdoor Open Thin-Layer Photobioreactor. Journal of Applied Phycology, 17, 403-412.
https://doi.org/10.1007/s10811-005-8701-7
[4] Van Den Hende, S., Vervaeren, H. and Boon, N. (2012) Flue Gas Compounds and Microalgae: (Bio-)chemical Interactions Leading to Biotechnological Opportunities. Biotechnology Advances, 30, 1405-1424.
https://doi.org/10.1016/j.biotechadv.2012.02.015
[5] Kim, J., Lee, J.-Y. and Lu, T. (2014) Effects of Dissolved Inorganic Carbon and Mixing on Autotrophic Growth of Chlorella vulgaris. Biochemical Engineering Journal, 82, 34-40. https://doi.org/10.1016/j.bej.2013.11.007
[6] Raeesossadati, M.J., Ahmadzadeh, H., McHenry, M.P. and Moheimani, N.R. (2014) CO2 Bioremediation by Microalgae in Photobioreactors: Impacts of Biomass and
CO2 Concentrations, Light, and Temperature. Algal Research, 6, 78-85.
[7] Blanken, W., Cuaresma, M., Wijffels, R.H. and Janssen, M. (2013) Cultivation of Microalgae on Artificial Light Comes at a Cost. Algal Research, 2, 333-340,
https://doi.org/10.1016/j.algal.2013.09.004
Submit or recommend next manuscript to SCIRP and we will provide best service for you:
Accepting pre-submission inquiries through Email, Facebook, LinkedIn, Twitter, etc. A wide selection of journals (inclusive of 9 subjects, more than 200 journals)
Providing 24-hour high-quality service User-friendly online submission system Fair and swift peer-review system
Efficient typesetting and proofreading procedure
Display of the result of downloads and visits, as well as the number of cited articles Maximum dissemination of your research work