D S Sharma, R Sangal and E Sherly. Proc. of the 12th Intl. Conference on Natural Language Processing, pages 2–10, Trivandrum, India. December 2015. c2015 NLP Association of India (NLPAI)
Addressing Class Imbalance in Grammatical Error Detection with
Evaluation Metric Optimization
Anoop Kunchukuttan, Pushpak Bhattacharyya
Center for Indian Language Technology Department of Computer Science and Engineering
Indian Institute of Technology Bombay {anoopk,pb}@cse.iitb.ac.in
Abstract
We address the problem of class imbalance insupervisedgrammatical error detection (GED) for non-native speaker text, which is the result of the low proportion of erro-neous examples compared to a large num-ber of error-free examples. Most learn-ing algorithms maximizeaccuracywhich is not a suitable objective for such imbal-anced data. For GED, most systems ad-dress this issue by tuning hyperparame-ters to maximize metrics likeFβ. Instead,
we show that learning classifiers that di-rectly learn model parameters by optimiz-ing evaluation metrics likeF1andF2score
deliver better performance on these met-rics as compared to traditional sampling and cost-sensitive learning solutions for addressing class imbalance. Optimizing these metrics is useful in recall-oriented grammar error detection scenarios. We also show that there are inherent difficul-ties in optimizing precision-oriented eval-uation metrics likeF0.5. We establish this
through a systematic evaluation on multi-ple datasets and different GED tasks.
1 Introduction
The task of grammatical error detection (GED) and grammatical error correction (GEC) refers to the identification and repair of grammatical er-rors in text generated by speakers of a language (native/non-native). Many techniques, rule-based as well as machine learning based, have been pro-posed for addressing this task. A common and successful method for building grammatical er-ror detection (GED) systems is to apply super-vised learningon annotated learner corpora. For instance, the problem of noun number error detec-tion can be formulated as a task of classifying if
Task Errors Tokens Error Rate
Article 6658 234,695 2.84% Noun Number 3379 245,026 1.38% Preposition∗ 1955 123,419 1.58%
Table 1: Error rates for GED tasks (NUCLE)
∗statistics for 10 most frequent prepositions
the head noun of a noun phrase has the correct
or incorrectgrammatical number. As opposed
to rule-based methods, classification methods can easily incorporate complex and arbitrary evidence as features. Some of the best performing sys-tems for the most frequent grammatical errors,viz.
noun number, article and preposition errors, are classification systems (Ng et al., 2013).
However, a major problem in learning classi-fiers from an annotated learner corpus is the very lowerror rate(number of errors per token) in the corpus (Chodorow et al., 2012). For instance, the error rates are less than 3% for noun-number, arti-cle and preposition errors in the NUCLE annotated learner corpus (Dahlmeier et al., 2013) as shown in Table 1. Such low error rates (less than 5%) have been observed across various learner corpora (see Table 2)viz. the NUCLE corpus (Dahlmeier et al., 2013), HOO12 corpus (Dale et al., 2012) and NICT-JLE corpus (Izumi et al., 2004). Thus, learning classifiers for GEC/GED from annotated learner corpora is a case of learning a classifier from animbalanced dataset i.e.a dataset where the class ratios are highly skewed (He and Garcia, 2009). In contrast to many imbalanced problems studied in datamining literature, GED tasks are characterized by large and sparse features spaces and very high imbalance ratios.
Corpus Tokens Errors %Error Rate NUCLE 1,161,567 46,597 3.82 HOO12 374,680 8,432‡ 2.25‡
NICT-JLE 169,662 14,407 8.49
Table 2: Errors statistics for learner corpora
‡articles and prepositions errors only
anced datasets. Moreover, accuracy is not the right evaluation metric for GED. Non-native language learners require a GED system with ahigh preci-sionso that they are not misguided by wrong er-ror notifications. On the other hand, professional copy-editors and language instructors will require a high recallsystem that helps improve produc-tivity and quality of service by identifying all po-tential errors that need review, even at the cost of flagging some spurious errors. Hence, a precision oriented optimization objective likeF0.5and a
re-call oriented objective likeF2 would be
appropri-ate for non-native speakers and copy-editors re-spectively.In this paper, we explore the hypothesis that by directly optimizing the desired evaluation metric, we can satisfy the requirements of asym-metric misclassification cost and customization of the recall/precision trade-off.
The following are the contributions of our work:
• Sampling and example-weighting methods have been traditionally applied to overcome this limitation. We systematically investi-gate different solutions to the class imbal-ance problem for three GED tasks (noun number, article and preposition) over mul-tiple annotated learner corpora. We com-pare the following sampling methods over a range of sampling ratios: random under-sampling, Synthetic Minority Over-sampling Technique (SMOTE) and example weighting. We analyze and present experimental results to demonstrate the limitations of these tradi-tional methods in addressing class imbalance.
• As an alternative to sampling methods, we propose that a GED classifier be learnt by di-rectly optimizing the evaluation metrics, typ-ically F1, F2 orF0.5. For copy-editors, F2
is a suitable evaluation measure which ad-dresses the need for high recall in GED. We use the performance measure optimization framework proposed by Joachims (2005) for optimizing these metrics. For the three GED
tasks under consideration, we show that opti-mizing theF2 metric of theincorrectclass
gives better performance compared to sam-pling methods.
• We also show that evaluation metric opti-mization, as well as sampling methods, are not suitable for improving precision. While evaluation metric optimization helps improve recall and obtain a reasonable precision-recall trade-off, improving precision remains a challenge.
The rest of the paper is organized as follows. Section 2 describes the limitations of sampling methods, motivates the use of evaluation metrics optimization for imbalanced data problems, and the use of F2 as an evaluation metric for GED.
Sections 3 and 4 discuss the related work and the learning algorithm used for directly optimiz-ing evaluation metrics. Section 5 explains classi-fiers for the GED tasks under consideration, while Section 6 describes our experimental setup. We analyze results in Section 7. Section 8 summarizes our contributions and describes possible future di-rections.
2 Motivation
There are many GED applications where users do not consider false positive and false negative er-rors as equally damaging. To copy-editors, false negative errors are costlier than false positive er-rors. They would not mind evaluating a few false alarms, but cannot afford to miss genuine er-rors since that would affect the quality of service. They would prefer the GED system to err on the side of higher recall. Similarly, translators using computer-aided translation systems would prefer to have most errors pointed out. Even an auto-matic post-editing system for MT would prefer to have most errors identified since alternatives can then be evaluated for these potential errors in a post-editing stage.
We hypothesize that by directly optimizing the desired evaluation metric, we can satisfy the re-quirements of asymmetric loss and customization of the recall/precision trade-off. For a GED sys-tem designed to help copy-editors, F2 would be
a reasonable choice as an optimization objective since it is biased towards recall. Similarly, F0.5
β = 0.5,2follows the conventional choices
men-tioned in literature for evaluating precision and re-call bias.
Traditionally, sampling and example-weighting have been the most common methods to han-dle class imbalance. Sampling involves either
undersampling the correct examples or
over-sampling the incorrect examples in the
train-ing set (Van Hulse et al., 2007; Domtrain-ingos, 1999). In example-weighting, misclassification costs are associated with the training examples, with higher misclassification costs for wrongly classifyingincorrectexamples (Zadrozny et al.,
2003). In theory, example-weighting and sam-pling techniques can be shown to be equivalent (Zadrozny et al., 2003), and in the rest of the paper we usesamplingto refer to both. However, sam-pling methods have a few limitations which direct optimization of the performance metrics does not suffer from:
• Even the choice of sampling ratio is arbitrary and its effect on the evaluation metrics is not obvious. A validation set may be used to se-lect the appropriate ratio which maximizes the evaluation metric, at the cost of setting aside some valuable training data for tuning. On the other hand, while optimizing an eval-uation metric, it naturally induces a loss func-tion.
• A high degree of undersampling is required to negate the effect of the very low error rate in GED tasks. However, this results in a dras-tic reduction in the examples available for training. Random undersampling has been reported to work reasonably on some datasets with a dense feature space and a small num-ber of features (Van Hulse et al., 2007). In contrast, the classification problems for GED results are characterized by large and sparse feature spaces leading to a loss of many fea-tures due to undersampling. Optimizing eval-uation metrics directly does not incur this loss since data is not sampled prior to learning.
• Oversampling with repetition of incorrect
class instances generally does not improve classification performance and results in overfitting. Informed oversampling through introduction of synthetic instances belong-ing to the minority class (SMOTE) by in-terpolation of minority class instances in the
training set has shown good improvement in many applications (Chawla et al., 2002). For large feature spaces, the generation of syn-thetic examples can be computationally ex-pensive since it involves a k-nearest neigh-bourhood search. Optimizing evaluation met-rics directly does not incur this computational overhead.
3 Related Work
The most common methods to handle imbal-anced datasetsin GED involve undersampling the
correct instances (Dahlmeier et al., 2012;
Pu-tra and Szabo, 2013; Kunchukuttan et al., 2013) or oversampling the incorrect instances (Xing
et al., 2013). Rozovskaya et al. (2012) pro-pose an error inflation method for preposition error correction, where a fraction of the cor-rect prepositions are marked as incorcor-rect prepo-sitions and these new “erroneous” instances are distributed among different possible erroneous prepositions. This method is similar to the Meta-Cost (Domingos, 1999) approach of re-labelling examples in the training set according to a cost function. Some whole-sentence correction ap-proaches (Kunchukuttan et al., 2014; Junczys-Dowmunt and Grundkiewicz, 2014; Dahlmeier and Ng, 2012) are tuned to maximize the Fβ
scores.
In all the work mentioned above, the sys-tems maximize Fβ by tuning only the
“hyper-parameters” like sampling threshold, features weights for scores of underlying components —classifier (Dahlmeier and Ng, 2012) or SMT component scores (Kunchukuttan et al., 2014; Junczys-Dowmunt and Grundkiewicz, 2014) —on a tuning dataset using approximate methods like MERT (Och, 2003), PRO (Hopkins and May, 2011) and grid search. In contrast, we optimize all the model parametersexactly and efficientlyto maximizeFβ.
4 Optimizing Performance Measures
A loss function like the induced Fβ loss is
puted from the contingency table1. It is applicable
only to binary classification problems.
The training loss is described in terms of a loss function (∆) which measures the discrepancy
be-tween the expected output vector (¯y) and observed output vector (¯y0) on training data of sizem:
∆ : (y1...yi...ym)×(y10...y0i...y0m)→R (1)
For a decomposable loss functions like 0-1 loss, hinge loss,etc. we can express the loss as:
∆(y,y) =
m
X
i=1
∆0(yi, yi0) (2)
where, ∆0 is the loss function for a single
in-stance:
∆0 :y×y0 →R (3)
In the max-margin framework, a decomposable loss function (hinge loss in the example below) can be minimized by solving the following objec-tive function for support vector machines (SVM):
min1
2w.w+C
n
X
i=1
ξi (4)
s.t:∀ni=1:yi[w.xi]≥1−ξi (5)
Here,ξi = 1−yi[w.xi]is an upper bound on the loss (∆0) for theithtraining instance.
However, non-decomposable loss functions cannot be modeled in this framework since the constraint, and hence the loss, is defined per in-stance. We need a framework to represent the problem in terms of loss over the entire training set (i.e.the observed and expected label vector) using a custom loss function. TheStructSVMframework (Tsochantaridis et al., 2005) provides the ability to define custom loss functions over arbitrary output structures like vectors, trees, etc. Joachims (2005) framed the binary classification problem with non-decomposable loss functions as a structured pre-diction problem, where the entire training set be-comes a single instance. The input (¯x) is a tuple of the original features vectors (xi) and output is the label vector (¯y) . The training objective can be represented as:
min1
2w.w+Cξ (6)
1http://en.wikipedia.org/wiki/
Confusion_matrix
Noun Number
O: It was great to see theexcitementson the child’s face. C: It was great to see theexcitementon the child’s face. Article Preposition
O: I want to buy pen. Keep the peninthe table. C: I want to buyapen. Keep the penonthe table. O: original, C: corrected
Table 3: Examples of grammatical errors
O: original, C: corrected
subject to the following constraints
∀y¯0 ∈ Y \¯y:hw, δΨ(x¯,y¯0)i ≥∆(y¯,¯y0)−ξ (7)
where,
δΨ(x¯,¯y0) = Ψ(¯x,y¯)−Ψ(¯x,y¯0) (8)
Ψ(x¯,¯y0) =
m
X
i=1
yi0xi (9)
Thus any label vector of the training set (¯y0) other than the expected label vector (y¯) would in-cur a loss upper bounded by:
ξ= ∆(y¯,¯y0) + Ψ(¯x,¯y0)−Ψ(¯x,¯y) (10)
where, ∆ is a custom loss function between the
expected and observed label vectors.
The number of constraints is exponential inm, since there are 2m − 1 possible values of y¯0. However, the above optimization problem can be solved efficiently in a polynomial number of itera-tions using an iterative, cutting plane algorithm. The efficiency of the overall algorithm depends on the efficiency of finding the most violated con-straint,i.e.finding the¯y0 which maximizes Equa-tion 10. This loss-augmented inference problem
can be solved in polynomial time for binary clas-sification problems involving loss functions which can be computed from the contingency table e.g.
Fβ, precision, recall loss.
5 Grammatical Error Detection Classifiers
The GED tasks and the classifiers under study are described in this section.
5.1 Tasks
We consider the following three GED tasks: Noun Number (NN), Article (Art) and Preposition (Prep)
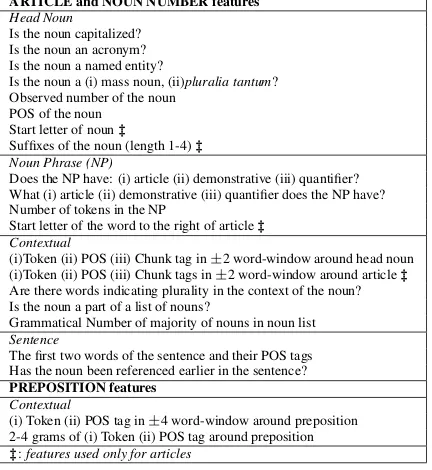
ARTICLE and NOUN NUMBER features
Head Noun
Is the noun capitalized? Is the noun an acronym? Is the noun a named entity?
Is the noun a (i) mass noun, (ii)pluralia tantum? Observed number of the noun
POS of the noun Start letter of noun‡
Suffixes of the noun (length 1-4)‡ Noun Phrase (NP)
Does the NP have: (i) article (ii) demonstrative (iii) quantifier? What (i) article (ii) demonstrative (iii) quantifier does the NP have? Number of tokens in the NP
Start letter of the word to the right of article‡ Contextual
(i)Token (ii) POS (iii) Chunk tag in±2 word-window around head noun (i)Token (ii) POS (iii) Chunk tags in±2 word-window around article‡
Are there words indicating plurality in the context of the noun? Is the noun a part of a list of nouns?
Grammatical Number of majority of nouns in noun list
Sentence
The first two words of the sentence and their POS tags Has the noun been referenced earlier in the sentence?
PREPOSITION features
Contextual
(i) Token (ii) POS tag in±4 word-window around preposition 2-4 grams of (i) Token (ii) POS tag around preposition
[image:5.612.82.298.41.276.2]‡:features used only for articles
Table 4: Feature set for various GED tasks
error detection. A few examples of these errors are shown in Table 3.
Each is a binary classification task which labels an instance as grammatically correct
(negative) orincorrect (positive). The training
instances for each task are defined as follows. For noun number, each noun phrase is an instance. For articles, each noun phrase con-taining the articles{a, an, the, φ} is an instance. For preposition, we consider only preposition deletion and substitution errors. We consider only the ten most frequent prepositions as instances: {on, f rom, f or, of, about, to, at, in, with, by} (Rozovskaya and Roth, 2010). The top 10 prepo-sitions account for 78% of all prepoprepo-sitions in the NUCLE corpus and 81% of all the preposition errors. The feature sets for the GED tasks are shown in Table 4.
5.2 Directly optimizing evaluation metrics
We directly optimize Fβ using the support
vec-tor method for optimizing performance measures (SVM-Perf) proposed by Joachims (2005). We chose this method since it can exactly and ef-ficiently optimize non-decomposable evaluation metrics which can be computed from the contin-gency tablee.g. Fβ. We train different classifiers
corresponding toβ = 0.5,1,2.
5.3 Sampling Methods
Sampled datasets were created from the origi-nal training set using three sampling methods. In random undersampling (Van Hulse et al., 2007), the correct instances are undersampled
at random and all incorrect instances are
re-tained in the training set. In SMOTE (Chawla et al., 2002),incorrectclass examples are
over-sampled by generating synthetic examples for
ev-ery incorrect instance using linear
interpola-tion with one of its five nearest incorrect neigh-bours. In cost-sensitive learning (Zadrozny et al., 2003), misclassifyingincorrectinstances
in-curs a higher cost as compared to misclassifying
correctinstances.
For each sampling method, sampled datasets were created using different representative sam-pling ratios (p= 0.3,0.5,1.0) which span the
en-tire range. The sampling ratio (p) refers to the ratio
of incorrect to correct examples in the
sam-pled dataset. For cost-senstive learning, the cor-responding misclassification cost ratio (J) can be computed as J = pR, where R is the ratio of
correct to incorrect instances in training set.
An SVM is trained with hinge loss on each of these sampled datasets.
6 Experimental Setup
We tested our GED systems on three annotated learner corpora: NUCLE (Dahlmeier et al., 2013), HOO11 (Dale and Kilgarriff, 2011) and HOO12 (Dale et al., 2012) shared task corpora. For the HOO12 dataset, noun number error detection was not done since the dataset did not have these anno-tations.
For hinge loss, the classifiers were trained using the SVMLight package (Joachims, b). For other loss functions, classifiers were trained using the
SVM-Perf package (Joachims, a) with extensions to optimize recall, precision and Fβ. We used a
linear kernel for all our experiments.The evalua-tion was done using Precision, Recall, F0.5, F1
andF2 metrics. The average scores over a 5-fold
cross-validation are reported.
7 Results and Discussion
7.1 Limitations of sampling methods
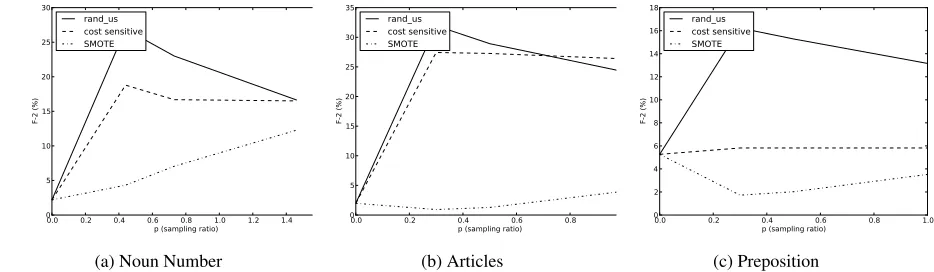
Figure 1 shows the F2 scores of sampling
0.0 0.2 0.4 0.6 0.8 1.0 1.2 1.4 1.6 p (sampling ratio)
0 5 10 15 20 25 30
F-2 (%)
rand_us cost sensitive SMOTE
(a) Noun Number
0.0 0.2 0.4 0.6 0.8 1.0
p (sampling ratio) 0
5 10 15 20 25 30 35
F-2 (%)
rand_us cost sensitive SMOTE
(b) Articles
0.0 0.2 0.4 0.6 0.8 1.0
p (sampling ratio) 0
2 4 6 8 10 12 14 16 18
F-2 (%)
rand_us cost sensitive SMOTE
[image:6.612.76.543.47.183.2](c) Preposition Figure 1: Comparison of sampling methods on NUCLE dataset (scores in %)
Dataset Method F0Noun Number Article Preposition
.5 F1 F2 F0.5 F1 F2 F0.5 F1 F2
NUCLE
Hinge Loss 7.80 3.42 2.19 6.92 3.07 1.98 15.37 7.85 5.27
Random Undersampling (p=0.3) 11.01 15.62 26.89 14.57 20.01 31.94 6.75 9.53 16.23 Cost-Sensitive (p=0.3) 10.46 13.43 18.79 18.58 22.15 27.43 13.53 8.14 5.82 SMOTE (p=1.0) 18.91 14.74 12.27 10.50 5.78 4.00 10.52 5.28 3.52 SVM-PerfF0.5 14.93 19.17 26.82 17.74 22.34 30.17 6.39 9.41 17.84 SVM-PerfF1 15.72 19.92 27.24 17.95 22.65 30.72 6.60 9.70 18.28 SVM-PerfF2 13.72 18.43 28.08 18.02 22.65 30.51 6.55 9.63 18.15
HOO-11
Hinge Loss 18.48 14.15 11.64 35.55 29.87 25.85 28.90 16.92 12.22 Random Undersampling (p=0.3) 3.55 5.36 10.98 14.64 19.54 29.42 9.90 11.96 15.20 Cost-Sensitive (p=0.3) 18.48 14.15 11.64 33.88 29.49 26.23 28.90 16.92 12.22 SMOTE (p=1.0) 18.48 14.15 11.64 34.28 29.64 26.19 28.90 16.92 12.22 SVM-PerfF0.5 4.42 6.45 11.98 25.86 27.89 30.44 26.67 17.69 13.32 SVM-PerfF1 4.42 6.45 11.98 24.06 28.12 33.88 24.84 17.19 13.21 SVM-PerfF2 4.70 6.96 13.42 18.58 24.01 34.05 12.69 14.39 16.81
HOO-12
Hinge Loss 7.66 3.74 2.47 17.63 10.14 7.12
Random Undersampling (p=0.3) 10.11 13.75 21.50 12.26 15.91 22.66
Cost-Sensitive (p=0.3) 14.66 16.79 19.65 17.58 11.47 8.51
SMOTE (p=1.0) 7.28 3.90 2.66 12.74 6.83 4.68
SVM-PerfF0.5 11.37 15.05 22.29 12.79 17.01 25.42
SVM-PerfF1 11.69 15.22 21.83 10.84 15.11 24.91
[image:6.612.78.551.219.460.2]SVM-PerfF2 11.94 15.48 22.02 9.48 13.80 25.32
Table 5: Comparison of SVM-Perf with best sampling methods (scores in %)
that the scores vary sharply with sampling ra-tio, making the choice of the right sampling ratio extremely important. Undersampling techniques show a sharp increase in recall with increasing sample ratios (up to 20%), but a sharp drop in pre-cision with increase in sampling ratio (halving the precision in some cases). Thus, the methodology does not offer much in terms of achieving a good precision-recall trade-off. The drastic variation in-dicates that the bias introduced by the sampling ra-tio is driving the classifier’s decision and the train-ing data’s role is made irrelevant due to sampltrain-ing loss.
In general, we can observe a trend that un-dersampling and cost-sensitive techniques per-form best at low sampling ratios (p=0.3), whereas SMOTE performs best at higher sampling ratios
(p=1.0). This is a consequence of the high im-balance ratio for GED tasks. However, there is no sampling method that is uniformly best across tasks and evaluation metrics. Empirical cross-validation is the only way to determine the best sampling method and configuration for a particu-lar task.
7.2 SVM-Perf vs. sampling methods
Table 5 shows F1, F2 and F0.5 evaluation
for various SVM-Perf classifiers (optimized for Fβ=0.5,1,2) and compares them with the classic
hinge loss classifier and the best undersampling, oversampling and cost-sensitive learning methods on three datasets.
For theF2 evaluation metric, optimizing F2 is
but one out of 8 cases (NUCLE, Art). Even in
this case, the performance ofFβ optimization is
comparable to the best sampling method (96% of the undersampling score). Improvements up to 15% inF2 score over the best sampling
tech-niques have been observed. For instance, on the HOO11 dataset, the F2 scores improve by about
15%, 15% and 10% over the best sampling meth-ods for the NN, Art and Prep tasks respectively.
UsingF2 optimization, the precision is generally
higher than that of the best performing sampling technique. Only in 3 cases,F2 optimization gives
slightly lowerF2 scores thanF1orF0.5
optimiza-tions (≈ 1%lesser). A GED system designed to
achieve high recall can thus benefit from optimiz-ing theF2metric.
F1 optimization gives the bestF1 score on the
NUCLE dataset for all tasks, and on some tasks on other datasets. For instance, theF1scores improve
by 27.52%, 2.26% and 1.78% over the best sam-pling methods for theNN, ArtandPrep tasks
re-spectively on the NUCLE dataset. Only on theNN
task for the HOO-11 dataset, the sampling meth-ods vastly outperformF1 optimization. On the
re-maining tasks, the performance is comparable to the best performing sampling method. In most cases, we can conclude thatF1optimization would
yield a goodF1score.
Finally, none of theFβoptimizers perform well
for F0.5 as the evaluation metric. The
preci-sion/recall analysis in the next section explains this issue.
7.3 Precision, Recall and Accuracy Analysis Table 6 shows the accuracy, precision and re-call for the classic hinge loss classifier and the best undersampling, oversampling, cost-sensitive and SVM-Perf classifiers on the NUCLE dataset. Other datasets also show similar trends.
Undersampling methods achieve higher recall (more than 70% for all tasks withp= 1.0), which
can be attributed to the strong inductive bias that alters the class prior in favour of the minority class. But there is a substantial reduction in preci-sion and accuracy. The classic SVM with no sam-pling achieves the highest precision for all tasks (more than 40% for all tasks), while SMOTE also shows higher precision (between 25-32%). But the recall is as low as 5%. The SVM-Perf classifier maintains a comparatively high precision (≈15%, except preposition GED task) as well recall
(be-tween 35-45%), while the accuracy drop com-pared to the classic hinge is comparatively less.
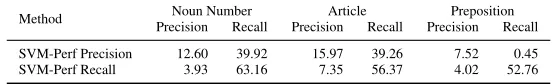
We also investigated if SVM-Perf is effective in obtaining high precision or recall by directly optimizing precision and recall respectively (see Table 7 for results). Optimizing recall signifi-cantly increases the recall over Fβ optimization,
with recall of more than 50% achieved on all tasks. However, optimizing precision does not show much improvement over the Fβ
optimiza-tion and is clearly far worse than the precision ob-tained with the baseline SVM. Precision loss can be represented as F P/(F P +T P). We can see
thatF P = 0can easily be achieved by assigning
all examples to thecorrectclass, sinceF N does not affect the precision. This loss function does not provide a sufficient bias for increasing preci-sion. This also explains why optimizing F1, F2
are more effective than optimizing F0.5 which is
precision oriented.
8 Conclusion and Future work
We have shown on multiple GED tasks and datasets that optimizing F1 and F2 outperforms
sampling for these evaluation metrics, while main-taining accuracy and precision above what is achieved through sampling methods. Directly op-timizing evaluation metrics scores over sampling since: (i) the optimization objective can incorpo-rate precision requirements and needs no empiri-cal determination of hyper-parameters, and (ii) no data loss/corruption due to sampling.
It is beneficial to use F2 optimization to learn
GED classifiers designed for recall-oriented use-cases like copyediting. The gains are largely due to improvement in recall, and we show the inher-ent difficulties in optimizing a precision-oriinher-ented metric. Future directions of work include improv-ing precision and direct optimization of evaluation metrics for grammatical errorcorrection.
A natural extension is to apply this method to error detection in native speaker text and machine translation output. Our method also has wider ap-plicability to other problems in NLP which en-counter the imbalanced dataset problem e.g. sar-casm detection, sentiment thwarting detection, WSD, NER,etc.
References
Nitesh V. Chawla, Kevin W. Bowyer, Lawrence O. Hall, and W. Philip Kegelmeyer. 2002. SMOTE:
Method ANoun NumberP R A ArticleP R APrepositionP R
Hinge Loss 98.54 54.29 1.77 97.50 42.39 1.60 98.41 42.91 4.32 Random Undersampling (p=0.3) 91.79 9.20 51.88 89.44 12.33 53.06 90.92 5.65 30.54 Cost-Sensitive(p=0.3) 95.16 9.11 25.63 94.29 16.78 32.62 98.27 24.26 4.89 SMOTE (p=1.0) 98.16 25.00 11.07 97.34 24.15 3.32 98.38 31.46 2.88 SVM-PerfF0.5 95.46 13.02 36.67 93.17 15.60 39.40 86.60 5.26 44.46
SVM-PerfF1 95.72 13.79 36.22 93.16 15.77 40.30 87.01 5.44 44.63
[image:8.612.128.488.40.116.2]SVM-PerfF2 94.39 11.72 43.19 93.26 15.86 39.68 86.97 5.40 44.24
Table 6: NUCLE dataset: Comparison of Accuracy (A), Precision (P), Recall (R) (scores in %)
Method PrecisionNoun NumberRecall PrecisionArticleRecall PrecisionPrepositionRecall
SVM-Perf Precision 12.60 39.92 15.97 39.26 7.52 0.45 SVM-Perf Recall 3.93 63.16 7.35 56.37 4.02 52.76
Table 7: NUCLE dataset: Optimizing Precision and Recall (scores in %)
Synthetic Minority Over-sampling Technique. Jour-nal of Artificial Intelligence Research, 16(1).
Martin Chodorow, Markus Dickinson, Ross Israel, and Joel R Tetreault. 2012. Problems in evaluating grammatical error detection systems. InCOLING, pages 611–628. Citeseer.
Daniel Dahlmeier and Hwee Tou Ng. 2012. A beam-search decoder for grammatical error correction. In
Proceedings of the 2012 Joint Conference on Empir-ical Methods in Natural Language Processing and Computational Natural Language Learning.
Daniel Dahlmeier, Hwee Tou Ng, and Eric Jun Feng Ng. 2012. NUS at the HOO 2012 Shared Task. In
Proceedings of the Seventh Workshop on Building Educational Applications Using NLP.
Daniel Dahlmeier, Hwee Tou Ng, and Siew Mei Wu. 2013. Building a Large Annotated Corpus of Learner English: The NUS Corpus of Learner En-glish. InProceedings of the 8th Workshop on Inno-vative Use of NLP for Building Educational Appli-cations.
Robert Dale and Adam Kilgarriff. 2011. Helping our own: The HOO 2011 pilot shared task. In Proceed-ings of the 13th European Workshop on Natural Lan-guage Generation.
Robert Dale, Ilya Anisimoff, and George Narroway. 2012. HOO 2012: A report on the preposition and determiner error correction shared task. In Proceed-ings of the Seventh Workshop on Building Educa-tional Applications Using NLP.
Pedro Domingos. 1999. Metacost: A general method for making classifiers cost-sensitive. InProceedings of the fifth ACM SIGKDD international conference on Knowledge Discovery and Data Mining.
Haibo He and Edwardo A Garcia. 2009. Learn-ing from imbalanced data. IEEE Transactions on Knowledge and Data Engineering, 21(9).
Mark Hopkins and Jonathan May. 2011. Tuning as ranking. InProceedings of the Conference on Em-pirical Methods in Natural Language Processing, pages 1352–1362. Association for Computational Linguistics.
Emi Izumi, Kiyotaka Uchimoto, and Hitoshi Isahara. 2004. The NICT JLE Corpus: Exploiting the Lan-guage Learners Speech Database for Research and Education. International Journal of the Computer, the Internet and Management.
Thorsten Joachims. Svm-perf: Support vector ma-chine for multivariate performance measures.
http://www.cs.cornell.edu/People/
tj/svm_light/svm_perf.html/.
Thorsten Joachims. Svmlight: Support vector ma-chine.http://svmlight.joachims.org/.
Thorsten Joachims. 2005. A Support Vector Method for Multivariate Performance Measures. In Pro-ceedings of the 22nd International Conference on Machine Learning.
Marcin Junczys-Dowmunt and Roman Grundkiewicz. 2014. The AMU System in the CoNLL-2014 Shared Task: Grammatical Error Correction by Data-Intensive and Feature-Rich Statistical Machine Translation. InProceedings of the Eighteenth Con-ference on Computational Natural Language Learn-ing: Shared Task.
Anoop Kunchukuttan, Ritesh Shah, and Pushpak Bhat-tacharyya. 2013. IITB System for CoNLL 2013 Shared Task: A Hybrid Approach to Grammati-cal Error Correction. InProceedings of the Seven-teenth Conference on Computational Natural Lan-guage Learning: Shared Task.
Anoop Kunchukuttan, Sriram Chaudhury, and Pushpak Bhattacharyya. 2014. Tuning a Grammar Correc-tion System for Increased Precision. In Proceed-ings of the Eighteenth Conference on Computational Natural Language Learning: Shared Task.
[image:8.612.167.444.154.196.2]Hwee Tou Ng, Siew Mei Wu, Yuanbin Wu, Christian Hadiwinoto, and Joel Tetreault. 2013. The CoNLL-2013 Shared Task on Grammatical Error Correction. In Proceedings of the Seventeenth Conference on Computational Natural Language Learning: Shared Task.
Franz Josef Och. 2003. Minimum error rate training in statistical machine translation. InProceedings of the 41st Annual Meeting on Association for Compu-tational Linguistics-Volume 1.
Desmond Darma Putra and Lili Szabo. 2013. UdS at CoNLL 2013 Shared Task. In Proceedings of the Seventeenth Conference on Computational Natural Language Learning: Shared Task.
Alla Rozovskaya and Dan Roth. 2010. Generating confusion sets for context-sensitive error correction. InProceedings of the 2010 Conference on Empirical Methods in Natural Language Processing.
Alla Rozovskaya, Mark Sammons, and Dan Roth. 2012. The UI system in the HOO 2012 shared task on error correction. InProceedings of the Seventh Workshop on Building Educational Applications Us-ing NLP.
Ioannis Tsochantaridis, Thorsten Joachims, Thomas Hofmann, and Yasemin Altun. 2005. Large mar-gin methods for structured and interdependent out-put variables. InJournal of Machine Learning Re-search.
Jason Van Hulse, Taghi M Khoshgoftaar, and Amri Napolitano. 2007. Experimental perspectives on learning from imbalanced data. In Proceedings of the 24th International Conference on Machine learning.
Junwen Xing, Longyue Wang, Derek F. Wong, Lidia S. Chao, and Xiaodong Zeng. 2013. UM-Checker: A Hybrid System for English Grammatical Error Cor-rection. InProceedings of the Seventeenth Confer-ence on Computational Natural Language Learn-ing: Shared Task.
Bianca Zadrozny, John Langford, and Naoki Abe. 2003. Cost-sensitive learning by cost-proportionate example weighting. In Third IEEE International Conference on Data Mining.