Journal of Water Resource and Protection, 2019, 11, 371-394 http://www.scirp.org/journal/jwarp ISSN Online: 1945-3108 ISSN Print: 1945-3094
DOI: 10.4236/jwarp.2019.114022 Apr. 8, 2019 371 Journal of Water Resource and Protection
Effects of Loess Cavity on Soil Moisture
Movement: Revealed by Soil Column and
HYDRUS Model
Lybun Porn
1,2, Baowen Yan
1*, Sovannaka Soun
1,2, Sereyrorth Ouk
1,21College of Water Resources and Architectural Engineering, Northwest A&F University, Yangling, China
2Faculty of Hydrology and Water Resources Engineering, Institute of Technology of Cambodia, Phnom Penh, Cambodia
Abstract
The purpose of this study is to advance our current understanding of soil moisture storage in subsurface and water infiltration rate in loess soil. There-fore, a set of experiments was conducted on two soil columns filled with silty clay loam, with and without applying cavity technical method. For the soil column applied with loess cavity, the ponding infiltration was simulated us-ing HYDRUS-2D/3D, version 2.x and the simulated results were verified by those of observation. The results show that 1) the loess cavity significantly decreased the infiltration rates when the flux permeated through it (varying from 0.358 to 0.208 cm⋅min−1) as compared with no cavity soil column
(va-rying from 0.408 to 0.241 cm⋅min−1); 2) similarly, the total cumulative
infil-tration and at the termination of wetting front advancement of soil column with cavity were 66 cm and 69 cm lower than that of no cavity soil column (76 and 78 cm), respectively. Consequently, the soil moisture at the subsur-face and surrounding the loess cavity was effectively ameliorated; 3) the model was capable of predicting water infiltration processes in the soil column with loess cavity, and the root mean square error of simulated water contents, wet-ting front advancements, cumulative infiltrations, and infiltration rates were from 0.22 to 3.63 cm3⋅cm−3, 1.6 to 3.63 cm, 3.44 cm, and 0.026 cm⋅min−1,
respec-tively. Overall, the findings in this study indicate that loess cavity can effectively increase soil moisture storage at shallow surface and the HYDRUS-2D/3D model is capable of simulating and predicting scenarios to help achieve stable shallow soil surface with loess cavity.
Keywords
Loess Cavity, HYDRUS-2D/3D, Wetting Front Advancement, Infiltration Rate, Cumulative Infiltration, Water Content
How to cite this paper: Porn, L., Yan, B.W., Soun, S. and Ouk, S. (2019) Effects of Loess Cavity on Soil Moisture Movement: Revealed by Soil Column and HYDRUS Model. Journal of Water Resource and Pro-tection, 11, 371-394.
https://doi.org/10.4236/jwarp.2019.114022 Received: March 21, 2019
Accepted: April 5, 2019 Published: April 8, 2019
Copyright © 2019 by author(s) and Scientific Research Publishing Inc. This work is licensed under the Creative Commons Attribution International License (CC BY 4.0).
DOI: 10.4236/jwarp.2019.114022 372 Journal of Water Resource and Protection
1. Introduction
The north-west Loess Plateau of China lies in arid and semi-arid regions. This region is characterized with thick loess deposits ranging from about 30 to 100 m or even 200 m [1]. The loess is mainly composed of fine-grained and yellow silty sediment, deposited by wind from north-west Gobi Desert over a long period of time [2]. Therefore, loess soil is vulnerably prone to water, wind, and water-wind erosion, and over 60% of the Loess Plateau has been subjected to soil loss with about 2000 to 2500 t⋅km−2 of annual average soil loss [3]. The long agricultural
history in ancient time [4] and the recent urbanization with great demand on daily usage and agricultural irrigation have jointly caused serious land degrada-tion and water scarcity on the Loess Plateau [5]. As a result, water stress gradu-ally becomes the most limited factor for rain-fed agriculture in this region, call-ing for better irrigation management to preserve water resources by produccall-ing more food with less water [6]. In this last decade, the effectiveness of vegetation restoration efforts in the Loess Plateau have been demonstrated by most of pre-vious studies [7] [8] [9]. The water conservation efforts, involving in afforesta-tion and/or vegetaafforesta-tion restoraafforesta-tion, terracing, increasing soil surface roughness to reduce the sediment yield from the hill slopes and delivery to rivers, and land degradation gradually decreased [10] [11]. However, these conservation efforts have been questioned for their negative consequences of excessive reduction of water resources (e.g., [12] [13] [14]).
Loess cavity, was firstly introduced by Dang, Li [15] and Yan, Dang [16]. This technical method, originally known as Cavity-Making Technology, was initially applied in farmland at Yangling, Northwest A&F university for improving the soil moisture in subsurface. Based on the strong characteristics of the vertical structure of loess soil, the method of macro blasting and the drilling hole were applied to enlarge the bottom for creating a cavity with a single chamber diame-ter of about 40 cm and in the depth of 90 - 120 cm below soil surface. The upper soil of the cavity is loosened, which enhances the permeability of the upper layer, absorbs more precipitation into the soil, and reduces the runoff loss of the rain-fall. The soil at the bottom of the cavity is compacted to form a relatively sepa-rate water storage layer, which can prevent deep seepage from precipitation and prevent evaporation of lower ground water pipes from rising, so as to achieve the purpose of seepage reduction, evaporation, and water storage. However, in the present study, the cavity created by explosion was replaced by a wire half-sphere basket of 22-cm diameter buried at the depth of 30 cm below the soil surface. Loess cavity can be one of the efficient techniques to increase infiltration, reduce evaporation, and help alleviate water shortage in northwest Loess area of China.
L. Porn et al.
DOI: 10.4236/jwarp.2019.114022 373 Journal of Water Resource and Protection
very labor- and resource-costly if attempting to assess the long-term impacts of such loess cavity to local soil water utilization and recycling.
During the past several decades, there have been a large number of simulation models developed to evaluate water movement at the least cost [20]-[26]. In general, the most of the currently available modes are pressure-based with satu-rated flow equations [27] [28] [29]. Though, the pressure-base form models are more restrictive and closely related [30]. Amongst the most frequently known, the Richards’ equation, which described the hydrodynamics of soil water move-ment [31], occupies a significant role in modern theoretical. Taking the advan-tages of complex initial and boundary conditions (BCs) based on finite differ-ences or finite element methods with iterative implicit techniques, the Richards’ equation can reflect the reality circumstances and heterogeneous textured soil
[32] [33] (Rao, 2006).
HYDRUS-2D/3D version 2.x is one among the most widely used dynamics and physical model based on numerical solution of Richards’ equation to simu-late various hydrologic processes in one, two, or three dimensional variably sa-turated vadose zones using the finite element method [33] [34] [35]. Due to its adaptability in accommodating with different combinations of initial and boun-dary conditions, there are many researchers using HYDRUS-2D/3D model to investigate soil water movement in either laboratory or field experiments, or even build mathematical models [36]-[41]. Furthermore, HYDRUS-2D/3D model can also be used to trace water and solute movement and wetting fronts (WFs) in both homogenous and heterogeneous soils [42]. Overall, previous studies have proved the efficiency of HYDRUS-2D/3D model to simulate water infiltra-tion and wetting front advancement at the field scale correctly [43]. However, no study has yet applied statistic model such as HYDRUS-2D/3D model to investi-gate the efficiency of loess cavity on improving the water soil porous media in the semi-arid Loess Plateau.
Therefore, the objectives of this study are 1) to capture patterns of soil water movement in two soil columns, and examine the influences of loess cavity in si-mulated soil column on infiltration process; 2) to evaluate soil water infiltration rate, water content and wetting front advancement based on the HYDRUS 2D/3D model in consideration of the ponding infiltration conditions. The remainder of this paper is organized as follows. Section 2 details the study materials and me-thods. Section 3 presents the main results of the experiments. Section 4 is about the interpretation and discussion of the results. Finally, Section 5 concludes the paper.
2. Materials and Methods
2.1. Experimental Design
First, confirm that you have the correct template for your paper size. This tem-plate has been tailored for output on the custom paper size (21 cm × 28.5 cm).
DOI: 10.4236/jwarp.2019.114022 374 Journal of Water Resource and Protection
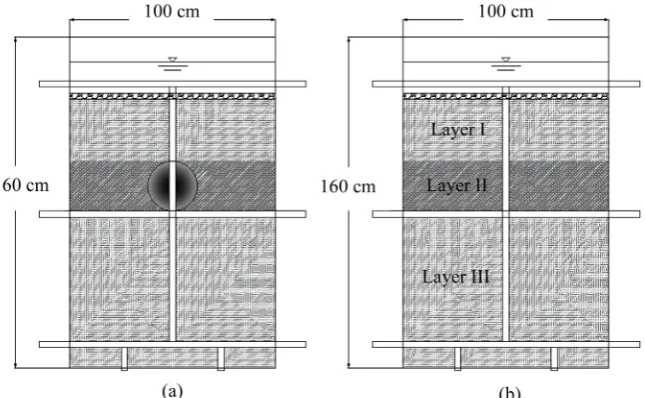
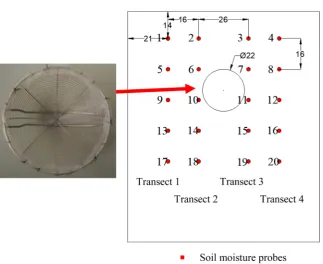
experiment was conducted using a cavity-making technique at the college of architectural hydrology and water resources engineering, Northwest A&F Uni-versity, China. Two Plexiglas semi-circle containers of a height of 150 cm and 50 cm in diameter were used as the soil columns. To be a convenience for observing the wetting front advancements, the two plate sides of containers were gridded on lines in vertical and lateral direction (1 cm for each grid space). Soil sample, taken from Yangling, Shaanxi province, was silty clay loam soil. It was sieved through the filter of 4 mm in diameter, and filled into both soil columns. These soil columns were packed with three-layered soil at the thickness of 68, 24, and 28 cm for bottom, middle, and upper layer, respectively, and the quartz layers of 3 cm in thickness were laid on the upper surface in protecting soil erosion and texture damaged by applied water (Figure 1(a) & Figure 1(b)). One of soil col-umns was chosen to bury a half-sphere basket at 30 cm below soil surface (Figure 1(a)) for creating a loess cavity. This half-sphere basket was made from wire, and had a diameter of 22 cm. The time domain reflectometry (TDR) (Model CS605, Cambell Scientific) was utilized to measure the variation of volumetric water content in each soil layer. Its 20 moisture probes were horizontally in-stalled at plate side of both containers in 5 lines (4 probes in each line) beneath soil surface at depth of 14 cm, 29 cm, 44 cm, 61 cm, and 76 cm (Figure 2).
[image:4.595.214.537.493.692.2]At the beginning of experiment, water pumping was not used but 42 L of wa-ter was simultaneously poured into both soil columns because of the considera-tion of the flash flood happening in the Loess Plateau. Preferential flows of both container side walls were barred by sealing them. Then, the variation of volume-tric water content in each soil layer was measured using TDR every one hour; and the measurement of water front advancements was done every two hours. This process terminated when the advancement wetting front of both soil col-umns gradually decreased and nearly approached the stable phase in most part
Figure 1. Scheme of the experimental setup represented: (a) Soil columns with loess
L. Porn et al.
[image:5.595.216.540.61.325.2]DOI: 10.4236/jwarp.2019.114022 375 Journal of Water Resource and Protection
Figure 2. Scheme of the experimental plot displaying the position of TDR probes at each
observation node and the vertical intersection 1, 2, 3, 4.
of the last layer. This experimental study was conducted during 840 min. During the experiment, the outside temperature was about 8˚C, consequently, the rele-vant evaporation of the current study was so small to take into account. There-fore, the effect of evaporation to the study results was neglected.
2.2. HYDRUS 2D/3D Modeling
The ponded infiltration was simulated using two-dimensional domain of HYDRUS-2D/3D software package [44]. This package is widely utilized for si-mulating 2D/3D domain of water, solutes, and heat movement in variably satu-ration porous media with a multiple option of initial and boundary conditions and heterogeneous soil [45]. The governing flow equation described by the mod-ified Richards equation in the HYDRUS 2D/3D code is applied for determining the water movement of axi-symmetrical isothermal Darcy flux in a variably sa-turated rigid isotropic porous media [46] [47]:
x h z h k
K K
t x x z z z
θ
∂ = ∂ ∂ + ∂ ∂ −∂
∂ ∂ ∂ ∂ ∂ ∂ (1)
where θ is the volumetric water content (WC) [cm3⋅cm−3], h is the soil water
pressure head [cm], K is the unsaturated hydraulic conductivity determined [cm3⋅h−1] by Equation (3), x and z are the lateral and vertical coordinate axis (z is
DOI: 10.4236/jwarp.2019.114022 376 Journal of Water Resource and Protection
The Van Genuchten [48] modeling the soil water retention is described as:
( )
(
1 1)
If 01 If 0
r nm s r e h S h h θ θ
θ θ α
− = ≤ − = + > (2)
where Se is the effective saturation [−], θs and θr are the saturated and
re-sidual water content [cm3⋅cm−3], respectively, α is empirical coefficient [cm−1]
inversely related to the air-entry value (low for silty or clay texture and high for coarse soil), and n and m are constant empirical coefficients affecting the reten-tion curve [−]. And m is determined by m= −1 1n.
The hydraulic conductivity utilized the closed form equation of Van Genuch-ten [48], using the statistical pore-size index of Mualem [49] to combine with Equation (2), is implemented in HYDRUS-2D/3D as follows:
2 1
1 1 If 0
If 0
m
l m
s e
s
K S S h
K K h ⋅ − − ≤ = > (3)
where Ks is the saturated hydraulic conductivity [cm3⋅h−1], 0≤Se≤1, and l is
the tortuosity/connectivity coefficient [−] and generally has a value of 0.5 ac-cording to the analysis of a diversity of soils [50].
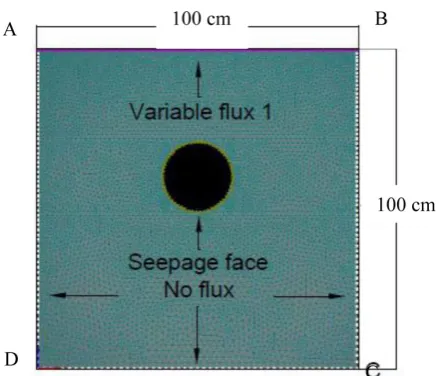
Simulations considering a 100 × 100 cm profile, where a loess cavity having a diameter equal to 22 cm was put at 29 cm below the soil surface, was defined as a 2D transport domain. Galerkin finite element methods (FEM) is utilized by HYDRUS-2D/3D to solve Richards’ equation [51]. The transport domain was discretized using and unstructured triangular FEM. The running model needs the soil hydraulic parameters, θs, θr, Ks, n, α, l and the initial soil water
content as well.
2.2.1. Spatial Discretization and Numerical Flow Domain
L. Porn et al.
[image:7.595.264.484.67.255.2]DOI: 10.4236/jwarp.2019.114022 377 Journal of Water Resource and Protection
Figure 3. Scheme of the experimental plot displaying the position of TDR probes at each
observation node and the vertical intersection 1, 2, 3, 4.
Each cross line represented the observed probe which corresponded to the measured locations of soil contents (Figure 2).
2.2.2. Defining Boundary Conditions
The distributions of initial volumetric water content (θr) was assigned according
to the results of interpolated water contents measured at every observation node probes of soil columns before starting the infiltration process. Since there was no probe measured water content at the surface and bottom of soil column with loess cavity, the measured values were extended to the top and bottom of the model domain, respectively. Figure 3 shows all details of the transport domain, in which the cavity loess are located. The soil profile was considered to be hete-rogeneous and differentiated depend on the measured soil bulk densities. The evaporation from bare soil and precipitation were neglected.
Figure 3 depicts the boundary conditions (BCs) of the transport domain with applying cavity. The upper boundary (AB) was specified as a variable flux 1 which defined by flash flood. The time variable BCs were implemented and ad-justed dynamically depending upon the water level in the surface (AB) and con-ditions in the ponding domain. The BCs of both vertical sides (AD and BC) were subjected to no flux BC, since there is no flow happened across these boundaries. The cavity was represented as a circle of 11 cm radius, located at 30 cm beneath the variable flux 1 BC, assigned a seepage face BC. In this study, the water table was not considered, then there was no effect on the flow in the interest transport domain. Consequently, the bottom of the flow domain (CD) was subjected to a no-flux boundary condition since water infiltration is not reached the bottom for this experiment.
2.2.3. Input Requirements and Validation of the Model
DOI: 10.4236/jwarp.2019.114022 378 Journal of Water Resource and Protection
physical properties. They were collected using the metallic rings and measured the dry soil bulk density. The sedimentation method (pipette and hydrometer) was used to measure soil particle size. Table 1 demonstrates the soil hydraulic parameters and the van Genuchten simulated results of three soil layers of soil columns with and without loess cavity. Rosetta pedotransfer function was im-plemented to predicted these parameters from different soil layers by utilizing the measured results of soil particle size percentage and soil bulk densities [52]. The texture of soil profile (0 - 120 cm depths) is classified as silty clay loam for all with the bulk densities varying from 1.15 to 1.29 g⋅cm−3. The values of K
s
within 120 cm soil profile ranged from 0.741 to 1.376 cm⋅h−1, with an average
bulk density of 1.043 cm⋅h−1. The predicted values of
s
θ (=0.183 - 0.345 cm3⋅cm−3),
r
θ (=0.03 cm3⋅cm−3), α (=0.0064 - 0.0065 cm−1), and n (=1.5819 - 1.5874) were
estimated by fitting the van Genuchten.
Finally, to compare the goodness of simulated results of HYDRUS-2D/3D to the measured results by sensor probes, three criteria indices, i.e., the root mean square error (RMSE) and the normalized root mean square error (NRMSE) [53]
and the Nash-Sutcliffe model efficiency coefficient (EF) [54], were used to reflect the efficiency of simulation. These indices were calculated according to Equa-tions (4)-(6):
(
)
21 RMSE
n
i i
i P O
n = −
=
∑
(4)(
)
21 O
NRMSE n
i
i P i
n = −
=
∑
(5)(
)
(
)
2 1 2 1 EF 1 n i i i n i i i O P O O = = − = − −∑
∑
(6)where Pi is the simulated value; Oi is the observed values, O is the average
of observed value, and n is the number of observations. These criteria indices were calculated on the unsorted data, the observed/predicted values were being directly compared. The RMSE should be noticeably as close as possible to zero
[55].
3. Results
3.1. Analysis of Experimental Results
3.1.1. Soil Water Movement and Changes in Soil Storage
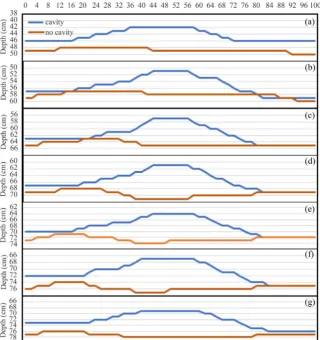
Figures 4(a)-(g) showed the comparison of the wetting front advancements of soil columns with and without loess cavity during 14 hours of infiltration process. Due to the WFs drawn every two hours for both soil columns, thus,
L. Porn et al.
[image:9.595.214.535.80.421.2]DOI: 10.4236/jwarp.2019.114022 379 Journal of Water Resource and Protection
Figure 4. Comparison of the wetting front advancements with and without applying
cav-ity in soil columns during 14 hours of infiltration process: (a) at 2 hours, (b) at 4 hours, (c) at 6 hours, (d) at 8 hours, (e) at 10 hours, (f) at 12 hours, and (g) at 14 hours.
in horizontal direction were promptly wetted and the wetted vertical direction was gradually permeated. The measurement of wetting front advancement at 2, 4, 6, 8, 10, 12, and 14 hours in soil column with cavity were 43, 50, 56, 60, 63, 65, and 66 cm, respectively, while those of soil column without cavity were 49, 58, 65, 71, 74, 75, and 76 cm, respectively (Figures 4(a)-(g)). Noticeably, the WF of soil column without cavity started to move slower when it lasted for 10 hours and slightly changed until the end of experiment (Figures 4(e)-(f)). Whereas,
DOI: 10.4236/jwarp.2019.114022 380 Journal of Water Resource and Protection 4(g)).
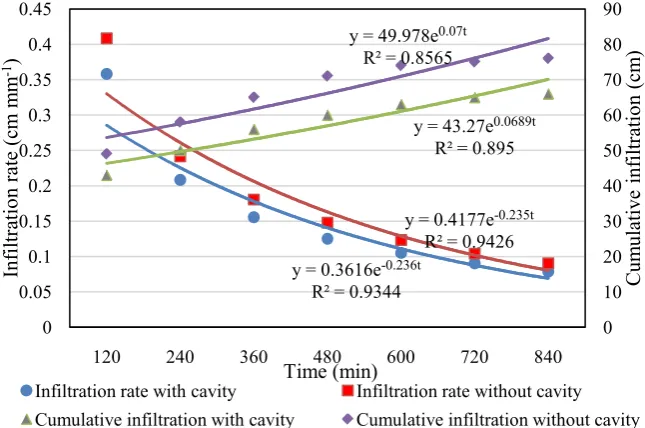
Figure 5 demonstrates the observed infiltration rates and cumulative infiltra-tions in both soil columns with and without applying cavity. Obviously the soil column with cavity showed lower infiltration rate than which of without cavity. After the WFs reached 42 and 49 cm depths of soil columns with and without loess cavity, respectively, the infiltration rates of both columns decreased promptly from the maximum value of 0.358 to 0.208 cm⋅min−1 for soil column
with cavity and 0.408 to 0.241 cm⋅min−1 for soil column without cavity after one
hour of starting the experiment and they kept decreasing gradually after experi-ment have done 8 hours. These stages kept continuous until the end. The meas-ured total cumulative infiltrations were 66 and 76 cm for soil column with and without cavity, respectively. This means more water has been held up and stored in caving layer. As the evident of Figure 9, the both cumulative infiltrations in-creased steadily through the whole infiltration process until finishing experi-ment. This can be stated as a linear function of times at the later infiltration stage.
3.1.2. Spatial and Temporal Variations of Water Content in Vertical Transects
The comparisons of water contents (WCs) with and without applying loess cav-ity in soil columns, of which the study was conducted during 14 hours shown in
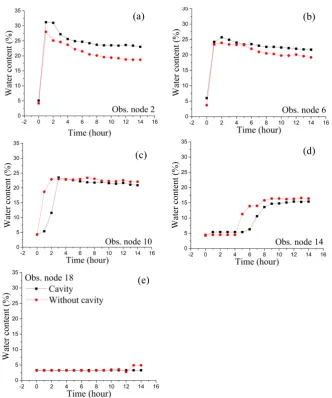
Figures 6(a)-(e) and Figures 7(a)-(e), at 14-, 30-, 46-, 62-, and 78-cm depths. The multiple curves denote the outputs at different times. Due to the installed probes in the symmetric phase, the probes in vertical 21-cm and 37-cm transects were chose for analysis section. As can be observed, the water contents of both soil columns were hastily increased in the first hour of experiment phase and
Figure 5. Comparison measured velocity (cm/h) of storm scenario during 14 h: vertical
direction velocity of applied cavity making technology, without cavity making technolo-gy.
y = 0.3616e-0.236t
R² = 0.9344
y = 0.4177e-0.235t
R² = 0.9426 y = 43.27e0.0689t
R² = 0.895 y = 49.978e0.07t
R² = 0.8565
0 10 20 30 40 50 60 70 80 90 0 0.05 0.1 0.15 0.2 0.25 0.3 0.35 0.4 0.45
120 240 360 480 600 720 840
C um ula tiv e in filtr atio n ( cm ) In filtr atio n r ate (c m m m -1) Time (min)
L. Porn et al.
[image:11.595.207.540.64.463.2]DOI: 10.4236/jwarp.2019.114022 381 Journal of Water Resource and Protection
Figure 6. Comparison of water content of observation probes in vertical transect 2 near
the cavity loess with and without applying cavity soil columns during 14 hours.
DOI: 10.4236/jwarp.2019.114022 382 Journal of Water Resource and Protection
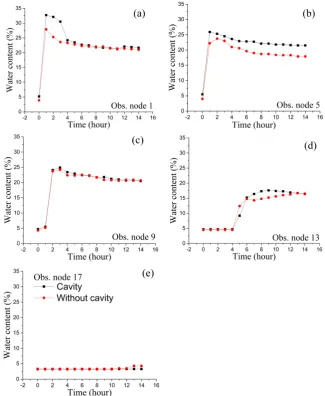
Figure 7. Comparison of water content of probes in vertical transect 1 with and without
applying cavity soil columns during 14 hours.
Figures 7(a)-(e) also shows the comparison of water contents with and with-out applying cavity soil columns but for vertical transect 1. There were no sig-nificant variations of water distributions of both soil columns. As shown in Fig-ure 7(a) & Figure 7(b), some minor differences found at observation node 1 and 5 which the WC at observation node 1 was increased rapidly reached the maximum value of 32.7% and declined to nearly the same trend as the WCs of without cavity column at 3 hours later. The WCs of the observation node 5 and 9 at 46 and 62 cm deep, respectively, had the similar values from the beginning until the end of experiment process (Figure 7(c) & Figure 7(d)). Furthermore,
Figure 7(e) also shows the last two hours of experiment, the WCs slightly in-crease for the observation node 17 of without cavity soil column, and remain constant for those of applying cavity soil column as the consequences of loess cavity.
col-L. Porn et al.
DOI: 10.4236/jwarp.2019.114022 383 Journal of Water Resource and Protection
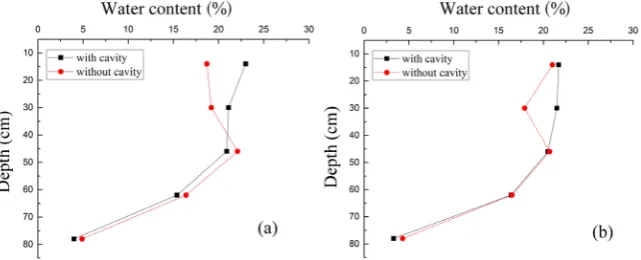
umns with and without applying cavity at 14 hours is shown in Figure 8(a) &
Figure 8(b). Figure 8(a) which represented the vertical cross section oriented at 18 cm from loess cavity showed that WCs of both soil columns at 14-cm depth were about 21%. But the WC of soil column without cavity at 30-cm depth was decreased to 17.9%, while those with cavity was gradually decreased to 21.5%. It was noticeably that the WCs distribution at the deep layer had the similar trend for both soil columns at the end of infiltration process. Other comparison of WCs of that both soil column demonstrated the water distributions of vertical 37-cm transect oriented closed to the loess cavity. It was interestingly found that the shallow depth of soil column with loess cavity had soil water much more than those without loess cavity and at the depth of 44 cm down both soil col-umns have nearly the same water content value (column 2 which is the nearest to the loess cavity). WCs’ values of subsurface soil with applying loess cavity measured at 14- and 30-cm depth were 23% and 21.1% higher than those with-out loess cavity which at the same depth had WCs’ values of 18.7% and 19.2%. However, WCs of soil column without cavity was slightly higher than those with cavity and they had the similar trend.
3.2. Comparisons of Model Simulation
The single-porosity model of van Genuchten-Mualem was chose to determined soil hydraulic parameters by using HYDRUS-2D/3D Rosite for soil water reten-tion and conductivity curves (Table 1). Noticeably, the saturated zone of ponded infiltration is not fully filled with water due to the entrapped air [56]. Figure 9
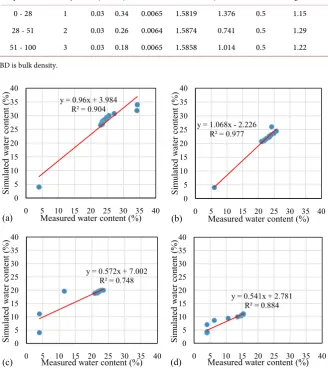
[image:13.595.215.536.564.694.2]shows the observed and simulated water contents (WCs) for different depths, obtained by HYDRUS-2D/3D, for probes in vertical transect 2 closed to the cav-ity in the function of time as well as the associated scatter plots. The comparison between measured and simulated values of WCs with the determination coeffi-cient (R2) in Figure 9 also showed that HYDRUS-2D/3D simulated WCs matched the corresponding observed results reasonably well for shallow surface layer which indicated a similar trend during the water infiltration process (i.e., in the depth of 30 cm). It can be found that the HYDRUS model has described the WCs adequately for the upper and middle layer which had a good determination
Figure 8. Comparison of water content at vertical transect 1 and 2 of soil columns with
DOI: 10.4236/jwarp.2019.114022 384 Journal of Water Resource and Protection
Table 1. Soil hydraulic parameters determined by the van Genuchten of HYDRUS rosite.
Depth (cm) Soil layer θr θs α (cm−1) n Ks (cm⋅h−1) l BD (g⋅cm−3)a
0 - 28 1 0.03 0.34 0.0065 1.5819 1.376 0.5 1.15 28 - 51 2 0.03 0.26 0.0064 1.5874 0.741 0.5 1.29 51 - 100 3 0.03 0.18 0.0065 1.5858 1.014 0.5 1.22
aBD is bulk density.
Figure 9. Comparison of simulated water content by HYDRUS-2D/3D with observed
re-sult during 14 hours.
coefficients (R2) of 0.90, 0.977, and 0.88. Except for the deep layer of experi-mental process, the model slightly underestimated volumetric water content. In this period, the correlation coefficient was 0.74 for the probes 13 and 14 at depth 62cm in the deep layer. Furthermore, the determination coefficients variably ranged from 0.88 to 0.97 across different probe positions, representing the good predictive capability of the HYDRUS-2D/3D at the shallow layer.
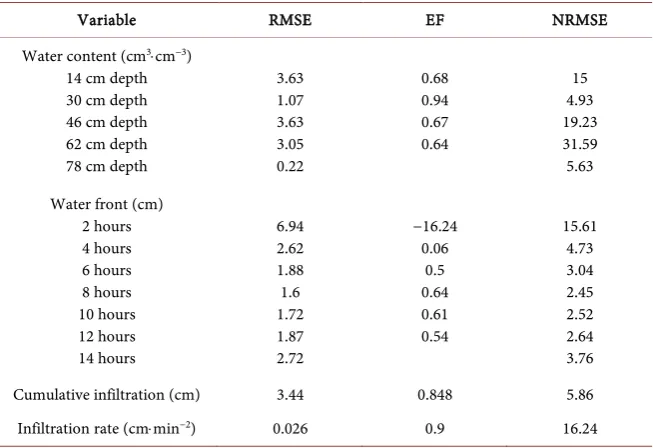
As shown by the criteria indices for the efficiency of the model performance, the comparison between measured and simulated results were expressed in terms of RMSE, EF, and NRMSE, demonstrated in Table 2. The RMSE values describing the differences between measured and simulated WCs were 3.63 for 14 cm depth, 1.07 for 30 cm depth, 3.63 for 46 cm depth, 3.05 for 62 cm depth, and 0.22 for 78 cm depth. Despite an overestimation in 62 cm depth (NRMSE = 31.59%), the EF values, ranging from 0.64 - 0.94, where a value of 1 would mean the model perfectly simulated the data, indicated that the simulated WCs had a
y = 0.96x + 3.984 R² = 0.904
0 5 10 15 20 25 30 35 40
0 5 10 15 20 25 30 35 40
Sim ula te d w ate r c on te nt (% )
Measured water content (%) (a)
y = 1.068x - 2.226 R² = 0.977
0 5 10 15 20 25 30 35 40
0 5 10 15 20 25 30 35 40
Sim ula te d w ate r c on te nt (% )
Measured water content (%) (b)
y = 0.572x + 7.002 R² = 0.748
0 5 10 15 20 25 30 35 40
0 5 10 15 20 25 30 35 40
Sim ula te d w ate r c on te nt (% )
Measured water content (%) (c)
y = 0.541x + 2.781 R² = 0.884
0 5 10 15 20 25 30 35 40
0 5 10 15 20 25 30 35 40
Sim ula te d w ate r c on te nt (% )
[image:14.595.209.538.102.475.2]L. Porn et al.
[image:15.595.212.539.113.337.2]DOI: 10.4236/jwarp.2019.114022 385 Journal of Water Resource and Protection
Table 2. Statistical analysis of HYDRUS model performance comparing to the measured
results. RMSE, EF, and NRMSE are the root water squared and model efficiency coeffi-cient, respectively.
Variable RMSE EF NRMSE Water content (cm3⋅cm−3)
14 cm depth 30 cm depth 46 cm depth 62 cm depth 78 cm depth
3.63 1.07 3.63 3.05 0.22 0.68 0.94 0.67 0.64 15 4.93 19.23 31.59 5.63 Water front (cm)
2 hours 4 hours 6 hours 8 hours 10 hours 12 hours 14 hours 6.94 2.62 1.88 1.6 1.72 1.87 2.72 −16.24 0.06 0.5 0.64 0.61 0.54 15.61 4.73 3.04 2.45 2.52 2.64 3.76 Cumulative infiltration (cm) 3.44 0.848 5.86 Infiltration rate (cm⋅min−2) 0.026 0.9 16.24
good agreement with the measured values for all WCs depths during the expe-rimental process.
Figure 10(a) indicates the comparison of measured infiltration rate with those simulated by HYDRUS-2D/3D. This model simulation was capable of capturing the temporal trend of water fronts for all soil depths. The variations of water fronts were mainly to different soil bulk density as well as the percolation. The simulation results of HYDRUS model with van Genuchten-Mualem shows a best agreement with measured results which had the coefficient of determination (R2) about 0.98. The model performance of HYDRUS-2D/3D was quantified by the root mean square error (RMSE), the efficiency coefficient (EF), and the normalized root square error (NRMSE) and their values were listed in Table 2. As the evident in Table 2, the criteria indices were 0.026 for RMSE, 16.24 for NRMSE, and 0.9 for EF. Figure 10(b) demonstrates the comparison of simu-lated and measured cumulative infiltration. It was found that the simusimu-lated re-sults by HYDRUS-2D/3D are larger than the measured rere-sults at 120 min and then their trends gradually came closer until the termination of infiltration process. As an inspection of Figure 10(b), in general, the simulated cumulative infiltration was in good agreement with the measured results, especially, at the deep surface. The criteria indices were 3.44 for RMSE, 5.86 for NRMSE, and 0.848 for EF (Table 2). These means that the HYDRUS-2D/3D-simulated infil-tration rate and cumulative infilinfil-tration agreed well with the measured values.
DOI: 10.4236/jwarp.2019.114022 386 Journal of Water Resource and Protection
Figure 10. Comparison between HYDRUS-2D/3D and observed results: (a) infiltration
rate, and (b) cumulative infiltration.
Figure 11. Comparison of simulated and measured wetting front of the soil column with
loess cavity at every two hours.
the termination of infiltration experiment, the measured and simulated advanc-ing wettadvanc-ing depth approached the similar values of 69 and 69.66 cm, respective-ly. As seen in Table 2, the values of RMSE, EF, and NRMSE of simulated WF at 2 hours were 6.94, −16.24, and 15.61, respectively, which mean that the model simulation was overestimated the WF at the commencement of the infiltration process. Whereas, the simulated water fronts after 2 hours of infiltration process were capable to measured results. The RMSE values ranged from 2.62 to 1.6, while the NRMSE ranged from 3.76% to 4.73%, and EF values ranged from 0.06 to 0.64. However, in general, the simulated and measured WFs are fitting well together.
The HYDRUS-2D/3D model was used to investigate the water distribution in soil column with loess cavity for comparing to the experimental results. Figure 12 shows the spatial distributions of water contents in every two hours. As the evident of Table 2, the root mean square errors (RMSE) correspond to 6.94, 2.62, 1.88, 1.6, 1.72, 1.87, and 2.72 between the simulated and measured water
y = 1.250x - 0.032 R² = 0.988
0 0.1 0.2 0.3 0.4
0 0.1 0.2 0.3 0.4
Sim
ula
te
d in
filtr
atio
n r
ate
(c
m.
mi
n
-1)
(a) 0
20 40 60 80
0 120 240 360 480 600 720 840
C
um
ula
tiv
e
in
filtr
atio
n (
cm
)
Time (min)
Measured cumulative infiltration
Simulated cumulative infiltration
[image:16.595.233.518.268.455.2]L. Porn et al.
[image:17.595.209.537.66.328.2]DOI: 10.4236/jwarp.2019.114022 387 Journal of Water Resource and Protection
Figure 12. Simulated 2D spatial distribution of water content in every two hours.
front at 2, 4, 6, 8, 10, 12, and 14 hours, respectively. Those indicate the simula-tion seems to underestimate the water front at subsurface.
4. Discussion
4.1. The Efficiency of Loess Cavity on Mitigating Soil Water
Movement
Soil water distribution is an important key factor for hydrologic cycle in subsur-face root water uptake. Especially, in Chinese Loess Plateau where is challenging a serious problems of soil erosion for many years long. The current study of wa-ter distribution in loess soil column with applying cavity loess by comparing the loess cavity efficiency to improve soil moisture in sublayer soil to the soil column without loess cavity shows that the WCs in subsurface of soil column with cavity was noticeably higher than those without cavity in Figure 4(a) & Figure 4(b). As observed in Figure 4(c) & Figure 4(e), WCs in soil column with cavity at deeper layer (i.e. 46-, 62-, and 78-cm depth) were more less than those without cavity when the water movement permeated through the loess cavity. As the consequences of loess cavity, the water infiltrative rate in soil column with cavity was also gradually reduced after the water infiltrated through the loess cavity in
DOI: 10.4236/jwarp.2019.114022 388 Journal of Water Resource and Protection
water was moving across. Within these, the soil moisture in subsurface of soil column with cavity was ameliorated.
4.2. HYDRUS 2D/3D Performance in Applying Loess Cavity on Soil
Column
To be better make economic benefits and save time of doing experiment, the HYDRUS model was applied in this current study. HYDRUS-2D/3D was uti-lized for comparing the experimental results to its simulations. A three-layer soil domain with different soil hydraulic parameters was defined in the model. The agreement between measured and simulated WCs in soil column with loess cav-ity scenario was quantitatively evaluated using the RMSE, EF, and NRMSE crite-ria indices (Table 2). As shown in Figure 9(c) & Figure 9(d), the WCs at deep layer seems to be slightly underestimated by the HYDRUS model. These discre-pancies can be somewhat explained by the representation of the heterogeneous soil in the HYDRUS model. While soil hydraulic parameters and soil texture typically vary gradually in the soil profile [57]. In general, the measured results were known to be effected by the heterogeneity [58]. On account of the statistical coefficients (RMSE = 0.5 - 1.9 for first two layers, and RMSE = 0.6 - 2 for the bottom layer), despite a slight overestimation, the simulated results agreed well with the measured values for the first 2 layers and fairly agreed for the deep layer. This agreed with the previous study of the spatial and temporal prediction of soil moisture dynamic which found that the HYDRUS model is more capable of simulating the rapid variation of the surface soil moisture dynamics than the slower deeper-profile variations [59]. However, the mean EF for the WCs com-parison was 0.73, which indicates that the efficiency of the model simulation was good [60].
In our current study, it can be found that the simulation of water fronts from four hours of commencement of infiltration process was better modelled than the two hours’ water front (Figure 11). It is very interesting to note that the HYDRUS-2D/3D model slightly overestimates the depth of advancing wetting front (Figure 11). As shown in Figure 9, the simulated water storage at the first two hours of was more less than those of measured values. Based on the law of conservation of mass, under the equivalent condition of the cumulative infiltra-tion, the larger water holding capacity that the soil layer has, the smaller ad-vancing depth that the WF can permeate [61]. Consequently, the depth of ad-vancing wetting front simulated by HYDRUS-2D/3D moved faster at first two hours.
ex-L. Porn et al.
DOI: 10.4236/jwarp.2019.114022 389 Journal of Water Resource and Protection
perimental design, since two-dimensional simulations are insufficient to solve such condition because they suppose constant conditions in the third dimension. The soil column with cavity as distinct three-dimensional individuals demand three-dimensional apparent illustration.
5. Conclusions
The paper aims to advance our current understandings of soil moisture storage in subsurface and water infiltration rate in loess soil. A conducted infiltration experiment in two three-layered soil columns presents the efficiency of cavity technique on ameliorating the soil moisture at the shallow surface and to inves-tigate the validity of the proposed model. The experimental data show that the loess cavity had affected on soil water dynamic by decreasing the infiltration rate when the flux was going across the loess cavity. In addition, it also affected the WFs since it made the water permeated into the soil surface steadily that made to improve the soil moisture at the shallow soil layer. The fitting of experimental data indicated that the measured infiltration rate, water content, and waterfront were all well described by power-law functions of the infiltration time.
The model results showed that the simulated infiltration rate, water content, and water fronts were in good agreement with corresponding measured values, indicating that the model represented good accurately with experimental results. However, a few discrepancies were found in the model’s performance, and we identified two potential causes that contributed to these discrepancies. First, the boundary condition of loess cavity defined as seepage condition is somewhat made much water infiltrated into it and likely made HYDRUS-2D/3D underes-timate this condition. Second, the neglecting of preferential flow may be ex-pected when assuming constant soil hydraulic parameters through the simula-tion process while dynamic changes in hydraulic properties may have occurred as a result of wetting and drying cycles. Third, 2D domain of HYDRUS model seems to be not every well fitted with the real infiltration domain, since the cavi-ty using in the infiltration experiment was a half-sphere basket and HYDRUS model defined the loess cavity as an empty circle.
DOI: 10.4236/jwarp.2019.114022 390 Journal of Water Resource and Protection
is strongly recommended for the future research.
Acknowledgements
The authors are deeply grateful to Dr. Xianwen Li, College of Water Resources and Architectural Engineering and Dr. Hu Yaxian, Institute of Soil and Water Conservation, Northwest A&F University, Shaanxi, Yangling, for their kind help and enthusiasm in guiding this r study from conception to its completion. The author would like to thank the China Scholarship Council (CSC) for the finan-cial support. The authors are also grateful to Mr. Saleh Shahriar, College of Economics and Management, Northwest A&F university, for his assistance and comments on an earlier draft of the paper.
Funding
This research was funded by the National Natural Science Foundation of China [grant numbers 51179160].
Conflicts of Interest
The authors declare no conflict of interest.
References
[1] Fu, B. (1989) Soil Erosion and Its Control in the Loess Plateau of China.Soil Use and Management, 5, 76-82.https://doi.org/10.1111/j.1475-2743.1989.tb00765.x [2] Cai, Q.G. (2001) Soil Erosion and Management on the Loess Plateau.Journal of
Geographical Sciences, 11, 53-70.https://doi.org/10.1007/BF02837376
[3] Hui, S. and Shao, M. (2000) Soil and Water Loss from the Loess Plateau in China. Journal of Arid Environments, 45, 9-20.https://doi.org/10.1006/jare.1999.0618 [4] Ritsema, C.J. (2003) Introduction: Soil Erosion and Participatory Land Use
Plan-ning on the Loess Plateau in China.Catena, 54, 1-5.
https://doi.org/10.1016/S0341-8162(03)00052-3
[5] Zhang, Q., et al. (2009) Effects of Land Use on Soil Quality on the Loess Plateau in Northwest Shanxi Province. In: Computer and Computing Technologies in Agri-culture II, Volume 1, Springer US, Boston.
[6] Yi, L. and Shao, M. (2007) Experimental Study on Influence Factors of Rainfall and Infiltration under Artificial Grassland Coverage.Transactions of the Chinese Socie-ty of Agricultural Engineering, 23, 18-23.
[7] He, B., et al. (2015) Dynamic Response of Satellite-Derived Vegetation Growth to Climate Change in the Three North Shelter Forest Region in China. Remote Sens-ing, 7, 9998-10016.https://doi.org/10.3390/rs70809998
[8] Qu, B., et al. (2015) Spatio-Temporal Changes in Vegetation Activity and Its Driv-ing Factors DurDriv-ing the GrowDriv-ing Season in China from 1982 to 2011. Remote Sens-ing, 7, 13729-13752.https://doi.org/10.3390/rs71013729
[9] Yao, Z., et al. (2016) Multiple Afforestation Programs Accelerate the Greenness in the “Three North” Region of China from 1982 to 2013. Ecological Indicators, 61, 404-412.https://doi.org/10.1016/j.ecolind.2015.09.041
L. Porn et al.
DOI: 10.4236/jwarp.2019.114022 391 Journal of Water Resource and Protection
Cover Changes in the Loess Plateau of China: A Case Study on the Beiluo River Ba-sin. Catena, 136, 118-127.https://doi.org/10.1016/j.catena.2015.02.022
[11] Yan, R., et al. (2016) Topographical Distribution Characteristics of Vegetation Res-toration in the Beiluo River Basin from 1995 to 2014. Journal of Northeastern Uni-versity Nature Science, 37, 1598-1603.
[12] Cao, S., et al. (2016) Ecosystem Water Imbalances Created during Ecological Resto-ration by Afforestation in China, and Lessons for Other Developing Countries.
Journal of Environmental Management, 183, 843-849.
https://doi.org/10.1016/j.jenvman.2016.07.096
[13] Lei, D., et al. (2016) Severe Depletion of Soil Moisture Following Land-Use Changes for Ecological Restoration: Evidence from Northern China. Forest Ecology Man-agement, 366, 1-10.https://doi.org/10.1016/j.foreco.2016.01.026
[14] Jia, X., et al. (2017) Soil Moisture Decline Due to Afforestation across the Loess Pla-teau, China. Journal of Hydrology, 546, 113-122.
https://doi.org/10.1016/j.jhydrol.2017.01.011
[15] Dang, J.Q., et al. (2001) Improving Soil Moisture-Holding Capacity Using Cavi-ty-Making by Explosion in the Loess Plateau. Transactions of the Chinese Society of Agricultural Engineering, 17, 161-164.
[16] Yan, B.W., Dang, J.Q. and Zhang, R.H. (2005) Research on the Restrain Effective on Soil-Water Evaporation of the Technology of Cavity-Making by Explode in Farm-land. Water Saving Irrigation, 6, 8-10.
[17] Dang, J.Q., et al. (2002) Application of Cavity-Making by Explosion in Ar-id-Agriculture. Journal of Hydraulic Engineering, 33, 103-106.
[18] Dang, J.Q., et al. (2002) Experiment on Technique of Cavity Making by Explosion in Agriculture. Journal of Northwest Sci-Tech University of Agriculture, 30, 174-176. [19] Dang, J.Q., et al. (2002) Application of Cavity-Making by Explosion in
Ar-id-Agriculture. Journal of Hydraulic Engineering, 10, 103-106.
[20] Van Dam, J.C., et al. (1997) Theory of Swap Version 2.0; Simulation of Water Flow, Solute Transport and Plant Growth in the Soil-Water-Atmosphere-Plant Environ-ment. DLO Win and Staring Centre, Wageningen, 287-295.
[21] Douglasmankin, K.R., Srinivasan, R. and Arnold, J.G. (2010) Soil and Water As-sessment Tool (Swat) Model: Current Developments and Applications. American Society of Agricultural and Biological Engineers, 53, 1423-1431.
[22] Fernández, J.E., et al. (2002) Simulating the Fate of Water in a Soil-Crop System of a Semi-Arid Mediterranean Area with the Wave 2.1 and the Euro-Access-Ii Models.
Agricultural Water Management, 56, 113-129.
https://doi.org/10.1016/S0378-3774(02)00009-4
[23] Ghosh, R.K. and Maity, S.P. (1976) Influence of Antecedent Moisture on Infiltration of Water into Soils (in Situ). Soil Science Society of America Journal, 122, 124-125.
https://doi.org/10.1097/00010694-197608000-00009
[24] Liu, X., et al. (2005) Scs Model Based on Geographic Information and Its Applica-tion to Simulate Rainfall-Runoff RelaApplica-tionship at Typical Small Watershed Level in Loess Plateau. Transactions of the Chinese Society of Agricultural Engineering, 21, 93-97.
DOI: 10.4236/jwarp.2019.114022 392 Journal of Water Resource and Protection and Muddy Water Infiltration. Soil Science Society of America Journal, 164, 445-453.
https://doi.org/10.1097/00010694-199907000-00001
[27] Cooley, R.L. (1983) Some New Procedures for Numerical Solution of Variably Sa-turated Flow Problems. Water Resources Research, 19, 1271-1285.
https://doi.org/10.1029/WR019i005p01271
[28] Huyakorn, P.S., et al. (1986) A Three-Dimensional Finite-Element Model for Simu-lating Water Flow in Variably Saturated Porous Media. Water Resources Research, 22, 1790-1808.https://doi.org/10.1029/WR022i013p01790
[29] Neuman, S.P. (1973) Saturated-Unsaturated Seepage by Finite Elements. Journal of the Hydraulics Division, 99, 2233-2250.
[30] Kumar, S., Sharma, P.K. and Hari Prasad, K.S. (2014) Modeling of Unsaturated Flow Using Hydrus Software. Race-2014, Paper ID: 1434.
[31] Richards, A.L. (1931) Capillary Conduction of Liquids in Porous Mediums. Physics, 1, 318-333.https://doi.org/10.1063/1.1745010
[32] Arampatzis, G., et al. (2001) Estimation of Unsaturated Flow in Layered Soils with the Finite Control Volume Method. Irrigation & Drainage, 50, 349-358.
https://doi.org/10.1002/ird.31
[33] Simunek, J., Genuchten, M.T.V. and Šejna, M. (2005) The Hydrus-1d Software Package for Simulating the Movement of Water, Heat, and Multiple Solutes in Va-riably Saturated Media, Version 3.0.
[34] Karandish, F. and Šimůnek, J. (2016) A Comparison of Numerical and Ma-chine-Learning Modeling of Soil Water Content with Limited Input Data. Journal of Hydrology, 543, 892-909.https://doi.org/10.1016/j.jhydrol.2016.11.007
[35] Tafteh, A. and Sepaskhah, A.R. (2012) Application of Hydrus-1d Model for Simu-lating Water and Nitrate Leaching from Continuous and Alternate Furrow Irrigated Rapeseed and Maize Fields. Agricultural Water Management, 113, 19-29.
https://doi.org/10.1016/j.agwat.2012.06.011
[36] Karandish, F. and Darzi-Naftchali, A. (2017) Application of Hydrus (2d/3d) for Predicting the Influence of Subsurface Drainage on Soil Water Dynamics in a Rainfed-Canola Cropping System. Irrigation and Drainage, 67, 29-39.
[37] Li, X., et al. (2015) Modeling Soil Water Dynamics in a Drip-Irrigated Intercrop-ping Field under Plastic Mulch. Irrigation Science, 33, 289-302.
https://doi.org/10.1007/s00271-015-0466-4
[38] Mashayekhi, P., et al. (2016) Different Scenarios for Inverse Estimation of Soil Hy-draulic Parameters from Double-Ring Infiltrometer Data Using Hydrus-2d/3d. In-ternational Agrophysics, 30, 203-210.https://doi.org/10.1515/intag-2015-0087 [39] Sasidharan, S., et al. (2018) Evaluating Drywells for Stormwater Management and
Enhanced Aquifer Recharge. Advances in Water Resources, 116, 167-177.
https://doi.org/10.1016/j.advwatres.2018.04.003
[40] Simunek, J., et al. (2017) Vadose Zone Fate and Transport Simulation of Chemicals Associated with Coal Seam Gas Extraction. AGU Fall Meeting.
[41] Weiss, T., Dahan, O. and Turkeltub, T. (2015) Numerical Model of Water Flow and Solute Accumulation in Vertisols Using Hydrus 2d/3d Code. EGU General Assem-bly Conference.
[42] El-Nesr, M.N., Alazba, A.A. and Šimůnek, J. (2014) Hydrus Simulations of the Ef-fects of Dual-Drip Subsurface Irrigation and a Physical Barrier on Water Movement and Solute Transport in Soils. Irrigation Science, 32, 111-125.
L. Porn et al.
DOI: 10.4236/jwarp.2019.114022 393 Journal of Water Resource and Protection
[43] Wang, C., Mao, X. and Hatano, R. (2014) Modeling Ponded Infiltration in Fine Textured Soils with Coarse Interlayer. Soil Science Society of America Journal, 78, 745-753.https://doi.org/10.2136/sssaj2013.12.0535
[44] Šimůnek, J., Genuchten, M.T.V. and Šejna, M. (2016) Recent Developments and Applications of the Hydrus Computer Software Packages. Vadose Zone Journal, 6. [45] Simunek, J. (2008) Development and Applications of the Hydrus and Stanmod
Software Packages, and Related Codes. Vadose Zone Journal, 72, 587-600.
https://doi.org/10.2136/vzj2007.0077
[46] Šim, J., van Genuchten, M.T. and Šejna, M. (1999) The Hydrus-2d Software Package for Simulating the Two-Dimensional Movement of Water, Heat, and Multiple So-lutes in Variably-Saturated Media: Version 2.0. Colorado School of Mines.
[47] Šimůnek, J., Van Genuchten, M.T. and Šejna, M. (2006) The Hydrus Software Package for Simulating Two- and Three-Dimensional Movement of Water, Heat, and Multiple Solutes in Variably-Saturated Media. Technical Manual, Version, 1, 241.
[48] Van Genuchten, M.T. (1980) A Closed-Form Equation for Predicting the Hydraulic Conductivity of Unsaturated Soils 1. Soil Science Society of America Journal, 44, 892-898.https://doi.org/10.2136/sssaj1980.03615995004400050002x
[49] Mualem, Y. (1976) A New Model for Predicting the Hydraulic Conductivity of Un-saturated Porous Media. Water Resources Research, 12, 513-522.
https://doi.org/10.1029/WR012i003p00513
[50] Neuman, S.P. (1976) Wetting Front Pressure Head in the Infiltration Model of Green and Ampt. Water Resources Research, 12, 564-566.
https://doi.org/10.1029/WR012i003p00564
[51] Ebrahimian, H., et al. (2012) Comparison of One- and Two-Dimensional Models to Simulate Alternate and Conventional Furrow Fertigation. Journal of Irrigation & Drainage Engineering, 138, 929-938.
https://doi.org/10.1061/(ASCE)IR.1943-4774.0000482
[52] Schaap, M.G., Leij, F.J. and Genuchten, M.T.V. (2001) Rosetta: A Computer Pro-gram for Estimating Soil Hydraulic Parameters with Hierarchical Pedotransfer Functions. Journal of Hydrology, 251, 163-176.
https://doi.org/10.1016/S0022-1694(01)00466-8
[53] Weik, M.H. (2001) Root-Mean-Square Deviation, in Computer Science and Com-munications Dictionary. Springer US, Boston, 1501.
https://doi.org/10.1007/1-4020-0613-6
[54] Nash, J.E. (1970) River Flow Forecasting through Conceptual Models. Part 1-a Dis-cussion of Principles. Journal of Hydrology, 10, 282-290.
https://doi.org/10.1016/0022-1694(70)90255-6
[55] Bannayan, M. and Hoogenboom, G. (2009) Using Pattern Recognition for Estimat-ing Cultivar Coefficients of a Crop Simulation Model. Field Crops Research, 111, 290-302.https://doi.org/10.1016/j.fcr.2009.01.007
[56] Hammecker, C., et al. (2010) Experimental and Numerical Study of Water Flow in Soil under Irrigation in Northern Senegal: Evidence of Air Entrapment. European Journal of Soil Science, 54, 491-503.
https://doi.org/10.1046/j.1365-2389.2003.00482.x
[57] Tan, X., et al. (2015) Field Analysis of Water and Nitrogen Fate in Lowland Paddy Fields under Different Water Managements Using Hydrus-1d. Agricultural Water Management, 150, 67-80.https://doi.org/10.1016/j.agwat.2014.12.005
DOI: 10.4236/jwarp.2019.114022 394 Journal of Water Resource and Protection on Solute Breakthrough Sampled with Suction Cups. Vadose Zone Journal, 5, 886-
893.https://doi.org/10.2136/vzj2005.0105
[59] Chen, M., Willgoose, G.R. and Saco, P.M. (2014) Spatial Prediction of Temporal Soil Moisture Dynamics Using Hydrus-1d. Hydrological Processes, 28, 171-185.
https://doi.org/10.1002/hyp.9518
[60] Krause, P., Boyle, D. and Bäse, F. (2005) Comparison of Different Efficiency Criteria for Hydrologic Models. Advances in Geosciences, 5, 89-97.
https://doi.org/10.5194/adgeo-5-89-2005