Using Technology, Organization and Environment
Framework to find out the Technology Adoption
Determinants among SACCOs in Nairobi County, Kenya
Glad M. Nkonge
School of Computing and Informatics, University of Nairobi, Kenya
Andrew M. Kahonge
School of Computing and Informatics, University of Nairobi, Kenya
ABSTRACT
Electronic banking is replacing traditional banking due to technological innovations. In Kenya, SACCOs have not adopted technology at a high rate as compared to commercial banks, leading to a technological lag. The study aimed to establish how technology, organization and environment affect technology adoption in SACCOs.
The study was a descriptive survey, conducting a census in all the 39 SACCOs of Nairobi County. Data collection was through questionnaires and analyzed using descriptive and inferential statistics. Findings, presented in tables and charts, were that technology enables customers transact business with ease, reduces operation costs, leads to growth of organizations’ revenue and market share, and organization’s size influences technology. Top management does not fully support technological innovation decision making. SACCOs do not allocate resource slack on technological acquisitions. There are no effective laws to fight cybercrime. Tech-savvy SACCOs are more favorable to customers.
The study recommends that SACCOs commit themselves to adopting technology to improve their business activities, increase revenue and market share. Top management should fully support technology adoption processes, and implement them according to the organization’s strategy. SACCOs should allocate slack resources to technology acquisitions. The government should come up with effective laws to battle cybercrime.
General Terms
SACCOs, AdoptionKeywords
SACCOs, Technology, Adoption, ICT
1.
INTRODUCTION
The banking sector has been open to historic transformation. Technology adoption is moving forward in a speedy way in all areas of financial markets and intermediation, for instance, electronic finance, electronic money, electronic banking, electronic brokering, electronic insurance, electronic exchanges, and electronic supervision. Uptake of electronic banking began to happen in depth as a channel of distribution for financial services because of major changes in technology and intensive competitive banking markets [1]. Electronic banking is increasingly replacing traditional banking or branch banking.
The Communication Authority of Kenya quoted the number of internet subscriptions at 25.6 million, and the number of mobile subscriptions at 38.5 million in the country [2]. Despite there being a change in the field and an upward surge in the number of internet subscribers, e-commerce and technology adoption has not increased in the same capacity. In
the Information Economy report, UNCTAD stated that lack of confidentiality of data results, the decline of the confidence of users over the use of online platforms leads to reluctance on the usage of online facilities [3]. Mostly, the fear of the customer is that their information can be used without their authorization and at times, the changing of the data. Customers need of touch and feel and the presence of a physical shop or office is a contributor to the decision of using e-commerce and other technological platforms too [3]. Despite these challenges, there has been an upward trend of adoption of technology, considering that some banks have closed some of their branches, to serve their customers on the electronic platform.
According to the SACCO Supervision Annual Report 2015, Deposit taking SACCOs are by the nature of their financial business cross-county, both in terms of physical operations and infrastructural inter-linkages [4]. These infrastructural inter-linkages are reflected through the ATM operations, mobile money services, branch connectivity through wide area networks (WANs), among others. The report further addressed that for future purposes, convenience and faster ways of accessing financial services will be a key item for any successful retaining of customers in the banking sector, and Deposit-taking SACCOs are not exempted from this [4]. Deposit-taking SACCOs should thus focus on increasing the adoption of ICT in offering financial services especially through the internet, SACCO agencies and mobile technology, and break away from the traditional branch banking [4]. Increased uptake of computerized financial services processes is expected to bring a big change in digitally-enabled financial technologies and establish new value chains for deposit taking SACCOs, including holding on to payment services. Income and profits are projected to shift towards deposit-taking SACCOs that manage to get and use ICT platforms in helping their members to access the main services, as this will influence in a positive way, on their operating efficiency and capacity [4].
Various issues contribute to the adoption of new technology services [5]. These factors could be technological, social, or economic. Some of the social factors include conceptualizing electronic money, the social context of transactions, awareness, attitude towards change (embracing new technology), trust in one’s bank or service provider, convenience of the service and the comfort that people have in using these services. Some of the technological factors include handset operability, service availability and reliability, security and privacy concerns, ease of use, network coverage, and availability of the service on different mobile networks [6].
2.
PREVIOUS EFFORTS IN
EFFECTS
Electronic banking is replacing traditional banking worldwide [1]. Banks have the highest consumption of mobile banking services in Kenya at 30%, followed by SACCOs at 16.7% [7]. A majority of the SACCOs in Kenya, at 51.7%, do not utilize either e-banking, internet, m-banking, link/VISA cards, or CCTV [8].
Banks that use Internet banking have a higher profit than non-users of the service [9]. Small banks that concentrated on online banking services costed less than those that did not use the service. Mobile banking has positively influenced the financial performance of commercial banks in India [10]. A company’s market penetration, product development, size, profitability, innovation and technology affect growth of the banking industry in Kenya [11]. There usually is a major impact of environmental pressure on the embracing of various e-commerce technologies [12]. Technology adoption has a positive relationship with competitiveness and adoption of technology improves an organization’s competitiveness [13].
3.
METHODOLOGY
The study used a descriptive research design. It was a positivist research, which adopted a survey. The target population was all the 39 deposit-taking SACCOs in Nairobi County. According to the SACCO Supervision Annual Report, Nairobi County has 39 licensed deposit-taking SACCOs, whose licenses have not been suspended. The study conducted a census on the respondents, who were the IT manager, the Finance manager, an accountant, and an I.T personnel from each of the SACCOs in Nairobi County. Thus, the unit of analysis was the 156 people from the 39 SACCOs that make up the target population, or their equivalent. The research instruments for this study were semi-structured questionnaires. Data analysis was carried out using both descriptive and inferential statistics. Descriptive statistics were analyzed using frequencies, percentages, the mean-measures of central tendency, and Standard deviation. Inferential statistics were also analyzed to generate correlation and regression results. The multiple linear regression model is as shown below:
Y = α + β 1X1+ β 2X2+ β 3X3+ e, Where Y is the dependent variable (Technology Innovation Decision Making), α is the Regression constant, β1, β2 and β3 are the coefficients of the independent variables, X1 is Technology, X2 is Organization, X3 is Environment, and e is Error term. All the statistical tests were conducted at 5% level of significance (95% confidence level). The significance of relationships was tested at 5% level of significance.
3.1
Research framework
[image:2.595.317.542.74.337.2]The study adopted the TOE Framework, which looks at three contexts of an institution that affect the method by which technological innovations are adopted and implemented. These contexts are technological, organizational and environmental. Thus, the independent variables are Technology, Organization and Environment. The dependent variable is technological innovation decision-making. The three contexts bring about both barriers and chances for technological novelty and implementation. Therefore, the three contexts affect how an institution sees the need for, searches for, and embraces new technology [14].
Figure 1. The Research framework
4.
RESULTS AND DISCUSSION
Before testing for correlation of the study variables, it was important to know the level of their reliability. The measurement reliability was conducted using Cronbach's alpha coefficient and for an alpha of between 0.70 and 0.95, the instrument was interpreted as reliable [15]. The internal consistency of the variables is acceptable since it was more than 0.7. The alpha level also shows that the variables of the study were correlated. The results in the table below show the variables in the study had Cronbach’s alpha value above 0.7 implying that the instruments were sufficiently reliable for measurement.
Table 1. Reliability Statistics using Cronbach’ Alpha
Cronbach's Alpha
Cronbach's Alpha Based on
Standardized Items N of Items
.78 .75 4
4.1
Response rate
One hundred and fifty six (156) questionnaires were issued to the 39 SACCOs that formed the sample size. Out of these, one hundred and thirty seven (137) questionnaires were returned. These represented 88% response rate. A response rate of 50% is adequate for a study [16]. The areas below were evaluated to give answers to the research objectives and requirements:
4.2
Technology adoption by SACCOs
It was confirmed that 57% of the respondents agreed that adoption of technology enables customers to transact business with ease. 42.2% of the respondents were neutral, and 7% of respondents strongly agreed. Hence, it was concluded that customers transact business with ease if there is technology adoption. The highest percentage of the respondents also agreed that adoption of technology reduces operational costs. They made up 55.6% of the total participants. Those who were neutral, strongly agreed, disagreed, and strongly disagreed, were 23.7%, 11.9%, 6.7%, and 2.2% respectively.External Task Environment
Technology support infrastructure
Industry characteristics and market structure
Government regulation
Organization
Resource slack
Size
Formal and informal linking structures
Technology
Availability
Characteristics Technology adoption
Efficiency
Revenue growth
[image:2.595.314.543.494.564.2]According to the respondents, most of their organizations were aware of technological implantations since 32.6% agreed and 19.7% strongly agreed to the question.
Table 2. Technology adoption enables customers transact business with ease
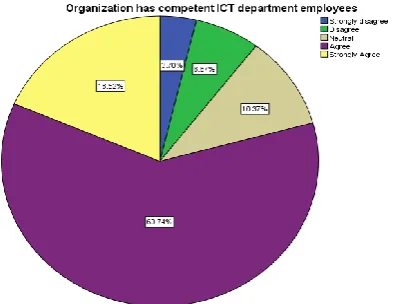
[image:3.595.51.271.139.300.2]63.7% of the respondents agreed while 36.3% disagreed that their organizations were familiar with opportunities and threats that come with technologic adoption. This implies that, if the organizations were to adopt technology, or have adapted technology, they are aware of the benefits and the risks that would come along with it. 60.7% of the respondents agreed that their organizations have competent ICT department employees. 18.5% of them strongly agreed on the same. However, 10.4%, 6.7%, and 3.7% were neutral, disagreed, and strongly disagreed on competency respectively.
Figure 2. Competent ICT department employees
The information from the respondents also indicated that most of the organizations had reliable internet access. The highest percentage of the respondents were neutral on the fact that their organizations possess ICT infrastructure and IT human resources. They made up 42.2% of the participants. 37% of the respondents also disagreed on the same. This implies that there is a risk of technological failure during the implementation process in most SACCOs. After the analysis, it was clear that the current technologies that SACCOs adopted have brought growth in terms of revenue. 63.7% agreed while 21.5% strongly agreed on the same. The table below shows that 56.3% of the respondents agreed that technology adoption has led to increase in their organization’s market share. However, the second percentage of the respondents who were 28.9% were neutral on the same. 6.7%
disagreed, 5.8% strongly agreed, and 2.2% strongly disagreed on the same.
Table 3. Technology has brought about increase in market share
Frequen cy Percent
Valid Percent
Cumulativ e Percent
Valid Strongly
disagree 3 2.2 2.2 2.2
Disagree 9 6.6 6.7 8.9
Neutral 39 28.5 28.9 37.8
Agree 76 55.5 56.3 94.1
Strongly
Agree 8 5.8 5.9 100.0
Total 135 98.5 100.0 Missing
System 2 1.5
Total 137 100.0
[image:3.595.312.560.424.654.2]Based on the information, organizations experience increases in market share when they integrate technology in their operations. The table below shows that technology adoption as lead to efficiency when it comes to conducting internal business processes. 69.6% agreed while 17.8% strongly agreed.
Table 4 Technology has brought efficiency in conducting internal business processes
Frequen cy
Percen t
Valid Percent
Cumulativ e Percent
Valid Strongly
disagree 3 2.2 2.2 2.2
Disagree 4 2.9 3.0 5.2
Neutral 10 7.3 7.4 12.6
Agree 94 68.6 69.6 82.2
Strongly
Agree 24 17.5 17.8 100.0
Total 135 98.5 100.0
Missing System 2 1.5
Total 137 100.0
4.3
Organizational factors affecting
technology adoption
56.3% of respondents were neutral on the fact that their organization was committed to adopting technology to improve business. Those who agreed, disagreed, and strongly disagreed were 28.1%, 14.8% and 0.7% respectively. Frequency Percent
Valid Percent
Cumulativ e Percent
Valid Neutral 57 41.6 42.2 42.2
Agree 77 56.2 57.0 99.3
Strongly
Agree 1 .7 .7 100.0
Total 135 98.5 100.0 Missing
System 2 1.5
[image:3.595.61.258.430.582.2]Table 5. Organization is committed to adopting technology to improve business activities
Frequen cy Percent
Valid Percent
Cumulativ e Percent
Valid Strongly
disagree 1 .7 .7 .7
Disagree 20 14.6 14.8 15.6
Neutral 76 55.5 56.3 71.9
Agree 38 27.7 28.1 100.0
Total 135 98.5 100.0 Missin
g
System
2 1.5
Total 137 100.0
This indicates that many SACCOs are not committed to adopting technology to improve their businesses. This means that technology adoption is not at the forefront of the activities that the SACCOs are planning to implement. The highest percent of the respondents at 37.8% were neutral on the fact that their organization’s top management fully supports technology adoption. Conversely, 34.8% of the respondents agreed on the same. Therefore, this shows that most organization’s top management are not fully committed towards supporting IT adoption. Without the support of the top management, it is not favorable to adopt technology, as most of the technology adoption decisions are made by them.
Figure 3. Top management fully supports technology adoption
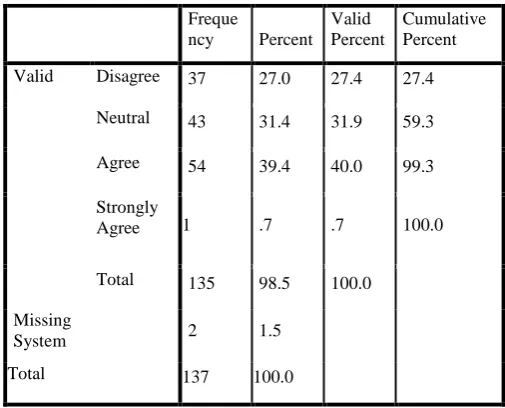
[image:4.595.52.272.98.281.2]40% of the respondents agreed that technology adoption in their organizations is strategy led. Those who strongly agreed were less than 1%. On the other hand, those who were neutral as well as disagreed were 31.9% and 27.4% respectively. This implies that technology adoption in SACCOs is not in line with their strategic plan, and that the organizations adopt technology when favors a certain opportunity of the moment.
Table 6. Technology adoption is strategy-led
Freque
ncy Percent Valid Percent
Cumulative Percent
Valid Disagree 37 27.0 27.4 27.4
Neutral 43 31.4 31.9 59.3
Agree 54 39.4 40.0 99.3
Strongly
Agree 1 .7 .7 100.0
Total 135 98.5 100.0
Missing
System 2 1.5
Total 137 100.0
45.2% of the respondents agreed that their organization’s top management is aware of the benefits that can be realized from technology adoption. Those who strongly agreed were 7.4%. On the other hand, those who were neutral, disagreed, and strongly disagreed on the same were 25.9%, 19.3% and 2.2% respectively. According to the results of the analysis, 56.3% of the respondents agreed that the size of the firm influences adoption of technology. 12.6% also strongly agreed. However, 11.1%, 13.3% and 6.7% were neutral, disagreed, and strongly disagreed on the same.
Table 7. Organization’s size influences Technology Adoption
Freque ncy
Perce nt
Valid Percent
Cumulati ve Percent
Valid Strongly
disagree 9 6.6 6.7 6.7
Disagree 18 13.1 13.3 20.0
Neutral 15 10.9 11.1 31.1
Agree 76 55.5 56.3 87.4
Strongly
Agree 17 12.4 12.6 100.0
Total 135 98.5 100.0 Missi
ng
System
2 1.5
Total 137 100.0
[image:4.595.57.242.414.572.2] [image:4.595.315.542.434.657.2]11.1%, and 2.2% respectively. This implies that the linking structures of an organization, including factors such as the organizational structure and the bureaucracy in the organization influence the process of technology adoption. 47.4% of the respondents agreed that their organization has competent IT staff that drive the process of technology adoption. 18.5% strongly agreed on the same too. On the other hand, 19.3% of respondents were neutral. Hence, it can be concluded that SACCOs have competent IT staff that drive the process of technology adoption but this has not been fully leveraged.
4.4
Environmental factors affecting
technology adoption
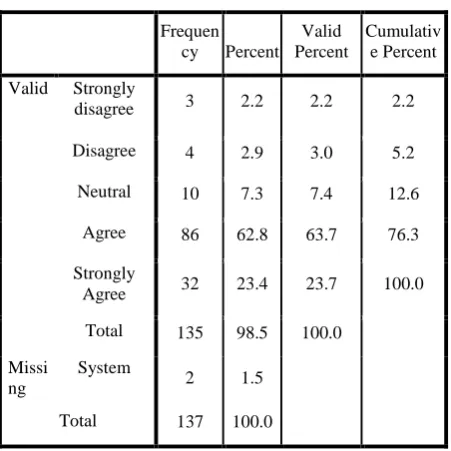
[image:5.595.332.514.78.212.2] [image:5.595.52.278.322.548.2]63.7% of the respondents agreed that the government demonstrates a major commitment to promote adoption of technology. 23.7% also strongly agreed on the same. 12.6% 5.2%, and 2.2% of the respondents were neutral, disagreed and strongly disagreed on the fact that government demonstrates a major commitment to promote adoption of technology respectively.
Table 8. Government shows commitment to Technology Adoption
Frequen cy Percent
Valid Percent
Cumulativ e Percent
Valid Strongly
disagree 3 2.2 2.2 2.2
Disagree 4 2.9 3.0 5.2
Neutral 10 7.3 7.4 12.6
Agree 86 62.8 63.7 76.3
Strongly
Agree 32 23.4 23.7 100.0
Total 135 98.5 100.0
Missi ng
System
2 1.5
Total 137 100.0
[image:5.595.312.529.458.667.2]The highest percentage of the respondents disagreed that there are effective laws to battle cyber-crime. They were 48.1% of the total respondents. 24.4% of the respondents were neutral on the same. 14.8% of the respondents also strongly disagreed that there are effective laws to battle cyber-crime. 10.4% agreed and 2.2% percentage strongly agreed on the fact. This implies that organizations find it difficult to tackle cybercrime as the current regulations and laws do not have enough support to the act.
Figure 4: Effective laws to battle cyber-crime
61.5% of the respondents agreed that the current legal environment is conducive for technology adoption. 17% of them also strongly agreed on the same. Therefore, it can be concluded that the legal environment is conducive for technology adoption.
51.1% of the respondents agreed that government regulations have influenced technology adoption process. 25.9% of them also strongly agreed on the same. This implies that the government provides regulation through regulatory authorities, which influence technology adoption in SACCOs. This is through various requirements and standards that are set by the regulatory authorities. The highest percentage of respondents agreed and strongly agreed that their competitors in the market have adopted technology and cause a perfect competition. Those who agreed and those who strongly agreed were 58.5% and 25.9% respectively. However, some were neutral and disagreed on the fact. The two made up 15.6% of the respondents.
Table 9. Competitors have adopted technology to cause perfect competition
Frequen cy Percent
Valid Percent
Cumulativ e Percent
Vali d
Disagree 7 5.1 5.2 5.2
Neutral 14 10.2 10.4 15.6
Agree 79 57.7 58.5 74.1
Strongly
Agree 35 25.5 25.9 100.0
Total 135 98.5 100.0
Miss ing
System
2 1.5
Total 137 100.0
[image:5.595.312.528.460.667.2]who agreed were 63.7% while those who strongly agreed were 12.6%. This suggests that most SACCOs have adopted technology to be at par with their competitors. According to the table below, 54.1% agreed, 43.7% strongly agreed, and 2.2% of the respondents were neutral on the fact that their competitors have adopted technology that is perceived favorable by customers. This implies that the perception of the technology being favorable has led to there being an increase in market share in such organizations.
Table 10. Clients perceive competitors who have adopted technology favorable
Freque ncy
Perce nt
Valid Percent
Cumulati ve Percent
Valid Neutral 3 2.2 2.2 2.2
Agree 73 53.3 54.1 56.3
Strongly
Agree 59 43.1 43.7 100.0
Total 135 98.5 100.0
Missi ng
System
2 1.5
Total 137 100.0
52.6% agreed, 7.4% strongly agreed, 20.7% were neutral, 5.9% strongly disagreed, and 13.3% of the respondents disagreed on the fact that there is powerful rivalry within organizations in the industry that is very great. The highest percentage agreed and strongly agreed. This implies that due to the rivalry, organizations should strive to give the best services in the market through technology adoption, to differentiate themselves from their competitors in the industry.
51% of the respondents agreed, 20% were neutral, 18% disagreed, 10% strongly agreed, and 8% strongly disagreed that telecommunication infrastructure is reliable and efficient to support technology adoption. This implies that there is the availability of reliable telecommunication infrastructure for SACCOs to use in their process of technology adoption. 53.3% of the respondents agreed, 23.0% strongly agreed, 14.8% were neutral, 3.0% strongly disagreed, and 5.9% of the respondents disagreed on the fact that there is efficient and affordable technology support infrastructure from the local IT industry to enable technology adoption. The highest percentage agreed and strongly agreed to the same. This implies that Technology Support Infrastructure such as the Fiber Optic cabling is available, efficient and affordable for SACCOs in their quest for technology adoption.
4.5
Correlation analysis
The study findings indicated that Technology and Environment are positively correlated with Technology adoption decision making, as indicated by positive correlation values of 1.00 and 0.150 respectively. However, there is a negative correlation of Organization with Technology adoption decision making, as indicated by negative correlation value of -0.079. A positive correlation shows that when one variable increases in value, the other variable also increases, and vice versa. A negative correlation shows that when one variable increases, the other variable decreases, and vice
[image:6.595.316.540.527.693.2]versa.
Table 11. Correlations
Control Variables
Techno logy
Organiz ation
Enviro nment
Technology adoption decision making
Technol ogy
Correlation 1.000 -.079 .150
Significance
(2-tailed) . .367 .084
df 0 132 132
Organiz ation
Correlation -.079 1.000 .006
Significance
(2-tailed) .367 . .943
df 132 0 132
Environ ment
Correlation .150 .006 1.000
Significance
(2-tailed) .084 .943 .
df 132 132 0
4.6
Regression analysis
Table 12. Overall regression model summary
Model R R Square
Adjusted R Square
Std. Error of the Estimate
1 .391a .103 -.213 .627
a. Predictors: (Constant), Environment, Organization, Technology
The table above shows the R figure as 0.391, which shows the joint association between the predictor variables and the dependent variable as positive. The result of R2 is displayed as 0.103. This shows that the strength of the relationship between the model and the response variable is not strong, as data is not closely fitted to the regression line. However, important conclusions can be drawn about how changes in the predictor values are related with changes in the response value.
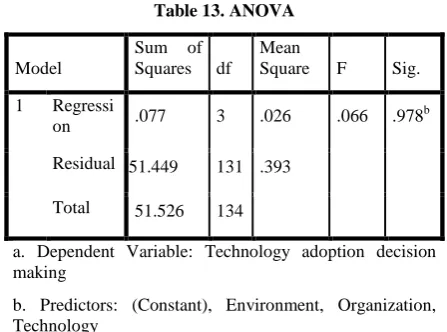
Table 13. ANOVA
Model
Sum of Squares df
Mean
Square F Sig.
1 Regressi
on .077 3 .026 .066 .978
b
Residual 51.449 131 .393
Total 51.526 134
a. Dependent Variable: Technology adoption decision making
b. Predictors: (Constant), Environment, Organization, Technology
Environment was not statistically significant in explaining Technology adoption decision making in SACCOs.
Table 14. Coefficients table
Model
Unstandardized Coefficients
Standar dized Coeffici ents
t Sig. B
Std.
Error Beta
1 (Consta
nt) 3.606 1.054 3.421 .001
Technol
ogy .004 .019 .020 .229 .819
Organiz
ation .006 .020 .027 .311 .756
Environ
ment .004 .019 .018 .201 .841
a. Dependent Variable: Technology adoption decision making
The regression model is as below:
Y = 3.606 + 0.004 X1 + 0.006 X2 + 0.004 X3
Where Y is the Technology Adoption Decision Making, X1 is Technology, X2 is Organization, and X3 is Environment. The results in the table above shows that there is a positive relationship between Technology, Organization and Environment, and Technology adoption decision making, as supported by beta coefficients of 0.004, 0.006, and 0.004 respectively. This means that an increase in either of the variables will positively influence Technology adoption decision making. The analysis also brings out results that indicate that all variables used in the study are statistically insignificant as the probability (p) values were 0.819, 0.756 and 0.841 respectively. These values are more than the conventional value of 0.05. This shows that there is no sufficient evidence in the chosen sample of respondents to conclude that a non-zero correlation exists.
5.
CONCLUSION
The project revealed out that incorporation of technology in an organization enables customers to transact business with ease, and had reduces the operational cost for SACCOs, as it is efficient in conducting internal business processes. This coincides with the findings that the banks that used Internet banking had a higher profit than non-users of the service and that the website quality, perceived privacy, customer trust, perceived ease of use and security had major effects on internet banking uptake [9]. Technology also leads to growth of SACCOs in terms of market share and revenue. This coincides with a study, which concluded that mobile banking has affected positively the financial performance of commercial banks in India [10]. Most SACCOs have competent ICT department employees who spearhead technology adoption processes. However, most SACCOs did not possess the ICT infrastructure and manpower, in terms of human resources, to perform a major technological upgrade. The study revealed that the size of an organization, in terms of the number of employees, influences the adoption of technology. Most SACCOs have competent IT staff that drive
the technology adoption process. The top management of most SACCOs are also aware of the benefits of adopting technology, but most of them do not fully support the technology adoption processes. Most SACCOs are not committed to adopting technology to improve their business activities. While making technological decisions, most of the SACCOs do not have the technological implementations being strategy-led. SACCOs do not keep aside, or use resource slack in acquisition of technological resources. Formal and informal linking structures have influence on technology adoption in most organizations. This coincides with a study that showed that a company’s market penetration, product development, size, profitability, innovation and technology affect growth of the banking industry in Kenya [11].
The study also revealed that the government demonstrates a major commitment in promoting technology adoption. The government also provides a conducive legal environment for technology adoption. However, there are no effective laws to battle cyber-crime, which remains to be a major thorn amongst SACCOs. Most of the SACCOs’ competitors have adopted technology, which has led to a perfect competition amongst them. This has brought about powerful rivalry within the SACCOs in the industry. Most of the organization’s competitors that have adopted technology, and are considered favorable by customers, leading to the loss of market share and revenue. The perceived success of competitors has influenced many SACCOs to adopt technology so as not to lose their market share to the competitors. This coincides with a study conducted that found out that there was a major impact of environmental pressure on the embracing of various e-commerce technologies [12]. Another study found out that technology adoption has a positive relationship with competitiveness and adoption of technology improves an organization’s competitiveness [13]. Another study also concluded that information technologies also function as a catalyst for the entry of new players into the market place [17]. There is efficient and affordable technology support infrastructure such as the fibre optic from the local IT industry, which enables technology adoption. The telecommunication infrastructure is reliable and efficient to support the process of technology adoption.
5.1
Further work
The application of TOE framework to find out technology adoption determinants in SACCOs in Kenyan counties other than Nairobi.
Other variables that can be used in conjunction with TOE to study the effect of technology adoption among SACCOs, as the three independent variables in this study contribute 10.3% of Technology innovation decision making.
6.
ACKNOWLEDGMENT
The authors wish to thank SACCOs that availed the data used and incorporated in the research.
7.
REFERENCES
[1] Salehi, M., & Alipour, M. (2010). E-banking in emerging economy: empirical evidence of Iran. International Journal of Economics and Finance, 2(1), 201.
[2] Communications Authority of Kenya, (2016). Retrieved from http://www.ca.go.ke/index.php/statistics. [Accessed: 22nd March 2017]
Unlocking the potential of E-Commerce for Developing Countries. United Nation Publication, New York and Geneva. Sales No.E.15.11.D.1
[4] Sacco societies Regulatory Authority (2015) Retrieved from: http://www.sasra.go.ke/index.php/resources/sacco- supervision-reports/category/11-sacco-supervision-reports?download=96:supervision-report-2015 [Accessed: 17th February 2017]
[5] Wunderlich, P., Grobler, A., Zimmermann, N. and Vennix, J. M. (2014). Managerial influence onthe diffusion of innovations within intra-organizational networks. System Dynamics Review (Wiley), 30(3), pp. 161-185.
[6] Gouws, T., and Oudtshoorn, G. P. (2011). Correlation between brand longevity and the diffusionof innovations theory. Journal of Public Affairs (14723891), 11(4), pp. 236-242.
[7] Okiro, K., & Ndungu, J. (2013). The impact of mobile and internet banking on performance of financial institutions in Kenya. European Scientific Journal, ESJ, 9(13).
[8] Momanyi, M. P., Osoro K., Nyagol, M., & Odoyo, F., (2016) Influence Of Information Technology In Enhancement of Sustainable Competitive Advantage Of Saccos In Kisii County IOSR Journal Of Humanities And Social Science (IOSR-JHSS) Volume 21, Issue 3, Ver. I PP 103-117
[9] Alwan, H. A., & Al-Zubi, A. I. (2016). Determinants of Internet Banking Adoption among Customers of Commercial Banks: An Empirical Study in the Jordanian Banking Sector. International Journal of Business and Management, 11(3), 95.
[10] Sharma, M. A., Joseph, J., & Kumar, D. S. (2017). The Impact of Mobile Banking on Financial Performance of Banks in India.
[11] Akotch, W. F., & Munyoki, J. M. (2016). Determinants of growth in the banking industry in Kenya. African Journal of Marketing Management, 8(1), 1-11.
[12] Kurnia, S., Choudrie, J., Mahbubur, R. M., & Alzougool, B. (2015). E-commerce technology adoption: A Malaysian grocery SME retail sector study. Journal of Business Research, 68(9), 1906-1918.
[13] Njogu, N. (2015). Factors Influencing the Adoption of Technology and Innovation as a Strategic Competitive Tool in a Kenyan Shoe Retail Firm (Doctoral dissertation, United States International University-Africa).
[14] Tornatzky, L. G., Fleischer, M., & Chakrabarti, A. K. (1990). Processes of technological innovation. Lexington Books.
[15] Bland, J. M., & Altman, D. G. (1997). Statistics notes: Cronbach's alpha. Bmj, 314(7080), 572.
[16] Mugenda, O. M., &Mugenda, A.G. (2003). Research Methods: Quantitative and Qualitative Approaches (2nd ed.). Nairobi: Acts.