“Preparedness, Response and Recovery”
By
Ekeu-wei Iguniwari Thomas (M.Sc., B.Eng.)
This thesis is submitted in partial fulfilment of the requirement for the award of the degree of
Doctor of Philosophy
ii
“Preparedness, Response and Recovery”
By
Ekeu-wei Iguniwari Thomas (M.Sc., B.Eng.)
This thesis is submitted in partial fulfilment of the requirement for the award of the degree of
Doctor of Philosophy
Lancaster Environment Centre, Faculty of Science and Technology Lancaster University, United Kingdom
September 2017
Supervised by:
iii
To the Almighty God and
To the Memory of Nom Habu
iv
“Data can help you make a good design great, but it will never make a bad design good”
v
I declare that, except where explicit reference is made to the contribution of others, that this thesis is the result of my work and has not been submitted for any other degree at the Lancaster University or any other institution.
Signature
vi
Floods are one of the most devastating disasters known to man, caused by both natural and anthropogenic factors. The trend of flood events is continuously rising, increasing the exposure of the vulnerable populace in both developed and especially developing regions. Floods occur unexpectedly in some circumstances with little or no warning, and in other cases, aggravate rapidly, thereby leaving little time to plan, respond and recover. As such, hydrological data is needed before, during and after the flooding to ensure effective and integrated flood management. Though hydrological data collection in developed countries has been somewhat well established over long periods, the situation is different in the developing world. Developing regions are plagued with challenges that include inadequate ground monitoring networks attributed to deteriorating infrastructure, organizational deficiencies, lack of technical capacity, location inaccessibility and the huge financial implication of data collection at local and transboundary scales. These limitations, therefore, result in flawed flood management decisions and aggravate exposure of the most vulnerable people.
Nigeria, the case study for this thesis, experienced unprecedented flooding in 2012 that led to the displacement of 3,871,53 persons, destruction of infrastructure, disruption of socio-economic activities valued at 16.9 billion US Dollars (1.4% GDP) and sadly the loss of 363 lives. This flood event revealed the weakness in the nation’s flood management system, which has been linked to poor data availability. This flood event motivated this study, which aims to assess these data gaps and explore alternative data sources and approaches, with the hope of improving flood management and decision making upon recurrence. This study adopts an integrated approach that applies open-access geospatial technology to curb data and financial limitations that hinder effective flood management in developing regions, to enhance disaster preparedness, response and recovery where resources are limited.
vii
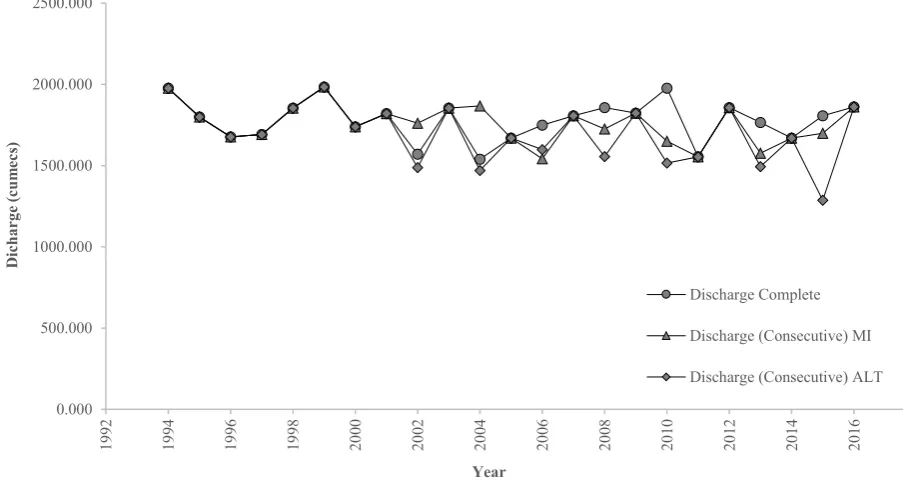
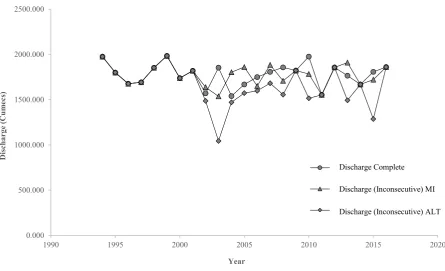
were similar for consecutive gaps (1-3 years) in the time series, while wide (inconsecutive) gaps (> 3 years) caused by gauging station discontinuity and damage benefited the most from the RA infilling approach. The 2012 flood event was also quantified as a 1-in-100year flood, suggesting that if flood management measures had been implemented based on this information, the impact of that event would have been considerably mitigated.
Other than gaps within hydrological time series, in other cases hydrological data could be totally unavailable or limited in duration to enable satisfactory estimation of flood magnitudes and return periods, due to finance and logistical limitations in several developing and remote regions. In such cases, Regional Flood Frequency Analysis (RFFA) is recommended, to collate and leverage data from gauging stations in proximity to the area of interest. In this study, RFFA was implemented using the open-access International Centre for Integrated Water Resources Management–Regional Analysis of Frequency Tool (ICI-RAFT), which enables the inclusion of climate variability effect into flood frequency estimation at locations where the assumption of hydrological stationarity is not viable. The Madden-Julian Oscillation was identified as the dominant flood influencing climate mechanism, with its effect increasing with return period. Similar to other studies, climate variability inclusive regional flood estimates were less than those derived from direct techniques at various locations, and higher in others. Also, the maximum historical flood experienced in the region was less than the 1-in-100-year flood event recommended for flood management.
viii
flooding in the delta. Furthermore, the 2012 flood was within the confine of a 1-in-100-year flood for the sub-domain with maximum data availability, suggesting that in retrospect the 2012 flood event could have been managed effectively if flood management plans were implemented based on a 1-in-100-year flood.
During flooding, fast-paced response is required. However, logistical challenges can hinder access to remote areas to collect the necessary data needed to inform real-time decisions. Thus, this adopts an integrated approach that combines crowd-sourcing and MODIS flood maps for near-real-time monitoring during the peak flood season of 2015. The results highlighted the merits and demerits of both approaches, and demonstrate the need for an integrated approach that leverages the strength of both methods to enhance flood capture at macro and micro scales. Crowd-sourcing also provided an option for demographic and risk perception data collection, which was evaluated against a government risk perception map and revealed the weaknesses in the government flood models caused by sparse/coarse data application and model uncertainty.
The C4.5 decision tree algorithm was applied to integrate multiple open-access geospatial data to improve SAR image flood detection efficiency and the outputs were further applied in flood model validation. This approach resulted in F-Statistic improvement from 0.187 to 0.365 and reduced the CAESAR-LISFLOOD model overall bias from 3.432 to 0.699. Coarse data resolution, vegetation density, obsolete/non-existent river bathymetry, wetlands, ponds, uncontrolled dredging and illegal sand mining, were identified as the factors that contribute to flood model and map uncertainties in the delta region, hence the low accuracy depicted, despite the improvements that were achieved.
x
Dedication ... iii
Declaration ... v
ABSTRACT ... vi
Acknowledgement ... xxv
CHAPTER 1: INTRODUCTION TO RESEARCH, AIM AND OBJECTIVES DEFINITION ... 1
1. Background ... 1
1.1. Flood Hazard and Impact ... 1
1.2. Aim ... 6
1.3. Objectives ... 6
1.4. THESIS STRUCTURE ... 7
CHAPTER 2: APPLICATIONS OF OPEN-ACCESS REMOTELY SENSED DATA IN FLOOD MAPPING FOR DATA SPARSE REGIONS: A REVIEW AND CASE STUDY OF NIGERIA ... 11
Abstract ... 11
1. Introduction ... 11
1.1. Flood modelling and mapping ... 11
2. Data limitations, Prediction of Ungauged Basins (PUB) and Remote sensing advancement ... 13
3.1. Radar Altimetry Water Level and Elevation ... 14
3.1.1. Altimetry discharge estimation ... 17
3.1.2. Altimetry Digital Elevation Model (DEM) accuracy assessment ... 19
3.1.3. Altimetry Bathymetry definition ... 20
3.1.4. Altimetry hydrodynamic model calibration and validation ... 21
3.2. Open-access Digital Elevation Model (DEM), Modifications and applications in flood modelling ... 23
3.3. Open-access Optical and Radar Satellite Images application in Flood Modelling and Mapping ... 27
4. Open-access remote sensing application for flood monitoring and management in Nigeria ... 30
4.1. Data limitations for hydro-meteorological studies in Nigeria ... 31
4.2. Remote sensing application for flood management in Nigeria ... 33
xi
5.2. Open-access remote sensing application in Transboundary flood management,
Nigeria ... 42
6. Consortium of satellites for flood emergency management ... 45
6.1. International charter “space and major disasters” (ICSMD) ... 45
6.2. Disaster Charter activations in Nigeria ... 46
6.3. International Water Management Institute (IWMI) Emergency response products for water disasters ... 47
6.4. IWMI Emergency response application, Nigeria ... 48
6.5. Copernicus Emergency Management Service ... 48
6.6. Copernicus Emergency Management Service (EMS) application, Nigeria region ... 49
6.7. Digital Globe Open Data Program ... 49
7. Conclusion ... 49
7.1. Future research direction for improved flood modelling and mapping in Nigeria ... 51
7.2 Summary of thesis methodologies for analytical chapters 3 - 7 ... 54
CHAPTER 3: INFILLING MISSING DATA IN HYDROLOGY: SOLUTIONS USING SATELLITE RADAR ALTIMETRY AND MULTIPLE IMPUTATION FOR DATASPARSE REGIONS... 59
Abstract ... 59
1. Introduction ... 60
2. Study region ... 64
3. Materials and Methods ... 66
3.1. In-situ hydrological data ... 66
3.2. Radar altimetry data collection and application for missing filling data gaps . 68 3.3. Missing Data Imputation, Pre-processing and Flood frequency analysis ... 70
3.3.1. Missing Data Imputation ... 70
3.3.1.1. Radar Altimetry Missing Data Imputation ... 70
3.3.1.2. Missing Data Multiple imputation ... 73
3.3.2. Pre-processing ... 74
3.3.2.1. Preliminary Analysis Prior to Flood Frequency Estimation... 74
3.3.2.2. Simple Rating Curve extrapolation uncertainty assessment ... 75
xii
4.2. Preliminary data analysis ... 83
4.3. Rating Ratio: rating curve extrapolation uncertainty ... 86
4.4. Flood frequency estimation, uncertainties and application ... 89
4.5. 2012 and 2015 floods return period estimations... 94
4.6. Assessment of missing data infilling method effect on flood quantile estimates ... 95
4.6.1. Assessment of Radar Altimetry and Multiple Imputation infilling, Niger and Benue rivers, Nigeria ... 95
4.6.2. Assessment of Radar Altimetry and Multiple Imputation infilling at Taoussa, Mali ... 96
5. Conclusion ... 98
Chapter 3 Supplementary Figures and Tables ... 100
CHAPTER 4: ACCOUNTING FOR CLIMATE VARIABILITY IN REGIONAL FLOOD FREQUENCY ESTIMATES FOR WESTERN NIGERIA ... 105
Abstract ... 105
1. Introduction ... 105
2. Study Area and Data Sources ... 108
3. Methodology ... 110
3.1. Data Preparation and Preliminary analysis ... 110
3.2. Climate indices - climate variability effect ... 111
3.3. L-moment - Index Flood Regional Flood Frequency Analysis (RFFA) ... 112
4. Results and Discussion ... 114
4.1. Data characteristics and preliminary analysis ... 114
4.2. Identification of homogeneous regions and determination of discordancy measure ... 116
4.3. Regional Distribution and Goodness of Fit Measures ... 118
4.4. Regional flood frequency and parameter estimation: ... 120
4.5. Climate Indices and flood relationship ... 121
4.6. Climate Variability effect and flood quantile estimation ... 122
5. Conclusions ... 125
xiii
1.1. Crowdsourcing and Volunteered Geographic Information (VGIS) ... 129
1.2. About Risk Perception and Indicators ... 131
1.3. Study Objectives ... 133
2. STUDY AREA ... 133
3. METHODOLOGY ... 134
3.1. Research framework for crowdsourcing ... 134
3.2. Data and Analysis ... 135
4. RESULTS AND DISCUSSION ... 138
4.1. NRT-MODIS Flood River Niger and Benue flood extents of 2012 and 2015138 4.2. NRT-MODIS and Crowd-sourcing VGIS Integration ... 140
4.3. Flood Risk Indicator Analysis ... 143
4.3.1. Flood Risk Awareness ... 145
4.3.1.1. Flood Cause ... 145
4.3.1.2. Distance from River ... 145
4.3.1.3. Flood Management and Stakeholder Responsibility Mapping ... 146
4.3.2. Flood Hazard Worry ... 148
4.3.2.1. Flood Risk Perception and Worry element ... 148
4.3.3. Flood Management Preparedness... 148
4.3.3.1. Flood Management Preparedness and Risk Perception ... 148
4.4. Government and Citizens Flood Perception Analysis in Nigeria ... 149
5. CONCLUSION ... 150
CHAPTER 6: HYDRODYNAMIC MODELLING OF EXTREME FLOODS IN DEVELOPING REGIONS USING MULTIPLE OPEN-ACCESS REMOTE SENSING AND 3RD PARTY DATA SOURCES. ... 156
Abstract ... 156
1. Introduction ... 157
1.1. Study area ... 159
2. Methodology ... 160
2.1. Data sources and their application ... 160
2.1.1. Optical and Radar Satellite Images, and their application ... 161
xiv
2.2. CAESAR-LISFLOOD (CL) Hydrodynamic Model Description and Setup .. 169
2.3. Model Calibration and Validation ... 171
2.4. Evaluating model outcome and Flood Management Implications ... 173
3. Results and Discussion ... 173
3.1. Floodplain DEM Accuracy assessment with ICESat ... 173
3.2 Model Calibration and Validation ... 174
3.3. CAESAR-LISFLOOD Model outputs: evaluation of inundation maps and water levels ... 177
3.4. Model extent and Flood Management Implications ... 185
4. Conclusion ... 186
Chapter 6 Supplementary Materials ... 189
CHAPTER 7: IMPROVING RADAR IMAGERY FLOOD DETECTION CAPACITY USING MULTI-CRITERIA DECISION TREE ANALYSIS TECHNIQUE BUILT ON OPEN-ACCESS DATA ... 196
Abstract ... 196
1. Introduction ... 197
1.1. SAR flood mapping challenges ... 197
1.2. Some challenge compensation approaches ... 198
1.3. Study Description ... 199
2. Methodology ... 199
2.1. Study Area ... 199
2.2. Data requirements ... 200
2.2.1. Flood Inventory and Overflight geotagged photos... 200
2.2.2. Flood Conditioning Factors ... 201
2.2.2.1. Geological Formation ... 201
2.2.2.2. Soil Type ... 202
2.2.2.3. Distance from Waterbodies ... 203
2.2.2.4. Digital Elevation Model (DEM) and derivatives ... 203
2.2.3. Land use/cover classification ... 203
2.2.4. Synthetic Aperture Radar (SAR) Imagery Data: RADARSAT-2 and CosmoSkyMed ... 204
xv
3.2. Flood map accuracy assessment ... 209
3.3. CAESAR-LISFLOOD evaluation in the Niger Delta ... 210
4. Conclusion ... 211
CHAPTER 8: CONCLUSION, CONTRIBUTIONS, LIMITATIONS AND RECOMMENDATIONS ... 213
7.1. Contribution to Literature/Method ... 215
7.2. Contribution to policy and practices in Nigeria ... 217
7.3. Contribution to data archive for Nigeria ... 219
7.4. Limitations... 220
7.5. Hydrology, Hydrodynamics and Flood Mapping Uncertainties ... 223
7.5.1. Uncertainty in Frequency Analysis: ... 223
7.5.2 Uncertainty in hydrodynamic Modelling: ... 225
7.6. Recommendations and future research direction ... 227
REFERENCES... 230
APPENDICES ... 284
Appendix 1: Current Work: Informing Policy and Practice with Research in Nigeria, West Africa... 284
Appendix 2: Data types, tools, sources and use ... 285
Appendix 3: Ratings Curve and Equation ... 290
Appendix 4: GeoForm, crowdsourcing for flood monitoring in Nigeria ... 292
Appendix 5: Sample Agreements/Correspondence for data usage from 3rd party data collection companies ... 294
Appendix 6: Model Built for CAESAR-LISFLOOD Output post-processing ... 297
Appendix 7: Weka Decision Tree ... 298
Appendix 8 CAESAR LISFLOOD parameters. Adapted from Olayinka (2012) and sediment input. ... 299
xvi
CHAPTER 1 INTRODUCTION TO RESEARCH, AIM AND OBJECTIVES DEFINITION
Figure 1Distribution of flood occurrences 1985 – 2016 (Source: Dartmouth Flood Observatory) 1
Figure 2 Distribution of flood occurrences in Nigeria 1985 -– 2016 (Source: Dartmouth Flood
Observatory) ... 2
Figure 3 Classification of common causes of flood in Nigeria ... 5
CHAPTER 2: APPLICATIONS OF OPEN-ACCESS REMOTELY SENSED DATA IN FLOOD MAPPING FOR DATA SPARSE REGIONS: A REVIEW AND CASE STUDY OF NIGERIA Figure 1 (A) Graphic illustration of satellite altimetry height measurement principle (adapted from (Musa et al., 2015) ... 15
Figure 1 (B) Illustration of a virtual station, where altimetry satellite tracks intersect river Niger 15 Figure 1 (C) Typical water level time-series, derived from an altimetry virtual station ... 16
Figure 2 Map showing Nigeria, Niger Basin, Africa and the main inflow rivers (Niger and Benue) ... 31
Figure 3 Status of some hydrological gauging stations in Nigeria (F= Functional, NF = Non-Functional, Unknown) ... 32
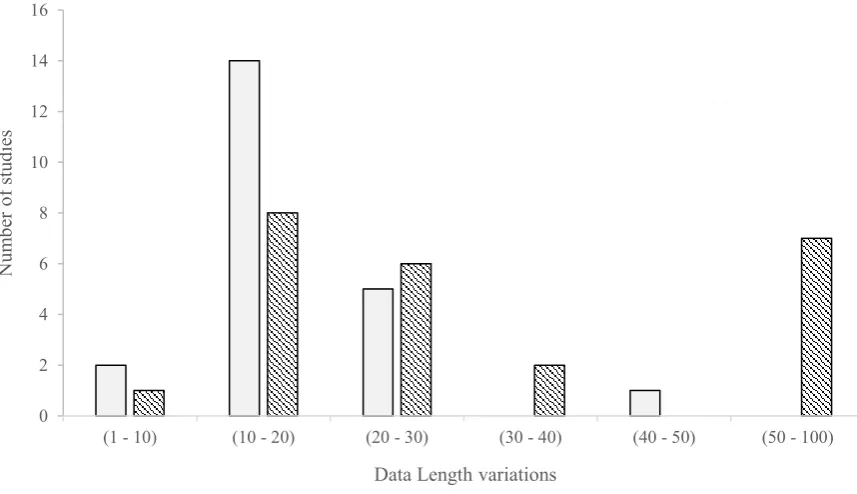
Figure 4 Rainfall and streamflow data length variation from various studies in Nigeria ... 33
Figure 5 Flood studies in Nigeria showing specific application areas ... 35
Figure 6 Remote sensing data application in flood studies in Nigeria ... 36
Figure 7 Radar (TerrSARx) and Optical (MODIS) flood extents comparison at Lokoja, Nigeria... 37
Figure 8 Flood studies in Nigeria showing other non-Remote sensing methods ... 37
Figure 9 Global Transboundary River Basins (source: Transboundary Freshwater Dispute Database) ... 38
Figure 10 Map of Transboundary Niger River Basin, showing constituting countries and Dams 40 Figure 11 Jason-1/2/3/TP Altimetry Tracks within the Niger River Basin ... 44
Figure 12 Sentinel 3A/B Altimetry Tracks within the Niger River Basin ... 44
Figure 13 SWOT Altimetry Tracks within the Niger River Basin ... 45
xvii
Figure 1: (A) Map of Nigeria showing in situ gauging stations, altimetry virtual stations and tracks along Niger and Benue Rivers. (B) Map of Africa showing Niger Basin imprint on Nigeria. (C) Niger South hydrological area showing tributaries (Niger and Anambra) and distributaries (Nun and Forcados) ...
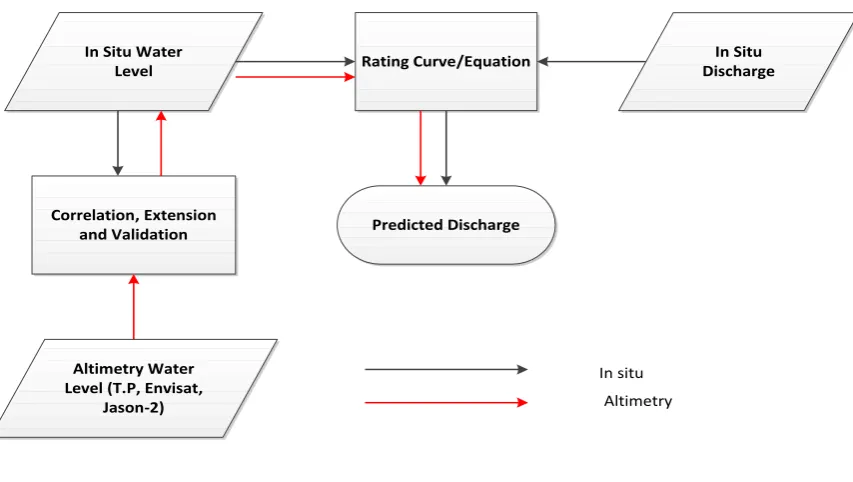
65 Figure 2 Methodology for estimating missing discharge data using radar altimetry, in situ water level and rating curves ...
71
Figure 3 (a) Baro station MI and RA Infilled time series ... 80
Figure 3 (b) Lokoja station MI and RA Infilled time series ... 80
Figure 3 (c) Umaisha station MI and RA Infilled time series ... 81
Figure 3 (d) Onitsha station MI and RA Infilled time series ... 81
Figure 4 (a) Taoussa Complete and Consecutive missing data ... 82
Figure 4 (b) Taoussa Complete and Inconsecutive missing data ... 83
Figure 5 Baro ratings ratio (RR) ... 86
Figure 6 Lokoja ratings ratio (RR) ... 87
Figure 7 Umaisha ratings ratio (RR) ... 87
Figure 8 Onitsha ratings ratio (RR) ... 88
Figure 9 Taoussa ratings ratio (RR) ... 88
Figure 10 (a-d): Probability distribution plots (PDP) of flood quantiles based on Multiple Imputation (MI) and Radar Altimetry (RA) filling methods ... 93 Supplementary Figure 1. Approach validation in-situ and Altimetry virtual station locations ... 100
Supplementary Figure 2. Taoussa Rating Curve ... 100
Supplementary Figure 3. In situ Station (Taoussa) vs Virtual Station (Taoussa) ... 101
Supplementary Figure 4 – 9 Taoussa flood frequency plots ... 102
xviii
Figure 2 (a-d) Trends and break points in the gauge data time series at the non-stationary data stations ...
116 Figure 3 L-Moment ratio diagram for the three (3) sub-regions ... 119 Figure 4 (a-d) relationship between climate indices and stations Peak Annual Flood Time series ... 122 Figure 5 Probability plots of regional and direct (at-site) flood frequency analysis taking climate variability into account ... 124 CHAPTER 5: INTEGRATING CROWD-SOURCING AND OPEN-ACCESS REMOTE
SENSING FOR FLOOD MONITORING IN DEVELOPING COUNTRIES
Figure 1 Population, Telephone subscribers and Internet users growth in Nigeria (Sources: NBS, Internetlivestats and Nigerian Communication Commission) ... 130 Figure 2 Map of the Niger River Basin within Africa and across Nigeria ... 134
Figure 3 UNISDR Disaster Communication Model adapted for this study ... 135
Figure 4 Overlay map of Flood extents (ext.) and crowdsourced data (Map) for 2012 and 2015
flood events ... 140 Figure 5 Zoomed-in flooded locations (Ughelli (C1), Amassoma (C2) and Patani (C3)) in the
Niger Delta (B) ... 141 Figure 6 (A-B) Amarata, VGIS detected flood in Yenagoa, Bayelsa state (2015), and (C-D)
Media reported flood in Amassoma, Bayelsa state (2015) ... 142 Figure 7 Overlay map of NIHSA 2015 Annual Flood Outlook (AFO), crowd-sourcing risk
perception, and MODIS NRT flood overlay (2012 and 2015) ... 150 Supplementary Figure 1 (a) Kainji Lake Water Levels and Variations ... 154 Supplementary Figure 1 (b) Benue River Water Levels and Variations ... 154 CHAPTER 6: HYDRODYNAMIC MODELLING OF EXTREME FLOODS IN DEVELOPING REGIONS USING MULTIPLE OPEN-ACCESS REMOTE SENSING DATA SOURCES. Figure 1 (A) Map of study area, showing the Niger-South river basin (hydrological area 5), gauging stations, ICESat elevation points, bathymetry points, DEM/Study domain and sub-domains. Figure 1 (B) Map of Africa showing the Niger Basin that discharges through the HA-5 into the Atlantic Ocean ... 160 Figure 2 Conceptual flowchart of integrated flood modelling and mapping in the Niger South... 161 Figure 3 Correlation between ICESat and BARE + BEST DEM points. (see figure II in supplementary material for others DEMs) ... 174
Figure 4 F-Statistic (Critical Success Index) versus Manning's roughness (n) ... 176
xix
and observed (In situ) flood water level comparison ... 180 Figure 7 Niger Delta overflight geotagged photo points comparison with model and SAR
observation outcomes (Photos for green points of focus shown in Figure 8) ... 183 Figure 8 Sectional examples of overflight photos of flooded areas compared to observed and
modelled flood in the Delta region, showing points of focus (Figure 7) ... 184 Figure 9 (A) comparison of SAR observed 2012 and 1-in-100 year modelled flood extents, and (B) comparison of SAR observed 2012 and modelled flood extents for the same period, as well as impacted settlements, roads and built-up areas in both A and B at Lokoja ... 186
Supplementary Figure 1 Baro flood frequency plot ... 190
Supplementary Figure 2 Umaisha flood frequency plot ... 190
Supplementary Figure 3 Correlation between ICESat points and DEM extracts EarthEnv (a), BARE (b), BEST (c), SRTM90 ... 191
Supplementary Figure 4 Water level points for accuracy assessment ... 192
Supplementary Figure 5 Model, Observation and Overflight line of sight overlaid on high-resolution GeoEye Imagery ... 193
Supplementary Figure 6. Input hydrographs at the upstream boundaries of Umaisha and Baro 195
CHAPTER 7: IMPROVING RADAR IMAGERY FLOOD DETECTION CAPACITY USING MULTI-CRITERIA DECISION TREE ANALYSIS TECHNIQUE BUILT ON OPEN-ACCESS DATA
Figure 1 Map of study area showing Location in Nigeria, the Niger South river Basin and States 200 Figure 2 Six priority condition factors determined by decision tree presented in Figure 3 …… 207 Figure 3 Decision Tree flood delineation based on influential factors ………. 208
DEFINITION
Table 1 Estimated global and local (Nigeria) flood impacts from 1985 – 2016 (Source:
Dartmouth Flood Observatory) ... 3
CHAPTER 2: APPLICATIONS OF OPEN-ACCESS REMOTELY SENSED DATA IN
FLOOD MAPPING FOR DATA SPARSE REGIONS: A REVIEW AND CASE STUDY OF
NIGERIA
Table 1 Flood mapping process and fundamental data requirement ... 12
Table 2 Altimetry characteristics Adapted and modified from (O'Loughlin et al., 2016a) 17
Table 3 Some open source digital elevation models ... 25
Table 4 SRTM and Modifications comparison with ICE Sat SPOT elevation ... 27
Table 5 Optical and Radar Satellite imageries case studies ... 30
Table 6 Niger River Basin Agreement, Nigeria. Adapted from (Bossard, 2009,
International Waters Governance, 2016, Wolf, 2002) ... 41
Table 7 Summary of the Copernicus EMS - Mapping Activations ... 48
CHAPTER 3: INFILLING MISSING DATA IN HYDROLOGY: SOLUTIONS USING
SATELLITE RADAR ALTIMETRY AND MULTIPLE IMPUTATION FOR
DATASPARSE REGIONS
Table 1 In situ gauge station characteristics (Source: NISHA, NIWA and NBA) ... 67
Table 2 Radar Altimetry mission and characteristics ... 69
Table 3 Characteristics of the altimetry virtual stations ... 72
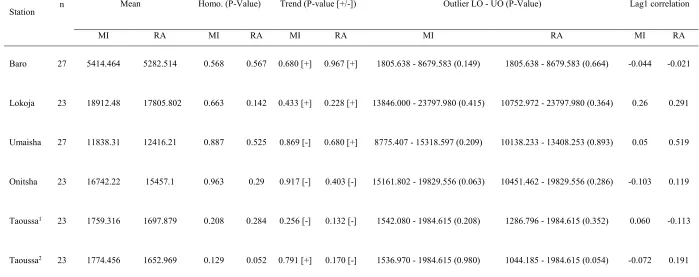
Table 4. Preliminary analysis results (Mean, Homogeneity, Trend, Outlier, Serial
correlation) ... 85
Table 5 Baro flood quantile estimates and uncertainty boundaries for MI and RA filled
data sets ... 90
xxi
filled data sets ... 91
Table 8 Onitsha flood quantile estimates and uncertainty boundaries for MI and RA
filled data sets ... 91
Table 9: Kolmogorov-Simonov and Permutation test results ... 96
Table 10: Taoussa flood quantile estimates and uncertainty boundaries for complete
historical data and consecutively and Inconsecutively gaped missing data filled with MI
and RA approaches ... 97
Table 11 Kolmogorov-Simonov and Permutation test results, Taoussa gauging station... 98
Supplementary Table 1. Radar Altimetry Missing data filling outcome ... 101
CHAPTER 4: ACCOUNTING FOR CLIMATE VARIABILITY IN REGIONAL FLOOD FREQUENCY ESTIMATES FOR WESTERN NIGERIA
Table 1 Gauge stations properties ... 109
Table 2 Preliminary test results ... 115
Table 3 Regional Average L-Statistics and H-Statistic for defined regions ... 117
Table 4 L-Moments and Discordancy Statistics for the Sites in the three Sub-regions .... 117
Table 5 Z Statistics for different probability distributions for the sub-regions ... 119
Table 6 Regional distribution parameters for the sub-regions ... 121
Table 7 Flood frequency estimates (Non-Stationary, Stationary regional and at-site) –
m3/s ... 123
CHAPTER 5: INTEGRATING CROWD-SOURCING AND OPEN-ACCESS REMOTE
SENSING FOR FLOOD MONITORING IN DEVELOPING COUNTRIES
Table 1 Quantitative flood risk assessment based on MODIS NRT Flood Data ... 139
Table 2 Percentage of flood detection points from respondents - MODIS and VGIS
Integration ... 141
Table 3 Descriptive Statistics Summary of Flood Risk Indicators ... 144
xxii
Supplementary Table 1. Definition of acronyms ... 155
CHAPTER 6: HYDRODYNAMIC MODELLING OF EXTREME FLOODS IN
DEVELOPING REGIONS USING MULTIPLE OPEN-ACCESS REMOTE SENSING
DATA SOURCES.
Table 1 Satellite imagery used in the study with acquisition dates and corresponding
upstream gauge station discharge values and Annual Exceedance Probability (AEP) ... 164
Table 2 Altimetry data and properties for sources used in this study (O'Loughlin et al.,
2016a) ... 165
Table 3 Parameter definition for performance indices ... 172
Table 4 Digital Elevation Model Comparative statistics (units [m]) ... 174
Table 5 Performance Matrices for optimal manning's roughness calibration (MODIS)... 177
Table 6 Performance Matrices for optimal manning's roughness calibration
(TerraSAR-X/MODIS/RADARSAT2/CosmoSkyMed) ... 177
Table 7 Comparative analysis of overflight data points, model and SAR observation
flood extents ... 184
Table 8 Model, Observed and 1-in-100-year flood exposure comparisons ... 185
Supplementary Table 1 Spatial data availability matrix for sub-domains ... 189
Supplementary Table 2 Coordinates of Water level points for accuracy assessment ... 192
CHAPTER 7: IMPROVING RADAR IMAGERY FLOOD DETECTION CAPACITY
USING MULTI-CRITERIA DECISION TREE ANALYSIS TECHNIQUE BUILT ON
OPEN-ACCESS DATA
Table 1 Study area geology, Adopted from (Reijers, 2011) ………. 202
Table 2 Study area soil constituents, Adapted from (Hengl et al., 2014) ………... 202
Table 3 Landsat 8 Imagery properties ………... 204
xxiii
Table 7 Flood Map accuracy assessment: Histogram Thresholding (HT) and Decision
Tree (DT) ………...
210
Table 8 CAESAR-LISFLOOD evaluation based on Histogram Thresholding and
Decision Tree ………
xxiv
Africa ... 284
Appendix 2: Data types, tools, sources and use ... 285
Appendix 3: Ratings Curve and Equation ... 290
Appendix 4: GeoForm, crowdsourcing for flood monitoring in Nigeria ... 292
Appendix 5: Sample Agreements/Correspondence for data usage from 3rd party data
collection companies ... 294
Appendix 6: Model Built for CAESAR-LISFLOOD Output post-processing ... 297
Appendix 7: Weka Decision Tree ... 298
Appendix 8: Appendix 8 CAESAR LISFLOOD parameters. Adapted from Olayinka
(2012) and sediment input ... 299
Appendix 9 Sample Flike Flood Frequency outcome (Umaisha, Radar Altimetry) and plot
xxv
I will like to appreciate my Wife Mrs Buloere Ekeu-wei for being my emotional backbone and inspiration during the course of this research, my parents, siblings and friends for their continuous encouragement and motivation.
My deepest gratitude to my PhD supervisor Professor George Alan Blackburn for guiding my research and helping me develop into a better researcher, and ensuring the success of my PhD programme. Also, Dr Mark Trigg (University of Leeds, UK), Prof Abam T.K.S. (University of Science and Technology, Nigeria), Dr Jason Giovannettone (Directing Manager of HydroMetriks, PLLC, USA), Mr Pedruco Philip (Principal Hydrologist, Jacobs, Australia), and Mrs Kate Azuma Ayo (Ph.D. Reseaecher, University of Benin, Nigeria) for taking time to review and provide comments that improved this Thesis.
Many thanks to Pastor (Oluwafemi Onikeku), his family and members of the Redeemed Christian Church of God (RCCG), Lancaster for being a family to me during my stay in Lancaster, and all organizations including National Emergency Management Agency (NEMA), Nigerian Hydrological Service Agency (NIHSA), National Inland Waterways Authority (NIWA), Federal Ministry of Water Resources (FMWR), River Basin Development Authorities (RBDAs), National Space Research and Development Agency (NASRDA), Digital Horizon Nigeria Limited, Royal HaskoningDHV, Shell Petroleum Development Company (SPDC) and Digital Horizon Limited that provided the data used in this study.
I also appreciate the staff, management and colleagues at the Lancaster Environment Centre (LEC), for their support, friendship and assistance during my study, and Dr. Dapeng Yu (external examiner) and Dr Suzana Ilic (Internal Examiner) for their contributions to improving this Thesis.
1 1. Background
1.1. Flood Hazard and Impact
Floods are arguably one of the most devastating disasters known to man, accounting for approximately one-third of global natural disasters, and impacting more people than any other natural or man-made phenomenon (Smith, 1998). Over the past decades, the impact of floods has been on the rise (Di Baldassarre et al., 2010, Aerts et al., 2014), resulting in the death of approximately 100,000 persons and affecting over 1.4 billion of the global populace in the last decade of the 20th century (Jonkman, 2005). Flood events
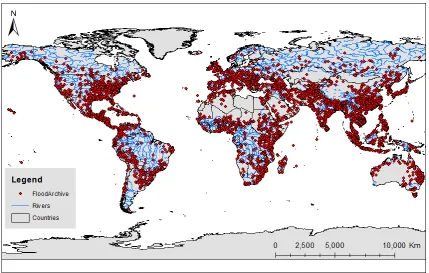
[image:26.595.100.530.422.695.2]are strongly linked to climate-change triggered weather variations, resulting in more severe and frequent storms (Yukiko et al., 2013). As the global population continue to increase, pushing people to settle in flood-prone regions (Burby et al., 2001), the exposure to flooding and its impact is expected to rise accordingly. The Global map of flood occurrences between 1985 to 2016 is presented in Figure 1, showing the spread of flooding across developed and developing regions.
2
[image:27.595.105.519.349.616.2]vulnerability varies widely from high to low-income regions, as the ability to cope with and mitigate flood impact varies with economic capacity (Brouwer et al., 2007, Adelekan, 2011). Godschalk (1999) argued that the low-income populace is naturally inclined to reside in high-risk regions due to the low cost of settling within such regions, thereby limiting their capacity to cope with and recover from disastrous events. Nigeria has experienced increased flooding in recent years (Brakenridge, 2016), with impact aggravated due to the high number of the vulnerable populace living within floodplains (Nkeki et al., 2013, Agada and Nirupama, 2015, Daura and Mayomi, 2015). Locations of flood occurrences in Nigeria are presented in Figure 2, while global and local (Nigerian) flood impacts are presented in Table 1 (Brakenridge, 2016), and provides details of impact for occurrences greater than or equal to 1-in-100-year flood.
3 Location Occurrence Deaths Displaced
Damage (‘USD)
Affected populace
≥ 100 year floods
Global 4387 661295 638196277 8.01*1011 4.62*108 725
Nigeria 58 1444 1881957 1.01*108 4.64*106 6
Recent reviews on flood risk assessment in Nigeria categorised the causes of flooding in terms of initiation and exacerbation factors (Nkwunonwo et al., 2016, Ugonna, 2016, Egbinola et al., 2015). Figure 3 shows a flowchart of the causes of flooding in Nigeria, including climate change, poor urban planning, urbanisation and anthropogenic activities. Climate change affects ocean-atmospheric patterns, thus initiating heavy storms that consequently cause pluvial (rainfall), fluvial (river) and coastal (ocean) floods (Nkwunonwo et al., 2015). Poor developmental blueprints, policies and implementation result in the violation of building regulations and settlement of persons within high-risk floodplains, thereby increasing impervious land surface, run-off and exposure to flooding. Also, anthropogenic activities such as poor waste management, upstream dam water releases, poorly designed hydraulic structures, blockage of waterways and drainages exacerbate flooding (Adeaga et al., 2008, Olukanni and Alatise, 2008, Etuonovbe, 2011, Raheem 2011, Agbola et al., 2012, Komolafe, 2015, Nkwunonwo et al., 2016). Although most floods occur independently, in some instances flood causes criss-cross, resulting in complex flood scenarios and associated risk. Nevertheless, this study is focused solely on fluvial (river) flooding.
Managing flood disasters sustainably requires the coordination of efforts before (preparedness), during (response) and after (recovery) flooding (APFM, 2011), to enable integrated flood management at variable paces to minimize flood effects. Courteille, (2015) highlighted components of the disaster risk management cycle:
4
3. Post-disaster (Recovery): encompasses reconstruction (resettlement and relocation), economic and social recovery, and risk assessment (lessons for recurrence mitigation and prevention).
Implementing these flood management strategies requires some form of data. Pre-and Post-flood management measures are usually deliberately paced, adapting existing methods that require available data. For instance, pre-flood measures can be accomplished by identifying locations susceptible to flooding based on knowledge of past flood trends from which annual flood exceedance probabilities are estimated (Reed, 1999). Flood estimates are then propagated through hydrodynamic models to route flood spread and quantify hazards (i.e. flood depth, velocity, and inundated area) (Sarhadi et al., 2012). Post-flood measures, on the other hand, entails identifying impacted locations, people and critical infrastructure within inundated areas to quantify damage and impact for reconstruction and rehabilitation purposes (Eyers et al., 2013, Thorne, 2014). Responding to floods in the heat of the event is particularly challenging, as real-time data processing and information are needed for a prompt response (Muller et al., 2015, Temimi et al., 2004, García-Pintado et al., 2013).
5 Figure 3 Classification of common causes of flooding in Nigeria
6
1.2. Aim
The aim of this study is to overcome data and resources limitations in developing regions to adequately model and map flooding, using alternative open-access geospatial technology within an integrated flood management framework that enhances preparedness, response and recovery.
1.3. Objectives
1) Identify the causes of data limitations in flood management and alternative open-access data sources available to fill the data gap.
2) Investigate varying hydrological data filling approaches to curtail missing data effect on flood frequency estimates.
3) Explore methods by which identified open-access, 3rd party and citizen acquired
data can be integratively applied to improve hydrodynamic modelling and flood mapping in data sparse regions.
7
1.4. THESIS STRUCTURE
This thesis is structured following the alternative format, composed of eight chapters, with Six (6) chapters (2-7) drafted to focus on specific research objectives.
Chapter 1: INTRODUCTION TO RESEARCH, AIM AND OBJECTIVES DEFINITION
Introduces the research problem of flood risk and the need for flood management, highlighting the key issues and rationale at global and local scales. The research aim and objectives of the research are also outlined.
Chapter 2: APPLICATIONS OF OPEN-ACCESS REMOTELY SENSED DATA IN FLOOD MAPPING FOR DATA SPARSE REGIONS: A REVIEW AND CASE STUDY OF NIGERIA
This chapter presents a review section that focuses on the data challenges and uncertainties associated with sparse data application in hydrological modelling, hydrodynamic modelling and flood mapping at global, transboundary and local (Nigerian) scales. The core causes of data limitations in developing regions are disclosed, and available alternative open-access remote sensing and third-party data sets that compensate for ground data deficiency in flood mapping are highlighted. Flood mapping processes including flood frequency estimation, hydrodynamic modelling, and inundation mapping are discussed, and ways radar altimetry, digital elevation model, bathymetry, optical, radar images, and satellite consortium data can be applied to curb data sparsity for each of these processes. Transboundary flood management challenges are also emphasised with the prospect of effective flood management through current and future open - access remote sensing data application.
Chapter 3: INFILLING MISSING DATA IN HYDROLOGY: SOLUTIONS USING SATELLITE RADAR ALTIMETRY AND MULTIPLE IMPUTATION FOR DATASPARSE REGIONS
8
radar altimetry and multiple imputation techniques to fill missing data in hydrological time series, consequently reducing flood estimates uncertainties. These approaches were aimed at reconstructing missing annual peak river discharges distorted due to destructive floods, discontinued gauging stations or inaccessibility to remote locations during flooding. The magnitudes of the 2012 and 2015 flood events at gauging stations along Niger and Benue rivers in Nigeria were also evaluated from distinctly filled time-series, and the application of these techniques in practice discussed.
Chapter 4: ACCOUNTING FOR CLIMATE VARIABILITY IN REGIONAL FLOOD FREQUENCY ESTIMATES FOR WESTERN NIGERIA
Logistical and financial challenges make it difficult to establish gauge stations at all required locations, hence the hydrological monitoring networks are often sparse, and several locations left ungauged (Chapter 2). Also, the increasing influence of climate change on floods as discussed in Chapter 1 and Chapter 2 annuls the assumption of stationarity in flood frequency estimation. Chapter 4 presents findings that assess the effect of climate variability on regional flood frequency estimates in the sparsely gauged Ogun-Osun River basin in Nigeria. Freely available International Centre for Integrated Water Resources Management–Regional Analysis of Frequency Tool (ICI-RAFT) that aids the integration of the National Oceanic and Atmospheric Administration (NOAA) climate indices into flood frequency estimation was applied, thereby supporting flood management in regions with limited resources.
Chapter 5: INTEGRATING CROWD-SOURCING AND OPEN-ACCESS REMOTE SENSING FOR FLOOD MONITORING IN DEVELOPING COUNTRIES
9
UN Office for Disaster Risk Reduction (UNISDR), focused on impacted persons communicating disaster reality to management agencies. Citizen and government perception of flood risk is evaluated, and citizen risk perception in relation to flood risk indicators such as Awareness, Worry and Preparedness is also assessed from supplementary data collected.
Chapter 6: HYDRODYNAMIC MODELLING OF EXTREME FLOODS IN DEVELOPING REGIONS USING MULTIPLE OPEN-ACCESS REMOTE SENSING DATA SOURCES
Chapter 6 portrays an integrated flood modelling and mapping approach applied in the Niger-South river basin of Nigeria (i.e. from Niger river at Baro and Benue river at Umaisha to the Niger Delta through Nun and Forcados tributaries). The hydrodynamic model incorporates open-access remote sensing, airborne (overflight), hydrographic and bathymetric data from multiple sources and third-parties. 2-D CAESAR-LISLFOOD model is applied using 2012 hydrograph and modified SRTM to recreate the unprecedented flood event hydraulically. The model was calibrated using a combination of satellite images (i.e. TerraSAR-X image, MODIS Near-Real-Time flood map, RadarSat-2, CosmoSkyMed), overflight geotagged photos and water levels available for three sub-domains. 1-in-100-year flood frequency estimates were modelled and compared in retrospect to the 2012 flood event to improve planning and management of subsequent events.
Chapter 7: IMPROVING RADAR IMAGERY FLOOD DETECTION CAPACITY USING MULTI-CRITERIA DECISION TREE ANALYSIS TECHNIQUE BUILT ON OPEN-ACCESS DATA
10
Chapter 8: CONCLUSION, CONTRIBUTIONS, LIMITATIONS AND RECOMMENDATIONS
11
CHAPTER 2: APPLICATIONS OF OPEN-ACCESS REMOTELY SENSED DATA IN FLOOD MAPPING FOR DATA SPARSE REGIONS: A REVIEW AND CASE STUDY OF NIGERIA
Abstract
Flood mapping generally entails flood frequency estimation, hydrodynamic modelling and inundation mapping, which requires specific data sets that are sometimes unavailable especially in developing regions due to financial, logistical, technical and organisational challenges. This chapter reviews flood modelling and mapping processes, outlining the data requirements and how open-access remote sensing can supplement for ground and high-resolution space-borne commercial data. The merits, demerits and application cases of data sets such as radar altimetry, DEM, optical and radar images are also discoursed for global, transboundary and local flood risk management. Also, the role of collaborative satellite information sharing and service delivery in flood disaster monitoring and management is disclosed.
Keywords: Open-access remote sensing, flood management, Altimetry, Synthetic Aperture Radar, Optical Satellite, Digital Elevation Model (DEM), Transboundary floods.
1. Introduction
1.1. Flood modelling and mapping
12
(probability of occurrence of a flood of specific magnitude over a certain period); hydrodynamic modelling (routing of river discharge or catchment runoff over landscape to determine water depth and inundation extent); and risk assessment (determining landscape properties impacted within flooded regions) (ISDR, 2004, Els, 2013, FME, 2005b, Aerts et al., 2009, Martini and Loat, 2007).
Table 1 highlights Flood mapping processes, basic data requirements, expected outcomes and some case studies. These processes aid flood management by providing the necessary information needed for planning, flood defence structure design, disaster response and recovery to mitigate flood effect.
Going forward, this review highlights the scarcity of data needed for mapping processes (Table 1), detailing how advancements in open-access remote sensing can compensate for ground monitoring deficiencies in local and transboundary river basins. Remote sensing data sets such as altimetry, digital elevation models, radar and optical images application in each flood mapping process are discoursed. To further demonstrate the usefulness of open-access remote sensing in developing regions, a case study of Nigeria is presented, emphasising on local and transboundary flood management developments, data limitations, current role and future prospect of remote sensing.
Table 1 Flood mapping process and fundamental data requirement
Process Data Outcomes Cases
Flood frequency estimation
▪ Historical data: River discharge,
water levels and rating curves/equations.
▪ Flood magnitude at
specific return periods (Direct and regional).
(Awokola and Martins, 2001, Kjeldsen et al., 2002, Leclerc and Ouarda, 2007, Ahn et al., 2014)
Hydrodynamic model
▪ Flood frequency outcome
▪ River discharge
▪ Digital elevation model
▪ Land use and cover map
Historical flood extent, and marks
▪ Inundation Extent
▪ Water depth
▪ Flood velocity and travel
time
(Sarhadi et al., 2012, Di Baldassarre et al., 2010, Muncaster et al., 2006, Neal et al., 2011a)
Flood risk assessment
▪ Hydrodynamic model outcomes,
demographic, socio-economic and infrastructure data.
▪ Exposure maps
▪ Vulnerability maps
▪ Evacuation plan
13
2. Data limitations, Prediction of Ungauged Basins (PUB) and Remote sensing advancement
In recent decades, floods have been perceived to be increasingly frequent, widespread and more devastating. As such, the spatial network of existing hydrological gauging stations has become inadequate for optimal data collection (NIHSA AFO, 2014). In other cases, obsolete equipment, financial and technical challenges hamper sufficient data collection for flood mapping and management (Olayinka et al., 2013, Maxwell, 2013). Due to increasing global data deficiency and uncertainty associated with sparse data application for hydrological and hydrodynamic modelling, the International Association of Hydrological Sciences (IAHS) launched the Prediction of Ungauged Basins (PUB) initiative to explore alternative data and techniques for improved Ungauged basin modelling (Sivapalan, 2003). One of the core objectives of the PUB is to “Advance the technological capability around the world to make predictions in ungauged basins firmly based on local knowledge of the climatic and landscape that controls hydrological processes, along with access to the latest data sources, and through these means constrain the uncertainty in hydrological predictions.” (Sivapalan et al., 2003). This objective aligns seamlessly with remote sensing, considering that it provides an alternative data source to improve our understanding of local hydrology and associated uncertainties in flood mapping for data-sparse regions (Hrachowitz et al., 2013).
14
3. Alternative open-access remote sensing data for flood modelling and management
3.1. Radar Altimetry Water Level and Elevation
River water levels are an essential data input for hydrology and hydrodynamic modelling, and advancement in remote sensing has improved the way changes in water surface elevation and slope can be measured since the early 90’s (Alsdorf et al., 2007). Several radar altimetry missions routinely measure freshwater surface despite being originally designated to measure ocean water surfaces (Koblinsky et al., 1993, da Silva et al., 2010). Radar altimetry data is acquired via a process that measures the distance between the orbiting satellite and water surface in relation to a reference datum, using satellite sensor echo pulse return intervals from when emitted to when reflection by water surface and return to satellite (Sulistioadi et al., 2015, Belaud et al., 2010), Figure 1 (A). Altimetry water levels are measured at virtual stations located intermittently where altimetry satellite tracks cross path with rivers (Birkinshaw et al., 2014b, Musa et al., 2015); when altimetry tracks pass over dry land, the elevation of the surface intersected is measured. Figure 1 (B) and (C) shows a sample virtual station and extracted altimetry time series (Crétaux et al., 2011) along the Niger River in Nigeria. The water level at a river of interest with reference to a predefined datum (such as Earth Gravitational Model (EGM 2008)), is expressed as:
ℎ = 𝐻 − 𝑅𝐶𝑜𝑟 (1)
𝑅𝑐𝑜𝑟 = 𝑅 − (𝑐 ∆𝑡
2) − ∑cor (2)
Where, h = water surface elevation in relation to the reference ellipsoid, H = altitude of satellite (from satellite orbit to reference ellipsoid), R = range (distance between satellite and open surface water body), Rcor = corrected range, c = speed of light, ∆𝑡
15
direction travel time of radar signal, and ∑cor = the sum of ionospheric, tidal, wet and dry tropospheric corrections.
Figure 1 (A) Graphic illustration of satellite altimetry height measurement principle (adapted from (Musa et al., 2015)
16
Figure 1 (C) Typical water level time-series, derived from an altimetry virtual station The vertical accuracy of altimetry water levels directly affects the results derived from its application (O'Loughlin et al., 2016a). In comparison to ground (in situ) measurements, altimetry water level vertical accuracy ranges from approximately 0.01 to 0.05 metres, and Root Mean Squared Error (RMSE) from 0.003 to 0.004 metres for watershed areas up to 100 km2 (Birkett, 1995, Birkett et al., 2002, da Silva et al., 2010,
Frappart et al., 2006). In some cases, the difference between altimetry and in situ water levels can be as high as 2 metres (Birkinshaw et al., 2010). Variations of altimetry water level accuracies are presented in Table 2 and are attributed to varying sensor types, the distance between in situ and virtual station, and location of altimetry track intersection with the river (Yan et al., 2015a). Other factors that affect altimetry accuracy include ionosphere, troposphere, instrument noise, geoid, tidal and water surface variations (Ponte et al., 2007, Chelton et al., 2001, Belaud et al., 2010). River width and tributaries discharging into main rivers upstream of the virtual station have also been identified as the external factors that contributed to altimetry water level discordancy from in situ measurements (Sulistioadi et al., 2015, Pandey and Amarnath, 2015).
The application of radar altimetry has been largely documented, especially in hydrodynamic modelling in data sparse regions. Four (4) aspects of altimetry application in data sparse regions are discussed below (Sections 3.1.1 to 3.1.4) include Altimetry discharge estimation, Altimetry Digital Elevation Model (DEM) accuracy assessment, Altimetry Bathymetry definition, and Altimetry hydrodynamic model
17
calibration and validation. Table 2 Altimetry characteristics Adapted and modified from (O'Loughlin et al., 2016a)
S/N Mission Ground
footprint (m)
Revisit time (days)
Operation timeline
Accuracy (m) References
1 TOPEX/Poseidon ~600 9.9 1993-2003 0.35 (Frappart et al., 2006)
2 ERS-1 ~5000 35 1991-2000 N/A (da Silva et al., 2010)
3 ERS-2 ~400 35 1995-2003 0.55 (Frappart et al., 2006)
4 ENVISAT ~400 35 2002-2012 0.28 (Frappart et al., 2006)
5 Jason-1 ~300 10 2002-2009 1.07 (Jarihani et al., 2015a)
6 ICE Sat/GLAS ~70 - 2003-2009 0.10 (Urban et al., 2008)
7 Cyrosat-2 ~300 369 2010* < SRTM (Schneider et al.,
2016)
8 Jason-2 ~300 10 2008* 0.28 (Jarihani et al., 2015a)
9 SARAL/Altika ~173 35 2013* 0.11 (Schwatke et al.,
2015c)
10 Sentinel 3 SRAL ~300 27 2016* 0.03 (ESA, 2016)
11 Jason-3 ~300 10 2016* 0.03 (NASA, 2016)
12 SWOT ~10 -70 21 2020+ 0.10 (Fu et al., 2009)
Current = *, Future = +
3.1.1. Altimetry discharge estimation
18
Papa et al., (2010) utilised TOPEX/Poseidon, ERS-2, ENVISAT and Jason 2 altimetry water levels in combination with in situ rating curve to estimate discharge along Ganga and Brahmaputra river from 1993-2011to accuracy levels of 0.17 (mean error) and 0.28 (standard error) in comparison to in situ discharge at gauging stations. River discharge along Godavari river from 2001 to 2014 was derived by combining ENVISAT (2002-2010), Jason-2 (2008-2014) and SARAL/Altika (2013-2014) radar altimeter water levels with in situ rating curves at nearby gauging stations, and validated against hydrodynamic model to a correlation coefficient (R2) value of 0.9 and standard error
varying from 0.15 to 0.40 metres (Sridevi et al., 2016). In an Amazon River basin study, Getirana and Peters-Lidard, (2013) explored the potential of estimating discharge at 135 gauging stations using altimetry data from 475 ENVISAT virtual stations (2002 – 2005). Using the relationship between in situ water level and discharge, Getirana and Peters-Lidard, (2013) successfully estimated discharge at 90 virtual stations with mean relative errors varying from 15 to 84% for large and small river basins respectively. Discharge was estimated at transboundary rivers including Danube (Austria, Romania, Bulgaria, Slovakia, Hungary, Ukraine, Croatia, Germany, Serbia, and Moldova), Mekong (Thailand, Cambodia, Laos, China, Myanmar (Burma and Vietnam), Amazon (Ecuador, Colombia, Peru, and Brazil), Brahmaputra (India), Amur (China and Russia), Ob (Russia), Vistula (Poland) and Niger (Nigeria, Mali, Niger, Benin, and Guinea), using quantile function algorithm approach that exploits ENVISAT altimetry data (Tourian et al., 2013). This approach resulted in discharge outcomes similar to those derived from conventional Forecast Rating Curve (FRC) approach.
Moderate-19
resolution Imaging Spectroradiometer (MODIS) Terra and Aqua satellite images with ENVISAT altimetry using a pixel to water level detection approach to estimate discharge with a correlation coefficient of 0.96 and Nash-Sutcliffe efficiency of 0.91 when compared to in situ discharge along the Niger and Benue rivers. Sichangi et al., (2016) similarly integrated MODIS satellite derived river width and altimetry water levels into Manning’s equation to estimate discharge at a Continental scale. The derived discharge Nash-Sutcliffe efficiency varied 0.60 to 0.97.
Other than a few studies including Getirana and Peters-Lidard, (2013), Tarpanelli et al., (2016) and Sichangi et al., (2016) that have demonstrated direct river discharge estimation in the absence of in-situ data, river discharge estimation from altimetry is usually based on the establishment of an empirical relationship with in situ gauging stations available at proximity to virtual stations. Although discharge estimates derived from altimetry are usually with acceptable levels of uncertainty, factors such as the distance between virtual and ground stations, contributing tributaries and the width of the river affect the efficacy of such estimates (Pandey and Amarnath, 2015). The discussed discharge estimation approaches also reveal that the availability of multiple supplementary remote sensing data at an ungauged river basin integrated into empirical formulas and hydrodynamic models can improve discharge estimates.
3.1.2. Altimetry Digital Elevation Model (DEM) accuracy assessment
20
and 11 October, 2009 using geoscience laser altimeter system (GLAS) onboard the Ice Cloud and Land Elevation Satellite (ICE Sat) provides a worthy alternative to ground elevation due to its high accuracy in comparison to Kinematic GPS measurements (Zwally et al., 2002). The absolute accuracy of ICE Sat is recorded to be as low as 0.002 and 0.005 meters in Bolivia (Fricker et al., 2005) and French Lake (Jean Stéphane et al., 2011) respectively, and depend on the slope of the terrain under scrutiny (Satgé et al., 2015). Over the years ICE Sat/GLAS has been applied in assessing various DEM accuracies including SRTM (Carabajal and Harding, 2005, Kon Joon Bhang et al., 2007, Du et al., 2016), ASTER GDEM (Zhao et al., 2010, Satgé et al., 2015), GPS elevation (Braun and Fotopoulos, 2007), Carto DEM (Rastogi et al., 2015), Canadian DEM (Beaulieu and Clavet, 2009), InSAR DEM (Yamanokuchi et al., 2006), TANDEM (Mirzaee et al., 2015) and modified/corrected DEMs (Jarihani et al., 2015a, Sampson et al., 2015, O'Loughlin et al., 2015).
The 70-metre ground footprint of ICE Sat (Zwally et al., 2002) coupled with its ability to penetrate gaps in vegetation canopy to capture underlying bare earth elevation (Heyder, 2005) makes it a more accurate and useful alternative to ground survey for DEM accuracy assessment.
3.1.3. Altimetry Bathymetry definition
21
five points along a 240 km reach along the Amazon river to within 0.50 m and 0.30 cm km-1 of accuracies respectively. Both derivatives were then integrated into
LISFLOOD-FP hydrodynamic model (Bates and De Roo, 2000) to improve inundation extent and downstream water surface elevation (WSE). The relationship between river width and depths established using ENVISAT altimetry was combined with SRTM, Landsat, MODIS and satellite rainfall data to derive updated river network and adjusted bed profile was applied in the development of Ganges, Brahmaputra, and Meghna (GBM) model suitable for large ungauged watersheds (Maswood and Hossain, 2016). The GBM model data integration resulted in a reduced RMSE from 3.0 to 1.0 metres. In another study by Yoon et al., (2012), SWOT WSE was assimilated into LISFLOOD-FP hydrodynamic model using a local ensemble batch smoother (LEnBS) method, resulted in the generation of bathymetry, depth and discharge estimates. Bathymetry extracted from SWOT had a RMSE of 0.56 metres, improving with the inclusion of more SWOT observations in the modelling process.
The proposed SWOT and recently launched Sentinel-3 provides a huge dataset prospect for future of hydrodynamic studies, and integration into hydrodynamic models can improve flood extent, discharge and water levels outcomes, particularly when multiple altimetry data are available along a modelled reach as Yoon et al., (2012) suggested. 3.1.4. Altimetry hydrodynamic model calibration and validation
22
decade has been explored globally as an alternate source of data for model calibration and validation (Domeneghetti, 2016).
Typically, in developing regions river measurements are manually collected using staff gauges and later converted to discharge using an established rating curve. At the peak of floods, measurement equipment are usually damaged and access roads inundated, thus impeding the observation process (Olayinka et al., 2013, Dano Umar et al., 2011). Therefore, remote sensing radar altimetry provides an alternative river measurement option that supports hydrodynamic model calibration and validation in the absence of observed records (Domeneghetti, 2016).
Water level data from three ENVISAT altimetry virtual stations along a 150km reach of Danube river were applied in the calibration a 2-D LISFLOOD-FP model to reconstruct the 2006 transboundary flood occurrence (Yan et al., 2015b). Yan et al., (2015b) realised a Mean Average Error (MAE) of 1.53 m and 1.37 m for altimetry and in situ model calibration approaches respectively, suggesting that both data sets can be used interchangeably to improve flood modelling in sparsely gauged river basins. Domeneghetti et al., (2014) performed hydrodynamic model calibration for a 140 km reach along the Po river using ERS-2 and ENVISAT altimetry data, resulting in RMSE of 0.85 m and 0.73 m respectively, and improved Nash–Sutcliffe efficiency (NS) when altimetry is combined with in situ data for model calibration. Soil and Water Assessment Tool (SWAT) rainfall run-off model for the sparsely gauged Okavango transboundary river of Angola, Namibia and Botswana were calibrated using total water storage derived from Gravity Recovery and Climate Experiment (GRACE) altimetry satellite and in situ data (Milzow et al., 2011). Also, Sun et al., (2012) assessed the uncertainty associated with HYdrological MODel (HYMOD) along the Mississippi River, calibrated against in situ and altimetry data. NS efficiencies of 79.05 and 64.50 were reported for in situ stream flow and radar altimetry (TOPEX/Poseidon) respectively, showing reduced uncertainty bounds for stream flows calibration in comparison to altimetry calibration.
23
river survey cross-section embedded terrain result in hugely discordant accuracies when calibrated with similar datasets (Domeneghetti et al., 2014). This thereby raises the question of altimetry uncertainty in model calibration and accuracy assessment. Belaud et al., (2010) applied TOPEX/Poseidon (T/P) and ENVISAT altimetry satellites data in calibrating a propagation model and disclosed that inherent altimetry uncertainty effect on the model outcome.
Residual altimetry uncertainties are expected to affect flood model accuracy as Tommaso et al., (2013) further demonstrated and further emphasised by Domeneghetti et al., (2014), where ENVISAT proved to provide better accuracy than ERS-2 (See Table 2 for altimetry accuracy differences).
Despite these deficiencies, the importance of altimetry data in model calibration and validation in ungauged basins cannot be dismissed. However, it is advised that altimetry is applied in combination with in situ data when available (Domeneghetti et al., 2014), or in situ, data should it takes priority over altimetry as suggested by Sun et al., (2015) and Sun et al., (2012).
3.2. Open-access Digital Elevation Model (DEM), Modifications and applications in flood modelling
24
Freely available digital elevation model provides a suitable alternative to commercial data in data sparse developing regions where resources are limited (Patro et al., 2009, Lewis et al., 2013).
Shuttle Radar Topography Mission (SRTM) DEM is arguably one of the most widely used topographical data in developing regions, applied mostly in improving flood modelling in data-sparse regions (Sanyal et al., 2013, Domeneghetti, 2016, Jarihani et al., 2015a, Neal et al., 2012). The 30 and 90 metres resolution SRTM was collected during an 11-day mission in February 2000, through a collaborative effort among the National Aeronautics and Space Administration (NASA), the National Geospatial-Intelligence Agency (NGA) and the German Aerospace Centre (DLR), and provides near-global scale (80%) DEM (Farr et al., 2007, Farr and Kobrick, 2000). The 15 metre Advanced Spaceborne Thermal Emission and Reflection Radiometer (ASTER) Global Digital Elevation Model (GDEM) acquired by a joint mission of the U.S. National Aeronautics and Space Administration and Japan’s Ministry of Economy, Trade, and Industry is also widely used in flood modelling and mapping (Gichamo et al., 2011, Demirkesen, 2016, Ullah et al., 2016). However, ASTER GDEM is argued to be less accurate than SRTM due to inherent elevation pixel voids (Wang et al., 2012, Bates et al., 2014).
25
Table 3 Some open source digital elevation models
DEM Spatial
resolution (m)
Vertical error (m)
Case study Reference
SRTM 30, 90 ± 16 Damoda River,
India.
(Rodriguez et al., 2006, Sanyal et al., 2013)
ASTER GDEM 30 ± 25 Lake Tana,
Ethiopia.
(Tarekegn et al., 2010, Tachikawa et al., 2011)
ACE 2 GDEM 1000 >10 Balkan Peninsula,
Croatia.
(Varga and Bašić, 2015)
GTOPO30 1000 9-30 Balkan Peninsula,
Croatia.
(Varga and Bašić, 2015)
Bear-Earth SRTM (Veg/Urban)
90 6.05- 12.64 Belize, Honduras. (Sampson et al., 2015)
Bare-Earth SRTM (Veg)
90 4.85- 8.667 Global (O'Loughlin et al., 2015)
EarthEnv-DEM90 90 4.13-10.55 Johor River Basin,
Malaysia.
(Tan et al., 2015, Robinson et al., 2014)
ALOS 30 ± 5 Sindh and
Balochistan, Pakistan.
(Tadono et al., 2014, Jilani et al., 2007)
GMTED2010 250 26-30 Shikoku, Japan. (Danielson and Gesch,
2011, Pakoksung and Takagi, 2016)
26
27
from 10.96 m to 6.05 m when compared to LiDAR, and overall flood model bias from 15.08 m to -0.1 m. EarthEnv-DEM90 was developed by Integrating ASTER GDEM2, CGIAR-CSI SRTM V4.1 and Global Land Survey Digital Elevation Model (GLSDEM) using a combined Delta surface filling (Grohman et al., 2006) and adaptive DEM noise smoothing (Gallant, 2011) methodology, resulting in minimised error in comparison to raw SRTM and ASTER GDEM2 (Robinson et al., 2014).
Since no study currently presents a comparison of all available modified SRTM DEM for a specific region, this is undertaken for the Niger-South river basin of Nigeria and presented in Table 4, revealing EarthEnv90 to be the most improved modified open-access DEM when evaluated against ICE Sat altimetry SPOT heights. The results presented in Table 4 will later inform the choice of DEM selected for hydrodynamic modelling in Chapter 6.
Table 4 SRTM and Modifications comparison with ICE Sat SPOT elevation
Elevation Min Max Mean Std. dev. R2 RMSE
Bare-Earth SRTM (Urban and Veg) 36.00 68.00 47.28 9.09 0.95 2.94 Bare-Earth SRTM (Veg) 34.45 69.44 47.21 9.22 0.95 2.94
EarthEnv90 36.00 65.00 47.40 8.91 0.95 2.85
Raw-SRTM 36.00 63.00 47.34 8.95 0.94 3.08
ICE Sat 35.62 64.33 47.74 8.01 - -
Std. dev = standard deviation, R2 = Correlation coefficient
3.3. Open-access Optical and Radar Satellite Images application in Flood Modelling and Mapping