Abstract— The objective of the paper is to obtain an optimal
setting of turning process parameters –cutting speed, feed and depth of cut, which may result in optimizing tool life of TiC coated carbide inserts while turning En24 steel (0.4 % C ). The effects of the selected process parameters on the tool life and the subsequent optimal settings of the parameters have been accomplished using Taguchi’s r design of experiments approach. The results indicate that the selected process parameters significantly affect the mean and variance of the tool life of the carbide inserts. The percent contributions of parameters as quantified in the S/N pooled ANOVA envisage that the relative power of feed (8.78 %) in controlling variation and mean tool life is significantly smaller than that of the cutting speed (34.89 %) and depth of cut (25.80 %). The predicted optimum tool life is 20.19 min. The results have been validated by the confirmation experiments.
Index Terms— Design of experiments, Taguchi Methods, tool
life, turning process
I. INTRODUCTION
Even though the machine tool industry in India has made tremendous progress, the metal cutting industries continue to suffer from a major drawback of not running the machine tools at their optimum operating condition. The problem of arriving at the optimum levels of the process parameters has attracted the attention of the researchers and practicing engineers for a very long time. Unfortunately, however, the impact of the research work in this area does not seem to have reached a large majority of manufacturing engineers in India with the result that the operating conditions continue to be chosen solely on the basis of handbook values and / or manufacturers’ recommendations and / or worker experience. The literature survey has revealed that several researchers have attempted to calculate the optimum cutting conditions in a turning operation. Brewer and Rueda developed various nomograms to assist in the selection of optimum conditions [1]. Armarego and Brown used the maxima /minima principle of differential calculus for optimization of machining variables in turning operation [2] . Other techniques which have been used to optimize metal cutting conditions include geometrical programming [3] and goal programming [4]. Elsayed and Chen determined optimal settings of process parameters of production process using robust design methodology [5].
The Taguchi method of off-line quality control encompasses Manuscript received December 24, 2007.
Hari Singh is with the National Institute of Technology, Kurukshetra, India (phone: +91-1744-239720; fax: +91-1744-238050; e-mail: [email protected]
all stages of product /process development. However, the key element for achieving high quality at low cost is Design of Experiments (DOE). Quality achieved by means of process optimization is found by many manufacturers to be cost effective in gaining and maintaining a competitive position in the world market .In this paper Taguchi’s DOE approach is used to analyze the effect of turning process parameters – cutting speed, feed and depth of cut, on tool life of TiC coated carbide inserts while machining En 24 steel and to obtain an optimal setting of these parameters that may result in optimizing tool life.
II. TURNING PROCESS PARAMETERS
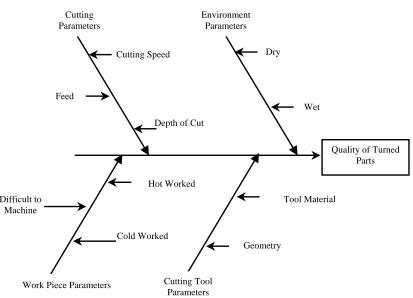
In order to identify the process parameters that may affect the machining characteristics of turned parts, an Ishikawa cause-effect diagram was constructed and is shown in Figure1. The process parameters affecting the characteristics of turned parts are: cutting tool parameters – tool geometry and tool material; work piece related parameters- metallography, hardness, etc.; cutting parameters- cutting speed, feed, depth of cut, dry cutting and wet cutting [6]-[7].
En24 steel is a difficult-to-machine material because of its high hardness, low specific heat and tendency to get strain hardened. The life of the cutting tool is shortened due to the tendency of the work material to carry the carbide particles with the outgoing chip at elevated temperature. En24 steel finds its typical applications in the manufacturing of automobile and machine tool parts [8]. Because of its wide application En24 steel has been selected as the work material in this work. The recently developed tool materials like coated carbides have improved the productivity levels of difficult-to-machine materials. Thus coated carbide tool Widadur TG of Widia India Limited has been selected to turn En24 steel [9].
The following process parameters were selected for the present work:
Cutting speed – (A); Feed – (B); Depth of cut – (C); Tool material–Widadur TG inserts; Work material-En24 steel; Environment-dry cutting.
The ranges of the selected process parameters were ascertained by conducting some preliminary experiments using one variable at a time approach [9]. The process parameters, their designated symbols and ranges are given in Table 1. The following parameters were kept fixed during the entire experimentation:
Work material- En24 steel (0.4 % C, 220 BHN); Cutting tool insert-Widadur TG; Insert geometry -SPUN 12 03 08 (ISO designation); Tool holder- CSBPR 25 25 H 12 (ISO
Optimizing Tool Life of Carbide Inserts for Turned Parts using
Taguchi’s Design of Experiments Approach
III. SELECTION OF AN ORTHOGONAL ARRAY
In selecting an appropriate OA, the pre-requisites are: (a) selection of process parameters and interactions to be evaluated and (b) selection of number of levels for the selected parameters [10]. The process parameters are already decided and are given in Table 1. It was also decided to study the interactions among the parameters. The selected interactions were-cutting speed and feed (AxB); feed and depth of cut (BxC); cutting speed and depth of cut (AxC). It was also decided to study each selected parameter at three levels. This is due to the reason that non – linear behaviour, if any, of the parameters of a process can only be revealed if more than two levels are used [11]. It is also necessary that the interval between the levels in multi level experiment must be equal [12]. With three parameters each at three levels and three second-order interactions, the total degree of freedom (DOF) required is 18 [=3x(3-1)+3x4]. As per Taguchi’s DOE approach, the total DOF of the selected OA must be greater than or equal to the total DOF required for the experiment. So, an L27 (3
13
) OA was selected for the present work. The parameters and interactions were assigned to specific columns of the array using linear graphs [13].
IV. EXPERIMENT, ANALYSIS AND DISCUSSION
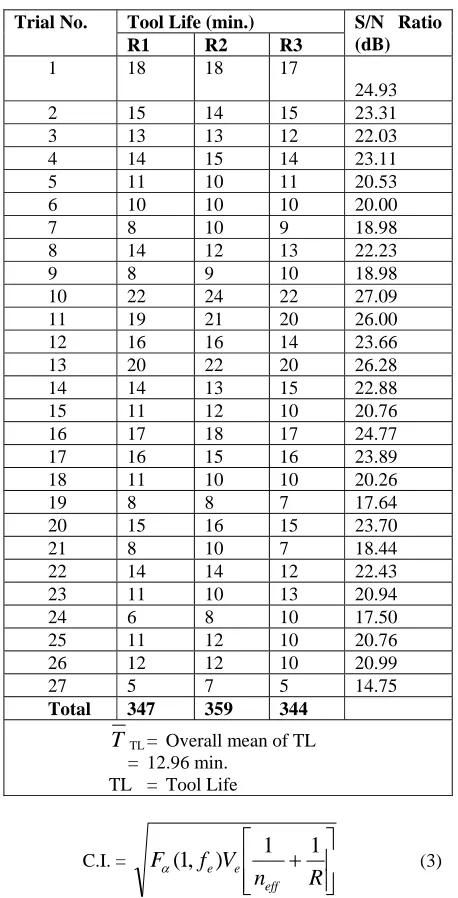
En24 alloy steel rods of 90mm diameter and 500mm length were turned on an H-22 centre lathe of H.M.T. TiC coated carbide inserts were used to machine En24 steel (0.4%C) of 220 BHN. Three cutting edges of a square insert were used to turn En24 steel for each trial condition using randomization technique. Thus 81cutting edges (21 carbide inserts, 4 edges each) were utilized according to the trial conditions specified in the orthogonal array. For tool life assessment, flank wear width was measured by a Large Tool Maker’s microscope at an interval of 1 minute and the flank wear criterion of 0.45 mm against one tool life was applied. The results of the experiments for twenty-seven trial conditions with three repetitions are reported in Table 2. The selected quality characteristic, tool life, is a ‘ higher the better’(HB) type and the S/N (signal to noise) ratio for ‘higher the better’ type of response was used as given in (1) [12].
(S/N)HB= -10log
⎥
⎥
⎦
⎤
⎢
⎢
⎣
⎡
⎟⎟
⎠
⎞
⎜⎜
⎝
⎛
+
+
2n 2
2 2
1
y
1
....
y
1
y
1
n
1
(1)
Where y1, y2 ……yn are the responses of quality characteristic for a trial condition repeated n times.
tool life of TiC coated carbide inserts for turning En24 steel. The interaction graphs ( not shown here ) between cutting speed and feed , feed and depth of cut , cutting speed and depth of cut , reveal that A2B1 , B1C1, A2C1 are the best treatment combinations to give maximum tool life. Thus the interaction analysis reinforces the selection of 2rd level of cutting speed (A2) , 1
st
level of feed ( B1 ) and 1 st
level of depth of cut (C1) based on their individual effects.
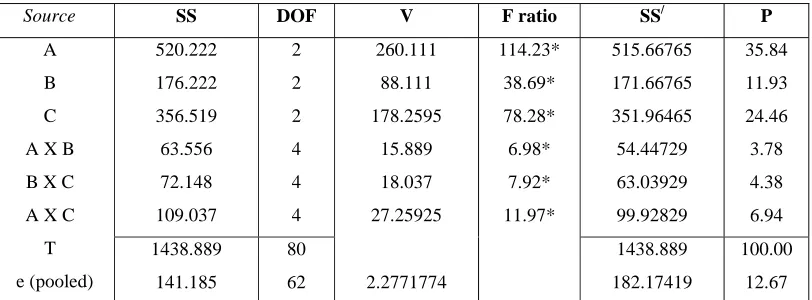
In order to study the significance of the parameters in affecting the quality characteristic of interest (tool life), analysis of variance (ANOVA) was performed. The pooled ANOVA of the raw data (tool life) is given in Table 3. The S/N ANOVA (pooled version) is given in Table 4. It is clear from ANOVAs that the parameters A, B and C (cutting speed , feed and depth of cut respectively ) significantly affect both the mean value as well as the variation of the tool life because these are significant in both the ANOVAs. The interactions ( AXB , BXC and AXC) are significant in ANOVA for raw data only and hence affect mean value of tool life only . The percent contributions of parameters as quantified under column P of Tables 3 and 4 reveal that the relative power of cutting speed (A) and depth of cut (C) in controlling the mean and variation is significantly larger than the relative power of feed (B).
V. ESTIMATING OPTIMAL TOOL LIFE
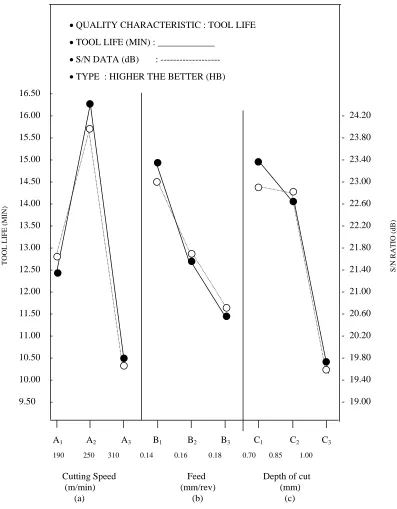
The optimal tool life (μTL) is predicted at the selected optimal setting of process parameters. The significant parameters with optimal levels are already selected as: A2, B1 and C1. The interaction effects are not being considered in estimating mean and confidence interval around the estimated mean due to poor additivity between parameters and interactions [12]. The estimated mean of the response characteristic can be computed as [12] :
μTL =
A
2 +B
1+C
1 –2T
TL (2)where
T
TL = overall mean of tool life = 12.96 min. (Table 2)A
2 ,B
1 andC
1 are the mean values of tool life with parameters at optimum levels . From Figure2:A
2 = 16.33 min. ,B
1 = 14..93 min. ,C
1 = 14.85 min. Hence μTL = 20.19 min.Quality of Turned Parts Cutting
Parameters
Cutting Speed
Depth of Cut
Wet Dry
Geometry
Tool Material
Cutting Tool Parameters Cold Worked
Hot Worked Difficult to
Machine
Environment Parameters
[image:3.612.132.545.85.383.2]Work Piece Parameters Feed
Fig. 1. Ishikawa Cause-Effect Diagram of a Turning Process
Table I: Process Parameters with their Values at three Levels
Levels Process Parameters
(1) Parameters Designatio n
L1 L2 L3
Cutting speed (m/min) A 190 250 310
Feed (mm/rev) B 0.14 0.16 0.18
Table II: Experimental Data of Tool Life and Signal to Noise Ratio
Tool Life (min.) Trial No.
R1 R2 R3
S/N Ratio (dB)
1 18 18 17 24.93
2 15 14 15 23.31
3 13 13 12 22.03
4 14 15 14 23.11
5 11 10 11 20.53
6 10 10 10 20.00
7 8 10 9 18.98
8 14 12 13 22.23
9 8 9 10 18.98
10 22 24 22 27.09 11 19 21 20 26.00 12 16 16 14 23.66
13 20 22 20 26.28
14 14 13 15 22.88 15 11 12 10 20.76 16 17 18 17 24.77 17 16 15 16 23.89 18 11 10 10 20.26 19 8 8 7 17.64 20 15 16 15 23.70 21 8 10 7 18.44 22 14 14 12 22.43 23 11 10 13 20.94 24 6 8 10 17.50 25 11 12 10 20.76 26 12 12 10 20.99 27 5 7 5 14.75
Total 347 359 344
T
TL = Overall mean of TL = 12.96 min.TL = Tool Life
C.I. =
⎥
⎥
⎦
⎤
⎢
⎢
⎣
⎡
+
R
n
V
f
F
eff e e
1
1
)
,
1
(
α (3)
where Fα (1, fe) = F ratio required for α; α= risk ; fe= error DOF; Ve =error variance
neff = effective number of replications =
]
[
1
Total
DOF
associated
in
the
estimate
of
mean
N
+
C.I. was calculated.
Total DOF associated with the mean (μTL) = 2x3 = 6; Total trials = 27; N = 3x27 = 81
neff = 11.57; α = 0.05; F0.05 (1, 62) = 4.00 (tabulated value , from F- tables)
The calculated C.I. is: C.I = ± 1.955
The predicted optimal tool life is: μTL = 20.19 min. The 95% confidence interval of the predicted optimal tool life is:
(μTL-C.I.) < μTL (min.)<( μTL + C.I.) 18.235 <μTL (min.)< 22.145
VI. CONFIRMATION EXPERIMENT
Three confirmation experiments were conducted at the optimal setting of turning process parameters recommended by the investigation. The average value of tool life was found to be 20.33 min. This result was within the confidence interval (95 %) of the predicted optimal tool life.
VII. CONCLUSIONS
1.The percent contributions of parameters in affecting variation in tool life while machining En24 steel with carbide inserts of ISO designation SPUN 120308 are: Parameter Percent Contribution on Tool
Life
Cutting speed (A) 34.89
Depth of cut (C ) 25.80
Feed (B) 8.78
2. The optimal setting of process parameters for optimal tool life are:
Parameter Optimal levels Cutting speed 2 (250 m/min) Feed 1 (0.14 mm/rev) Depth of cut 1 (0.70 mm)
3. The percent contributions of interactions between cutting speed and feed (3.78 %) , feed and depth of cut (4.38 %) , cutting speed and depth of cut (6.94 %) in affecting mean value of the tool life are relatively smaller in comparison to the main effects of the process parameters .
4. The predicted optimal range (95%CICE) of the tool life is:
• QUALITY CHARACTERISTIC : TOOL LIFE • TOOL LIFE (MIN) : ____________
• S/N DATA (dB) : --- • TYPE : HIGHER THE BETTER (HB) 16.50 -
16.00 - - 24.20 15.50 - - 23.80 15.00 - - 23.40 14.50 - - 23.00 14.00 - - 22.60 13.50 - - 22.20 13.00 - - 21.80 12.50 - - 21.40 12.00 - - 21.00 11.50 - - 20.60 11.00 - - 20.20 10.50 - - 19.80 10.00 - - 19.40 9.50 - - 19.00
A1 A2 A3 B1 B2 B3 C1 C2 C3 190 250 310 0.14 0.16 0.18 0.70 0.85 1.00
Cutting Speed Feed Depth of cut (m/min) (mm/rev) (mm) (a) (b) (c)
(Subscripts represent levels)
Fig. 2 (a, b, c) . Effects of Process Parameters on Tool Life (Raw Data) and S/N Ratio (the main effects)
TO
OL LI
FE
(MIN
)
S
/N R
A
TI
O (d
B
[image:5.612.51.448.63.572.2]520.222 176.222 356.519 63.556 72.148 109.037 2 2 2 4 4 4 260.111 88.111 178.2595 15.889 18.037 27.25925 114.23* 38.69* 78.28* 6.98* 7.92* 11.97* 515.66765 171.66765 351.96465 54.44729 63.03929 99.92829 35.84 11.93 24.46 3.78 4.38 6.94 A B C A X B B X C A X C
T e (pooled)
1438.889 141.185
80
62 2.2771774
1438.889 182.17419
100.00 12.67
SS = Sum of squares, DOF = Degrees of Freedom, V = Variance, T = Total, SS/ = pure sum of squares, P = Percent contribution, e = error, A – cutting speed, B – feed, C – Depth of cut
Tabulated F-ratio at 95% confidence level: F0.05; 2; 62 = 3.15, F0.05; 4; 62 = 2.53 * Significant at 95% confidence level.
Table IV: S/N Pooled ANOVA (Raw Data: Tool Life)
Source SS DOF V F ratio SS/ P
83.710 24.440 63.071 (8.487) (14.242) (14.971) 2 2 2 (4) (4) (4) 41.855 12.22 31.5355 - - - 15.01* 4.38* 11.31* Pooled Pooled Pooled 79.19725 19.92725 58.55825 - - - 34.89 8.78 25.80 - - - A B C A X B B X C A X C
T e (pooled)
226.972 (55.751)
26
(20) 2.78755
226.972 69.28925
100.00 30.53 Tabulated F-ratio at 95% confidence level : F0.05; 2; 20 = 3.49
References
[1] R.C. Brewer and R. Rueda., “A Simplified Approach to the Optimum Selection of Machining Parameters”, Engineers’ Digest, Vol. 24, No. 9, 1963, pp. 133-150.
[2] E.J.A. Armarego and R.H Brown,The Machining of Metals, Prentice Hall, 1969.
[3] P.G. Petropoulos, “Optimal Selection of Machining Rate Variable by Geometric Programming”, Int. J. Prod. Res., Vol. 11, No. 4, 1973, pp. 305-314. [4] R.M Sundaram,., “An Application of Goal
Programming Technique in Metal Cutting”, Int. J.
[7] H.Singh and P.Kumar, "Tool Wear Optimization in Turning Operation by Taguchi Method," Indian Journal of Engg. & Materials Sciences, Vol.11, Feb 2004, pp. 19-24.
[8] R.A.Mottram and J. WoolMan, “The Mechanical and Physical Properties of the British Standard EN Steels”, 1st Edition, Vol. 2, En-21-En-39, 1966, p. 72. [9] H. Singh, Optimization of Machining Parameters for
Turned Parts Through Taguchi’s Technique, Ph.D. Thesis, Kurukshetra University, Kurukshetra, India, 2000 .
[image:6.612.72.478.68.218.2]