713
Structural Changes and Labour Adjustments in Rural Bulgaria
prof. Plamen Mishev
† ‡, prof. Nedka Ivanova
†, dr. Christina Harisanova
††
University of National and World Economy, Department “Natural Resources
Economics
‡
Corresponding author: e-mail address [email protected]
Paper prepared for presentation at the 118
thseminar of the EAAE
(European Association of Agricultural Economists),
‘Rural development: governance, policy design and delivery’
Ljubljana, Slovenia, August 25-27, 2010
Copyright 2010 by [AUTHORS]. All rights reserved. Readers may make verbatim copies of
this document for non-commercial purposes by any means, provided that this copyright notice
appears on all such copies.
714
Abstract1
The rural areas in Bulgaria cover more then 80% of the country territory and account for about 29% of the population. Their development depends strongly on agricultural sector. The paper
examines structural changes in agriculture, labour market situation in rural areas and presents the main results of the survey performed in three region of Bulgaria.
The study shows a substantial decline in the number of farm with economic size between 0,5 and 3 ESU and a stable increase in the number of large farms. Major factors having impact on farm restructuring are: improvements in economic situation, in particular the increase in real income, positive developments of land market, deterioration of age structure of rural population and the habits of rural population to keep some agricultural activity. An important development of subsistence and semi subsistence farms is observed indicating two opposite processes: a process of transforming of a small part of semi-subsistence into commercial farms or into higher economic size group and another part of them converged to subsistence farms. The number of subsistence farms with economic size 0,5 – 1 ESU also declined as the reduction is either due to reduction of farm activity or due to exit from the sector.
The most important option for employment and source of income in villages studied is agriculture, but the earned income is much below the national average The most important factor having impact on a decision to start a job outside agriculture is “To ensure households leaving standards/ generate cash income”. Generally the respondents do not think that they will have possibility to start their self employed business outside agriculture in the next 5 years. Only 25% of them expect to stay in agriculture as nearly 50% of the commercial farms will keep operating and only 17% - 26% of small farms will remain in the sector
Key words: rural development, farm restructuring, labour market, JEL J21, R23
.
1
The paper is based on working papers analysing the influence of structural changes on small-scale agriculture and rural labour market in Bulgaria written in the framework of SCARLED project. The researches in the particular working papers are based on common methodology of project. This is the reason that in the paper are not included the issues of conceptual framework and theoretical foundation developed in work package 2 as well an explanation of samples and survey design developed in work package 4 in SCARLED project. /www.scarled.eu/
715
Introduction2
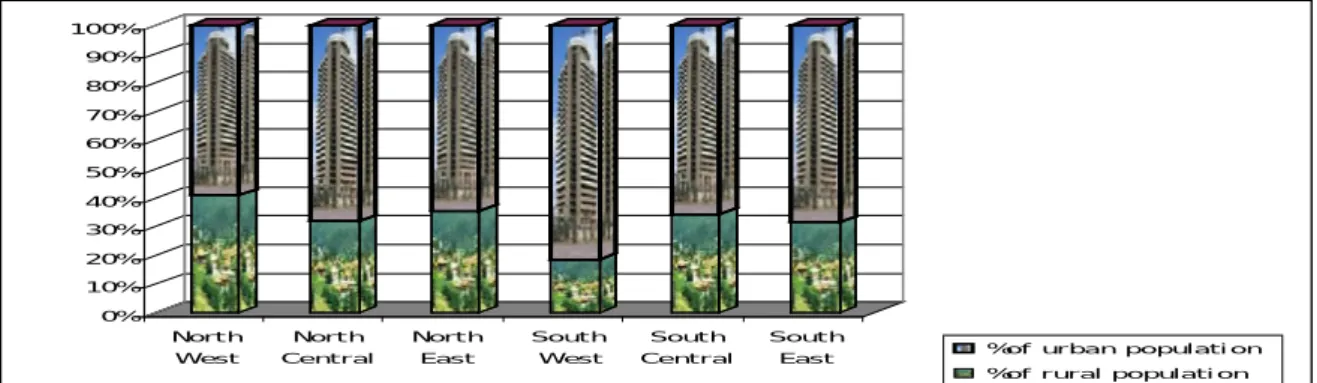
The rural areas in Bulgaria cover more then 80% of the total country area /Figure 1/ and account for about 29% /Figure 2/ of the population3. While rural areas relatively evenly allocated through the country, as Figure 2 shows, the rural population is not equally represented in the different regions of. The share of rural population is the highest in North West region /41%/ and the lowest in South West region /18%/. In other regions the share of rural population varies between 31% and 35%.The main characteristics of these areas are high unemployment rate, lower income compared to the country average, more severe negative trend in population growth than the average for the country,
unfavourable age structure of the population and undeveloped infrastructure. The development of rural areas depends strongly on agricultural sector, and in many villages agriculture is the only source of income for local people.
Source:
Figure 1 Distribution of rural and urban areas in Bulgaria according national definition by LAU 1
2The authors gratefully acknowledge the financial support of the European Community under the Sixth Framework Programme for Research, Technological Development and Demonstration Activities, for the Specific Targeted Research Project "SCARLED" SSPE-CT-2006-044201 (www.SCARLED.eu). The views expressed in this publication are the sole responsibility of the authors and do not necessarily reflect the views of the European Commission.
3According to the national definition, rural areas are municipalities (LAU1), in which no settlement has a population over 30 000 people. According to this definition, 231 municipalities in Bulgaria are classified as rural
Rural areas 231
716
0% 10% 20% 30% 40% 50% 60% 70% 80% 90% 100% North W est North Central North East South W est South Central SouthEast %of urban population %of rural population
Source NSI 2006
Figure 2 Distribution of Bulgarian population by regions
Having in mind the importance of agriculture in rural areas the paper covers the changes in farm structures and the labour market adjustments as the study is based on the survey done under
SCARLED survey.
1. Structural changes in Bulgarian agriculture
1.1 Distribution of production structures by farmed land
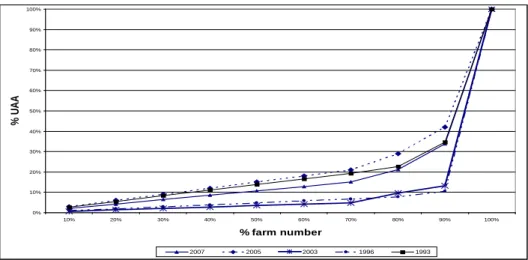
The current structures in Bulgarian agriculture are mainly a result of two major factors: the transformation of the sector in early 90s and overall economic development through the transition period and first years of accession. The transformation of the sector in early 90s is characterised by liquidation of collective farms from the socialist period, restoration of land ownership to the owners or their heirs from pre-socialist period and privatisation of all assets of coops. The result is establishing of dualistic agriculture - large market-oriented commercial farms on one hand and small-scale subsistence and semi-subsistence farming on the other (figure 3). As seen from the figure over the period up to 1996 the process of deepening the dualistic structure of Bulgarian agriculture aggravated and no much change between 1996 and 2003 appeared. But it has to be mentioned that it is quite difficult to make a direct comparison with the previous year’s farm data /in particular the number of farms/ due to the changes in the methodology for data collection. The basic difference refers to the definition of agricultural holdings thus excluding large number of small holdings from the total number of agricultural holdings. According to the adopted new methodology the census covers only agricultural holdings which correspond to the definition of agricultural holding in Bulgaria: “an independent economic unit, which: has not less than 5 dca /0.5 ha/ UAA or 3 dca /0.3 ha/ arable land;or not less than 2 dca /0.2 ha/ meadows or 1 dca /0.1 ha/ specialized crop”4.
4
717
0% 10% 20% 30% 40% 50% 60% 70% 80% 90% 100% 10% 20% 30% 40% 50% 60% 70% 80% 90% 100% % farm number % UAA 2007 2005 2003 1996 1993Source: own calculations
Figure 3 Developments of farm structure and land use
To make previous years data comparable with the new methodology the 1993 and 1996 data have to be adjusted to the 2003 methodology thus excluding farms with land less than 0,1 HA. From figure 3 it is evident that after land restitution and up to 2003 nearly 90% of farms cultivate only 10% of the agricultural land. More detailed data shows that the farms up to 0.2 ha constitute more than 50% of the total number of farms, but they operate less than 5 percents of the total arable land of the country. On the other side are the large farms /with more than 10 ha/ which are only 0.2 percent of the total number of farms but cultivate more than 65% of the land.
Keeping in mind that not all small holdings have been counted due to the methodological changes mentioned above, according to the census the number of agricultural holdings operating in Bulgaria in 2003 were 665 500. The majority of these holdings /75%/ had up to 1 ha of land, and cultivated less than 7% of the total UAA. On the other hand, only 0.6% of the holdings were larger than 100 ha, but they farmed the majority of the UAA – 75.6% of total UAA.
Over the last years the tendency of decreasing the total number of agricultural holdings in Bulgaria continued (figure 4). Comparing the data from farm structure survey in 2005 with 2003 /MAF 2003, 2005/, a substantial reduction in agricultural holdings by 20% is observed: nearly 9% withdrew from agriculture, 2% temporarily stopped operations and another 9% reduced their size below the threshold for the agricultural holdings. The analysis of the average size of farms shows that a substantial increase in the average size of farms between 5 and 10 HA appeared in 2005 comparing to 2003 (nearly by 50%). This shows some improvements in the dualistic structure of Bulgarian agriculture. The main factors behind this improvement are economic recovery, migration to towns and other EU countries, increased competition and crucial changes in food supply chain.
The 2007 agricultural census data show that the number of farm holdings in Bulgaria keeps decreasing. Between 2005 and 2007, the number of agricultural holdings dropped by another 11%. According to the census data there is also some increase in total UAA /by 5%/ which is mainly due to the expectations for CAP support.
718
665548 534600 477100 400000 450000 500000 550000 600000 650000 700000 2003 2005 2007 Source: MAF 2003, 2005, 2007Figure 4 Number of farms over the period 2003-2007
The detailed data shows that the number of small farms with less than 0,5 ha of land remained relatively constant compared to 2005 but the UAA in those holdings decreased by nearly 30%. The number of farms with less that 5 ha of UAA decreased by more than 25%, while the UAA in those holdings declined by more than 30%. At the same time the number of large farms /with more than 100 ha of land/ increased by nearly 2% while the UAA increased by 5%. As a result there is a substantial decrease in the average size of small farms by 28% and increase in the average size of large farms by 4%. Relatively stable number of small farms (with less than 0,5 HA of land) shows that the
subsistence farming is still important in the country but the drop in average size of these farms shows that from the social point of view the importance declined with the improved income situation. At the same time there is also a decline in number of farms with less than 5 HA and relatively smaller reductions in average size of those farms. These changes in the farm structures could be explained by three major factors: the improvements in economic situation in the country and in particular the increase in real income of the population, the positive developments of land market, deterioration of age structure of rural population and the habits of rural population to keep some agricultural activity. But they also show that the process of polarisation of the farm structure in the country continued. Thus after mitigation of the dualistic structure of Bulgarian agriculture between 2003 and 2005 the situation aggravated again.
The above analysis leads to the following conclusions:
• After the increase in the total number of farms as well as increase in number of small farms in the very first years of transition (1992-1993) there are constant decline till the end the observed period.
• The most substantial is decrease in the number of small farms up to 2003 even if the adjusted data due to the change in the methodology is taken into account.
• After 2005 the number of small farms remained relatively constant, although the decrease in the total number of farms.
• The average size of small farms remained relatively constant up to 2005 than declined.
• The share of large farms increased as in number of farms as well as in UAA thus making the dualistic character of Bulgarian agriculture even more severe. The only exception is the period 2003 – 2005 when there was some increase of numbers of middle-sized farms.
• The improvements in economic situation in the country and in particular the increase in real income of the population, the positive developments of land market, deterioration of age structure of rural population and the habits of rural population to keep some
agricultural activity are the main factors affecting farm structure developments.
719
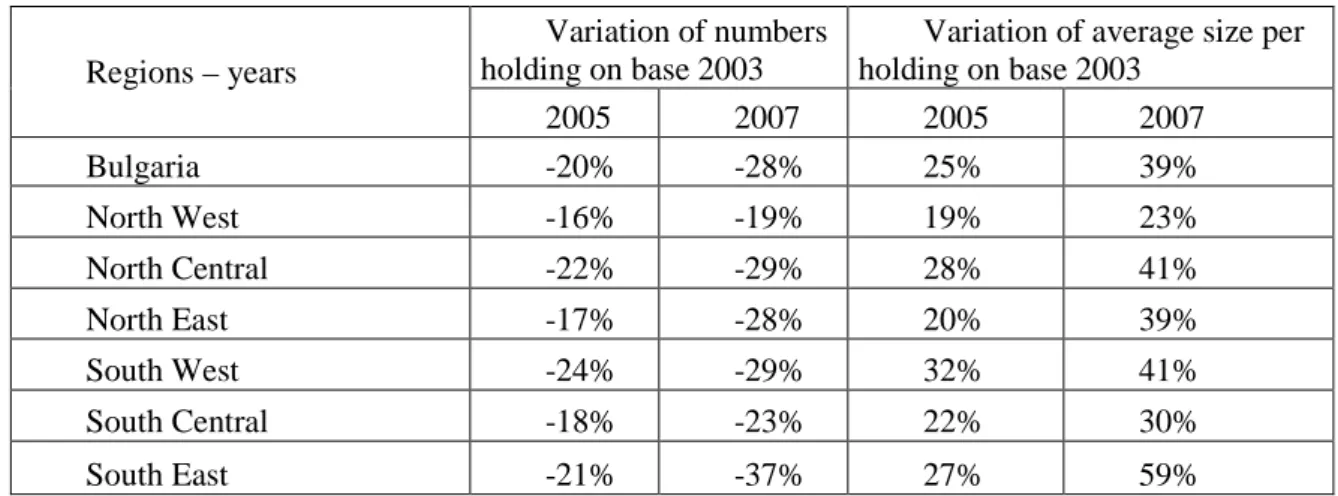
The regional distribution of farm structures are analysed since 2003 since no data are available before that year. The distribution of farms in Bulgaria by planning regions is presented in table 1. From the regional point of view the changes in the absolute number of holdings as well as their average size generally follow the changes at national level but the magnitude of changes is quite different. The figures in the table show that there are differences in the speed of the process of restructuring of the Bulgarian agriculture on a regional basis. Most substantial are the changes in the South-East region where the number of farms declined by 37%. The smallest decrease is observed in the number of farms in North-West region (less than 19%).
Table 1 Changes in the number of holdings by regions - base 2003
Regions – years
Variation of numbers holding on base 2003
Variation of average size per holding on base 2003 2005 2007 2005 2007 Bulgaria -20% -28% 25% 39% North West -16% -19% 19% 23% North Central -22% -29% 28% 41% North East -17% -28% 20% 39% South West -24% -29% 32% 41% South Central -18% -23% 22% 30% South East -21% -37% 27% 59%
Source: MAF 2003, 2005, 2008 –own calculations
In addition to the already mentioned factors having impact on farm structure at national level, the differences in the production pattern as well as in economic development of the regions are among the factors that caused the differences in the speed of the process of restructuring of farm sector in the regions. From this point of view the North-West region remains less restructured, followed by South Central region. It has also to be mentioned that while the lower economic development of North West region is the major factor affecting the low speed of restructuring in the region, in South Central region the main factor is production pattern which is dominated by fruit and vegetables. Best economic performance in South East region (with exception of Sofia city) and production pattern dominated by cereals contributed to the highest speed of restructuring in these regions.
1.3 Distribution of production structures by economic size
No data for the economic size of farm holdings are available before 2005. According to the 2005 data (Figure 5), the share of small farms with size up to 4 ESU is above 96% of the totals number of farms. Further desegregation of this group shows that 77.9% of the total number of holdings are up to 1 ESU (referred below as subsistence farms/), followed by farms having economic size 1 – 4 ESU (referred below as semi-subsistence farms) - 18,8% (Figure 5). The share of large farms in total number of farms is less than 4% (3,3%).
In 2007 some changes in the economic size structure of farms appeared. The share of large farms /with economic size above 4 economic units/ increased from 3,3% in 2005 to 4,4% in 2007, while the share of subsistence farms declined from 77,9% to 76,1%. Slight increase in the share of semi-subsistence farms is also observed (by 0,6%). Considering the relative changes of the three groups of farms it has to be taken into account that the total number of farms over this period declined
substantially. Despite the changes in the shares do not look substantial; they are much more important in absolute terms. The drop in the number of subsistence farms is 10% while the increase in number of large farms is 25%.
If more disaggregated data is considered it becomes evident that the decline in number of subsistence farms is mainly due to the reduction in number of farms with economic size between 0,5 and 1 ESU and is accounted for 17%, or more than twice higher than the reduction of farms with
720
economic size up to 0,5 ESU (7%). It has also to be mentioned that the changes in the group of semi-subsistence farms depend strongly on the economic size. While the number of farms with economic size of 4 economic units increased (by 21%), the number of farms with economic size 1 – 3 ESU declined (by 15% and 13% respectively). It has also to be taken into account that nearly 50% of the farms in this group are farms with economic size of 2 ESU and 25% of the farms – with economic size of 3 ESU.
The changes in the structure of semi-subsistence farms indicate that two opposite processes are observed: from one side a process of transforming of a small part (4,4%) of semi-subsistence into commercial farms or into higher economic size group and at the same time another part of them (7%) converged to subsistence farms. The rest part of farms in this group does not show any development, i.e. remained in this group. The number of semi-subsistence farms declined and the importance of these farms from production point of view also decreased.
2005 2007 56% 22% 9% 5% 5% 3%
0-0,5 ESU 0,5 - 1 ESU 2 ESU 3 ESU 4 ESU >4 ESU
57% 20% 9% 4% 6% 4%
0-0,5 ESU 0,5 - 1 ESU 2 ESU 3 ESU 4 ESU >4 ESU
Source: MAF 20055
Figure 5 Distribution of holdings by economical size – 2005 and 2007 , 2007
1.4 Employment and income in rural regions in Bulgaria
Over the period 2003 – 2007 substantial changes are observed in the labour force in agriculture. The number of employees in the sector shows steady reduction /Figure 6/ as by the end of the
observed period it is by 14,9% lower than at the beginning of the period. This is the same trend as the trend observed in the number of farm holdings, which means that the decrease in number of
employees in agriculture is due to the reduction in number of farms.
5
721
58 000 60 000 62 000 64 000 66 000 68 000 70 000 72 000 74 000 76 000 2003 2004 2005 2006 2007 number of emplSource: NSI year 2003-2008
Figure 6 Employees Under Labour Contract in Agriculture, hunting, forestry and fishing 2003-2007
Unemployment rate is another important indicator of labour market. Generally in the past few years the unemployment rate shows a decreasing trend as it dropped down from 13,3% in 2003 to 6,9% in 2007. But it has to be mentioned that the unemployment rate in the villages is much higher than the national average. In 2003 the unemployment rate in villages was 16,3% or by 3% higher than the national average while in 2007 it was 11,4% or 4,5% higher than the national average. Therefore although the unemployment rate in villages follows the declining trend the unemployment situation in villages improved much less than on average in the country thus increasing the differences in
unemployment rate between towns and villages. In respect to the duration of unemployment the coefficient of average unemployment expectancy in the villages is much higher than on average for the country. These changes in the labour situation in villages leads to a conclusion that the
diversification of economic activity in these regions over the period observed is quite limited thus contributing to the importance of agriculture in rural regions.
The income in the agricultural sector in Bulgaria has been one of the lowest compared to the other sectors of the economy over the period of observation. The annual average wages in different economic sectors are shown in Table 2. As seen from the table generally the agricultural income is about 26% - 30% lower than the average in the country /Table 2/.
The price of labour per hour in the agriculture is also among the lowest in the economy and is by 35% lower than the national average. The analysis of the agricultural sector salaries in nominal term shows an increasing trend over the last few years /figure 7/ as the increase is 49,7% but it is lower than on average for the economy (57,7%). Because of that it remains among the lowest in the economy as the difference in salaries in agriculture and on average for the economy increased.
Table 2 Average Annual Wages and Salaries of the Employees under Labour Contract by Some Economic Activity Groupings in 2006
Economic activity groupings in BGN(leva)
2003 2005 2006 2007
Total 3280 3885 4 324 5174
Agriculture, hunting, forestry and fishing 2424 2803 3 046 3629
Manufacturing 2935 3474 3 844 4708
Construction 2788 3210 3 577 4348
722
and household goods
Hotels and restaurants 1948 2429 2 668 3495
Transport, storage and communication 4108 4772 5 314 6597 Real estate, renting and business activities 2985 3891 4 662 5115 Public administration; compulsory social
security 5182 5737 6 368
7644
Education 3567 4068 4 544 5186
Health and social work 3567 4543 4 687 5487
Other community, social and personal service
activities 2324 2912 3 330 4161 Source: NSI 2007 3 280 3 509 3 885 4 324 5 167 3629 3 046 2 803 2 589 2 424 1 500 2 000 2 500 3 000 3 500 4 000 4 500 5 000 5 500 2003 2004 2005 2006 2007
average annual wages in agriculture, hunting, forestry and fishing average annual wages in all sectors
BGN
years
Source: NSI 2003-2007
Figure 7 Average Annual Wages and Salaries of the Employees under Labour Contract Agriculture
According to the above analysis the following conclusions could be drown:
• The number of employees in the sector over the analysed period declined, as this is mainly the result of the observed structural changes in the sector.
• The unemployment rate in the villages is higher than at national level. Having in mind the decreasing trend in number of employees in the sector /the major economic activity in villages/ this could make the labour situation in rural regions even more difficult.
• The income in agricultural sector is one of the lowest compared to income in the other sectors of Bulgarian economy, and although the wages increased annually between 6% /2003/2004/ and 11% /2006/2007/ the difference between the wages in agriculture and on average for the economy became larger.
2. Farm structure and labour market of casestudy regions and their possible development
1.5 Basic characteristic of villages covered by the SCARLED survey
More detailed analysis of farm structure and labour market as well as their possible development is carried out on the basis of the results from survey done within the framework of European project Structural Change in Agriculture and Rural Livelihoods /SCARLED/ in the period end of 2007/2008.
723
Table 3 Basic characteristics of survey regions and districts in Bulgaria Districts /NUTS 3/ Area - sq.km Population density - persons/sq.km Towns - number Villages - number Degree of economic development Veliko Tarnovo 4661,6 60,8 14 322 Average Pazardzhik 4456,9 66,8 13 104 Lagging behind Burgas 7748,1 54,0 17 240 Prosperous Source: NSI 2006
In each of the selected districts 3 villages were selected. The basic economic and social indicators of the villages observed as well as the employment opportunity in them as described by mayors interviewed are as follow:
Gelemenovo village is situated near the Thrakia highway, the longest one in Bulgaria, and 5 km away from the district town Pazardzhik. The population is 790 inhabits /2006/, which is by 10% less than in 2003. The major economic activity is agriculture (crops and livestock breeding). Untill 1990 the village was known as a rice growing centre, but now rice growing no longer exist at all. The main reason for closing down the rice growing, by opinion of interviewed, is that this activity is unprofitable /due to the high price of water and for maintaining the irrigation canals/. Out of agricultural sector the people are working in the near town Pazarzhik. The people are involved also in seasonal work in agricultural activities. The unemployment rate is 6.5% /2006/ but in 2003 this number was higher. The seasonal workers programs in the village are the main reason for decreasing unemployment rate is . The perception of employment opportunities is pessimistic. The annual income per capita is 1500 leva(Scarled database) which is much lower then the minimal salary in Bulgaria/2880 leva in 2006/.
The town of Kostandovo is also situated in Rodopi mountain, Pazardzik district . The population is 4780 inhabits /2006/, or 10 people more compared to 2003. The unemployment rate is lower than the average for the region and the average income per capita is about 3500 /2006/ (Scarled database) leva per year or by 20% higher than the minimum salary in Bulgaria. The major activities are small craftsmanship /mainly in wood processing sector/ and livestock breeding. Vegetables are not traditional sector in this kind of villages and towns because they are mountainous and their natural conditions are suitable for growing only potatoes.
The village of Dorkovo is situated near to Kostandovo. The population counts 2091
persons/2006/ which is by 11% lower compared to 2003. There is strong migration from the village. This can be explained by the limited job opportunity in the village . The agriculture and in particular milk production is the main economic activity in the village. Four milk collection stations are situated in the village.
Krumovo Gradishte is part of Burgas district. In 2003 the population was 750 inhabitants, but in the following few years it decreased to 440 /2006/. The lack of employment opportunities and the lower level of income in 2003 are the main reasons for migration. As a result a large number of unemployed people and their families left the village. The rest of the households which continue to live in the village are mostly big farmers. By the end of the period the major employment is in the agricultural sector. The people involved in farm activities were better-off compared to those not involved in the sector. The farms are large and profitable. The annual income per capita is 6 500 /2006/ leva (Scarled database) which is higher than the national average. The unemployment rate is 2% - much lower than the average for the region. This can be explained with the migration in the
724
previous period, and now in the village there is almost no unemployment. Those who refuse to migrate are well situated in the village and they have mostly profitable farms. Outside the agricultural sector the people work in the construction sector. In the village are operating two cooperatives. One of them has a large tractor park station and fodder station.
Egzarh Antimovo is one of the biggest village /by population/ in the district of Burgas. The population is 1162 /2006/, but in 2003 it was 1312 inhabitants. The unemployment rate is 10%/2006/ nearly twice higher than for the region. The reason of this high unemployment rate is the liquidation of almost all firms and cooperatives in the village /TPK Chernomorska, TPK Nov Jivot, bakery/ which provided jobs for more than 500 people. Now the total number of workers in those enterprises is only 50 employees The average annual income in the village per capita is 3000 /2006/leva (Scarled
database) . The agricultural sector is well developed including plant growing and live stock breading. Survey data shows that the presence of high percentage of gypsies population in the village which favours the development of the agricultural sector as they are presented as cheap labour. Moreover they have small plots of land in addition to raise crops for their own consumption. Gypsies can be defined as subsistence farmers.
Nevestino has 506 people in 2006, which is by 5% lower than 2003. The main reason for the decrease in population is the unfavourable age structure of the population. The unemployment rate is about 2%, but it has to be mentioned that the largest part of people living in the village are in pension age and the share of working age people is very low The only one economic activity in the village is agriculture. There is one agricultural cooperative Nadejda in the village, with about 200 employees. The average annual income per capita is much lower than the minimum salary in the country /1200 leva compared to 2880 leva/. Because in the village is observed lack of employment except in the cooperative, where the salaries are very low, the people are developing their own farms.
The village of Nedan is situated in Veliko Tarnovo district in North Central region. The
population is 1560 /2006/ villagers which is much lower than in 2003 /1800 people/. Unemployment rate is 4% /2006/, and the annual average income per capita is 1200 leva /2006/. The agricultural sector and in particular the livestock sector provide the main employment. The farms specialise in poultry and pig breeding.
Karajesen is situated in Veliko Tarnovo district in North Central region. The population is 1463 /2006/ or by 13% lower than in 2003. The decline in population can be explained mainly by the migration particularly of young people. They migrated because in the village is observed lack of employment. The second reason for decreasing population is unfavourable age structure of the
population. The average annual income per year is 2400 leva /2006/. In the village the unemployment rate is very high, about 12% /2006/. After 1990 many of the firms and cooperatives in the village were liquidated. There is a wine factory which relies on grapes from other regions and does not support vineyards. According to the respondent the grape price offered by the local winery is low and
producers prefer to sell their output to middlemen. There is one cooperative Vazrajdane in the village with about 200 seasonal workers per year.
Morava has a population of 2300 inhabitants /2006/ while in 2003 the population were 2450. The unemployment rate is about 2% /2006/ and the annual income per capita is about 4800 leva /2006/ or nearly twice higher than the minimum income in the country. A few tailor workshops and a canning factory are the main enterprises providing job opportunities.
Conclusions that could be drown from the analysis of the labour situation in the surveyed villages could be summarised as follows:
• There is a negative population growth in all surveyed regions with only one exception – Kostandovo.
• The unemployment rate practically in all regions is low but it has to be taken into account that the share of people in working age is relatively low.
• The main activity in all observed villages is agriculture. In some of them there are other job opportunity /wood processing, canning industry, transport, trade, etc./ but in general other jobs opportunities are limited. This is one of the main reasons for the lower income outside the agriculture and also for the migration particularly of the young people.
• The farms in the surveyed villages are mixed crop and livestock farms. Specialised farms were encountered only in Kostandovo where the stock breading is well represented.
725
1.6 Analysis of labour market and farming activities of rural households in the surveyed regions
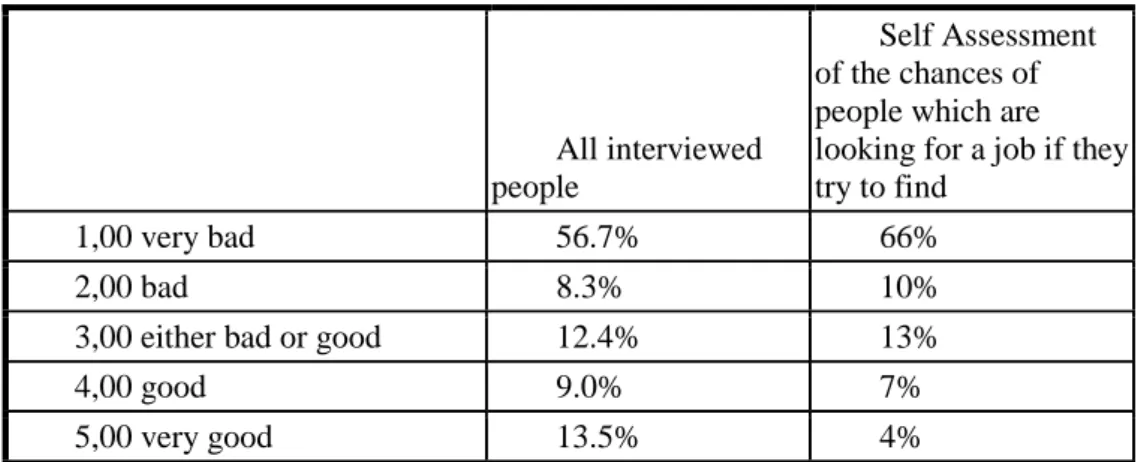
The average size of the interviewed households is 3.5 members. 30% of the households interviewed are of size of 2 members (generally pensioners), and another 6.3% - with only one member (again generally pensioners). The analysis of the age structure of interviewed household shows that 2/3 of all household members are in the group of the active population (16 – 65 years). The rest 1/3 is almost equally divided between children and elders. 21% of these people which are on age 16 -65 pointed out agricultural activate as their main activity. Others are involved in a variety of activities, as wage jobs, own non agricultural business, self employers. People who are older than 15 years estimate their possibility /table 4/ to find a job in a local labour market as follow:
Table 4 Estimation of the possibility to find a job in a local labour market
All interviewed people
Self Assessment of the chances of people which are looking for a job if they try to find
1,00 very bad 56.7% 66%
2,00 bad 8.3% 10%
3,00 either bad or good 12.4% 13%
4,00 good 9.0% 7%
5,00 very good 13.5% 4%
Source: SCARLED database
From table 4 it is evident that more than 50% of the people considered the opportunity to find a suitable job in the place of living as very bad /according to their education and desired salary/. Only 13,5% evaluate the possibility to find an employment as a very good. Having in mind that only 10% of all household members interviewed are really looking for another or a new job these results should be considered with caution because the opinion of people not looking for a job could be misleading. This is proved by analysis of the answers of people looking for a job only. More than ¾ of them considered their opportunity to find a job on a local marker as vary bad or bad and only 11% of them – as good or very good. These results are quite indicative. They not only proved the conclusion mentioned above that diversification of economic activity in rural areas is limited but also that diversification should be one of the main priorities of the agricultural policy.
According to the data from the field survey in Bulgaria only 3% of interviewed households point out that they started their agricultural activities after 2003. According the results /Figure 8/ the most important factor having impact on decision to star farming is to secure food provision for the
household members, followed by the internal preferences of households to be involved in agriculture. Factors as recently acquired land, or moved to the village did not influence the decision to run agricultural activities.
726
2,57 2,14 2,71 2,71 4,43 3,86 3,43 4,29 1,00 1,50 2,00 2,50 3,00 3,50 4,00 4,50Recently moved to the village Recently acquired land Retired from another job Was made redundant on previous job To secure food provision for the household To generate income To capture CAP payments Desire to engage in agriculture
Not Important Minor importance Moderate importance Major importance Most important NA
(1) (2) (3) (4) (5) (6)
Source: SCARLED database
Figure 8 Main factors having impact on decision to run agricultural activities6
Due to the importance of farm activity in the studied regions the expectations of households for the next few years are analysed. The household expectations for the future are shown in Figure 9.
As seen from the figure, almost 1/3 of the household heads expect to stop the agricultural activity in 5 year and to retire. Only 20% of interviewed expect to stay in farming as full time farmers, and 5% of them as part time farmers. Another 20% expect to work in a local wage job and 7% as self employed person. More detailed data shows that the majority of people in working age intend to migrate either to towns or abroad. Very few of them see their future as farmers. High is the percentage also from the people in the age group 36-50 who intend to migrate to towns. Having in mind the unfavourable current age structure of the interviewed people (1/3 pensioners) and the percentage of people that expect to migrate (particularly people in working age) it could be expected the declining trend of the population of rural areas will continue.
20% 5% 20% 2% 2% 7% 1% 32% 4% 6% 0% 5% 10% 15% 20% 25% 30% 35%
working as a full time farmer part time farming working in a local wage job migrated to town migrated abroad self-employed homework/carring for household retired unemployment don’t'know
Source: SCARLED database
Figure 9 Expectations for development of household heads after 5 year based on household head expectations
Having in mind the low level of diversification of economic activity in rural areas it is important to know which factors have impact on the decision to have a job outside the sectors. These factors are shown in Figure 10.
6
727
4,65 3,08 2,38 2,68 2,54 3,30 2,29 3,96 0,00 0,50 1,00 1,50 2,00 2,50 3,00 3,50 4,00 4,50 5,00 To ens ur e t he ho us eho lds liv ing stan dar d/ ge ne rat e ca sh in co me T o us e t he ho us eho ld’ s eco no mi c ca pa cit y m os t ef fec tiv e/ pr od uc tiv e T o g en er at e i nc om e to in ve st in ag ricu ltu re /f am ily bus ine ss T o g en er at e i nc om e t o inv es t i n p er so na l dev elo pm en t/ ed uc at ion Pr es tig e o f no n-fa rm wo rk , i nc re as e o f s oc ial sta tu s T o s mo ot h i nc om e/ uns ta ble re tur ns to ag ricu ltu re La ck of on -fa rm emp loy me nt Pr ef er w ag e emp loy me ntNot Important Minor importance Moderate importance Major importance Most important
(1) (2) (3) (4) (5)
Source: SCARLED database
Figure 10 Factors behind the decision of the household heads to work in wage employment (based on interviews with household heads)
The most important factor behind the decision to have a job outside agriculture is “To ensure the household living standard / generate cash income”, followed by “Preferred employment”. All other factors are between 3.3 and 2 which means they are of moderate or minor importance for the decision to have a job as wage employed. This again shows the crucial importance of measures for creating non-agricultural businesses in rural areas and improvement of attractiveness of the villages as place for living.
3. Conclusions
The agricultural sector is the main economic activity in rural regions in Bulgaria and because of the restructuring of the sectors is of biggest importance for the rural population. The study shows a declining trend in the farm number, as the biggest decline is observed in number of farm between 0,5 and 3 ESU as at the same time there is a stable increasing trend in the number of large farms. The speed of restructuring of the sector differs by regions. Among the main factors having impact on the process of restructuring are: improvements in economic situation in the country and in particular the increase in real income of the population, the positive developments of land market, deterioration of age structure of rural population and the habits of rural population to keep some agricultural activity. The observed differences in farm restructuring by regions are mainly due to the differences in the production pattern as well as in economic development.
The study shows the important role of the subsistence and semi- subsistence farms in the country. The changes in the structure of semi-subsistence farms indicate that two opposite processes are
observed: from one side a process of transforming of a small part (4,4%) of semi-subsistence into commercial farms or into higher economic size group and at the same time another part of them (7%) converged to subsistence farms. The rest part of farms in this group does not show any development, i.e. remained in this group. The number of subsistence farms with economic size 0,5 – 1 ESU also declined as the analysis shows that this reduction is either due to reduction of farm activity or due to exit from the sector. This process makes the dualistic character of Bulgarian agriculture even more severe but at the same time show that the importance of subsistence farms declined.
The income of people involved in agriculture is by 20-30% below the national average and although the increase observed in last years by the end of the period of analysis the difference between the wages in agriculture and on average for the economy became larger. Both, unfavourable income situation and the process of restructuring of the sector have led to a reduction in number of employees in the sector thus making the labour situation in rural regions even more severe.
728
In all villages surveyed farming is still the most important option for employment. In some villages there are agricultural production cooperatives and small processing units, but they can not offer jobs to all potential employees and self-employment in small farms /subsistence and semi-subsistence/ is of crucial importance. The most important source of income in the surveyed rural regions is agriculture, but the earned income is insufficient and it is a common that at least some of the members in the family are pushed to look for jobs outside the village.
The sectoral study and the survey revealed that unemployment rate in the villages are higher than at the national level. Although the unemployment rate declined in all regions it is quite different among the villages. Substantial diversities between the villages are observed also in income, job opportunities, age structure, etc. Still the main activity in all observed villages and small towns is agriculture. The limited jobs opportunities in the villages as well as search for better jobs and higher living standard is the main reason for migration out of the rural regions especially of young people and negative population growth in practically all the regions.