Benchmarking IT Benefits: Exploring Outcome- and
Process-based Approaches
Egon Berghout
University of Groningen
[email protected]
Peter Schuurman
University of Groningen
[email protected]
Diderik van Wingerden
M&I/Partners
[email protected]
ABSTRACTBenefits are indissolubly associated to cost, as specific cost levels will always raise questions regarding the accompanying benefit levels. Contrary to cost benchmarking, the benchmarking of benefits, and especially the benefit constituents which should be measured, seem hardly developed. This study presents the IT benchmarking of housing associations over a period of seven years. Although cost measurements appeared relatively stable, benefit measurements evolved significantly. A
process- and outcome-based measurement methodology is defined to improve our understanding of benchmarking and benefits benchmarking in particular. Differences between and the experiences with the outcome- and process-based approaches are described and analyzed. Results indicate the outcome-based approach to be preferred for cost benchmarking, however, the application of this approach on the measurement of benefits caused numerous problems. In this regard, most organizations seem unable to provide the required data and prefer the process-based approach.
Keywords
Benchmarking, IT benefits, process-based, outcome-based.
INTRODUCTION
Benchmarking considers a process of comparing measurement output of one or several aspects of multiple organizations in order to objectively find so-called “best practices” intended to support continual organizational improvement (Lynch and Cross, 1995; McNair and Leibfried, 1992). From an economic viewpoint, the benchmarking of information systems (IS) has a long-standing relationship with the assessment of IT costs (Compass, 1997; Redman, Kirwin and Berg, 1998). In this relationship both aspects provide a frame of reference for the other. Counter intuitively, high cost levels might, for instance, indicate highly effective use of IT, and low cost levels can indicate many unnoticed IT opportunities. Therefore, cost and benefits are preferably combined in a single benchmark. There seems to be relative consensus around the cost constituents. Generic cost categories are for instance provided by established cost of ownership items (Smith, Schuff and Louis, 2002, among others). However, there is much more debate on the benefit items; both in academics (Remenyi and Sherwood-Smith, 1998; Thorp, 1998; Ward and Daniel, 2006) and practice (McDonald, 2006; Redman et al., 1998). This paper reports findings from the development of a joined cost and benefits benchmark for housing associations over a period of seven years. The benchmarking and consultancy organization M&I/Partners also performs other industry specific benchmarks for hospitals and for municipalities, but the housing associations benchmark is the most thoroughly developed benchmark.
For organizations, benchmarks provide most value when cost and benefits are jointly assessed and compared. Surveying the current body of knowledge, it can be concluded that the problems with evaluation of the two are different. Where the evaluation of cost struggles with relative objective issues such as addressing the right cost drivers and determining acceptable levels of costs, the assessment of benefits has not similarly progressed from the more subjective identification area. Benefits and costs thus appear to have a different ‘denominator’, making them difficult to combine in a single evaluation in their current form. In this paper it is therefore argued that serious difficulties in benchmarking arise due to a difference in nature between these positive and negative consequences. Based on a literature review, the sources of the complications are discussed and alternative solutions reflected. Next, a benchmark containing cost as well as benefit elements is developed and empirically tested in the case study. Results indicate the process-based approach to be an essential addition to the outcome-based view.
The paper is organized as follows. In the next section, the notion of benefits benchmarking is elaborated upon. First, we will introduce the distinction between the process-based approach to benefits benchmarking and the outcome-based approach. Subsequently, we reflect to the foundations of costs and benefits evaluation to identify how the process- and outcome-based
approaches can be effected. The section ends with the design choices for a benefits benchmarking method. The third section covers the development and description of the benchmarking model. Subsequently, its empirical validation is addressed by means of the case study. The final section concludes with a discussion of the findings as well as the implications for future research.
BENCHMARKING BENEFITS
Throughout the development of a benchmark initiative design choices have to be taken. At a strategic level these choices comprise of determining the benchmark purpose, varying from reactive management to continuous improvement, and setting the target organizations, ranging from benchmarking against oneself to organization in different industries. Depending on the goal of a benchmark initiative, its focus, the organizational context and available means, an organization has to choose which one of many varieties of benchmarking will best fit the situation; possible options include the internal, competitive, functional, and generic process benchmarks (Camp, 1995; Zairi and Leonard, 1994). Regardless of the strategic choice, additional operational design decisions have to be made considering the attributes to be reflected. It has been argued that these attributes need to include both outcome-based and process-based approaches (Doll, Deng and Scazzero, 2003; Hinton, Francis and Holloway, 2000). Outcome-based attributes focus on the measures of effectiveness, whereas the process-based approaches consider the activities resulting in these outcomes. The process-based approach builds upon the notion that certain conditions have to be met, even though they are by no means sufficient for the sure creation of the outcomes (Markus and Robey, 1988; Mohr, 1982). This distinction is similar to software quality management techniques, where several techniques focus on quality characteristics of software (Boehm, 1978; ISO/IEC, 1994; McCall, Richards and Walters, 1977) and other techniques focus on improving the software development process (Bicego, Koch, Krzanik, Kuvaja, Saukkonen and Similä, 1994; Pfleeger, 1991). Eventually, the two approaches will come together, as advanced software development processes will produce high quality software and vice versa.
As identified in the previous section, several problems arise when considering the measurement of IS costs and benefits for benchmarking purposes. It is argued here that these issues stem from large differences in the level to which costs and benefits are established in the field of IS economics. After identifying these differences, it is elaborated upon how taking the combined outcome/process-based approach can overcome these dissimilarities and enable the benchmarking of not only costs, but also benefits.
On the one hand, the evaluation of costs has a dominant financial orientation in IS literature (e.g. Irani, Ghoneim and Love, 2006). IS costs can occur as a consequence of having the system, due to use of the system and as a result of the processes supplying the system. Full cost are hard to measure (Alshawi, Irani and Baldwin, 2003), a problem with identifying IS costs concerns which costs to include – costs for user training may be an IS cost category, but might also be hidden within the business. As IS costs are partially caused by the business, the IS provider is unable to control them; therefore an organization needs to have agreed processes on the allocation and measurement of IS costs. It is then possible to create insights into IS cost behaviour and manage and control them. It is these objectives that eventually determine the purposes of identifying IS costs. Little attention is paid to the so-called negative contributions, that is the non-financial burdens, of IS.
Being well established and highly financially-oriented, various methods for accounting for the costs of IS exist to support benchmarking. Methods such as Activity Based Costing are based on standard accounting approaches, and therefore, from a benchmarking viewpoint, it could be argued that cost management creates a relatively objective and comparable foundation – though it will depend on the quality of the data, the quality of the costing system and of the quality of the output or signals the system produces. Nonetheless, it is hoped that by careful cost categorization all sources of cost can be identified, and quantified, in a reasonably robust manner, enabling high quality benchmarks. For cost benchmarking, the outcome-based approach focuses on the measurement of actual costs and efficiencies, where the process-based approach focuses on measuring the internal control systems, possibly including compliance with generally accepted accounting practices (Power, 1997).
The emphasis in IS benefits assessments, on the other hand, lies heavily on non-financial aspects (e.g. Love, Irani, Standing, Lin, and Burn, 2005). IS are seen to positively contribute to the organization in three ways; (1) by facilitation things to be done which could not be done before, (2) by improving the things already done, and (3) by enabling the organization to cease activities that are no longer needed (Ward and Daniel, 2006). These benefits can only be established if the organization uses the functionalities possessed by its information systems (Tiernan and Peppard, 2004). Problems arise with the measurement, allocation, and management of benefits. The lack of a workable definition for setting the boundaries of IS leaves the allocation of benefits to IS seemingly impossible. The intangibility of benefits confirms this impression. In addition, information is pervasive within the business and change will undoubtedly lead to indirect effects. Identifying all direct and some indirect effects is a challenge when trying to create an overview of benefits to internally benchmark a portfolio of potential changes or investments. As boundaries fade after implementation, the identification of the contribution of
operational IS in the current business environment becomes even more problematic, making an external focused benchmark of IS benefits even more complicated. Active benefits recognition is needed to raise the benchmarking from measuring inputs and outcomes to organizational improvement (Alshawi et al., 2003).
When pursuing the benchmark of IS benefits, no such established and accepted foundation as the one in place for cost measurement can be build upon. Resulting problems are caused by similar issues as the ones involved with benefits realization problems. Benefits seldom occur automatically and their realization is, therefore, an essential part of (IT) management. Additionally, benefits are relative to industry performance. Strategic advantage is often eroded by similar initiatives by competitors, therefore IT initiatives are seldom a source of sustainable strategic advantage on their own. Ultimately, the value added through these investments is transferred to the customers. For these kind of positive
consequences, especially outcome-based, benchmarking will thus show no added value in the end. The outcome-based approach can however prove to be valuable for measuring temporary, possibly intermediate, benefit attributes.
As cost management principles created the foundation of IS costs benchmarks, benefit management principles should become the building blocks for a to-be established foundation of benefit measurement. In this function it could espouse the enablement of benchmarking IT benefits. However, many benefits management techniques exist and their number and diversity is an indication of how difficult it is to assess the value of IS benefits. Well known methods include the Active Benefits Realization approach (Remenyi, Sherwood-Smith and White, 1997), Val IT (ISACA, 2007), the Benefits Management Approach (Ward and Daniel, 2006), and the Benefit Realization Approach (Thorp, 1998). Distinguishing the outcome-based and process-based approaches to measuring attributes in benchmarking, it can be seen that the benefit management methods measure benefits in these two distinct ways. First, benefits are measured as such. Estimates are made of the causal relation between positive effects and IT. Thorp, for instance, obtains data on known driving variables, such as revenue, sales volumes, and the customer base. Second, benefit generating processes are elaborated upon. Benefits are not measured as such, however, the fact that a certain benefit generating process is in place at least provides the necessary precautionary conditions for benefits to potentially occur. This is, for example, established by the validation of result chains (Thorp, 1998) and benefits dependency networks (Ward and Daniel, 2006).
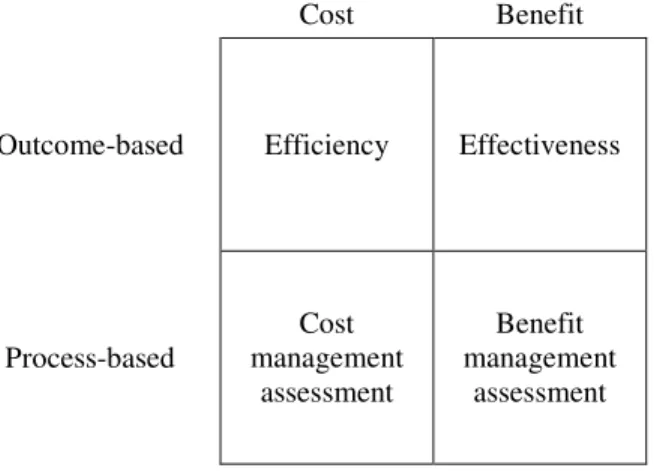
Cost Benefit
Outcome-based Efficiency Effectiveness
Process-based Cost management assessment Benefit management assessment Figure 1. Framework of benchmark approaches
The preceding analysis can be recapitulated to the overall framework of benchmark approaches as presented in Figure 1. Benchmark studies almost always focus on efficiency levels, the outcome-based approach to costs, and, as will be shown in the case study presented in this paper, there are hardly questions about the process-based assessment of cost management activities. This effect can be explained by the high level of mutual understanding of costs. For benefits, the outcome-based attributes measure effectiveness provided by IS, whereas the process-based ones show long-term issues by assessing the benefit management systems in place. In addition, the insights provided by the process-based approach might support benchmarking participants to cope with one of the major issues in benchmarking, the transfer of knowledge gained to one’s own organization (Zairi and Ahmed, 1999). Therefore, taking a joined outcome/process-based approach for the benefits element is essential to explain differences in cost levels and value provision. How the joined approach can be incorporated in practice is shown in the next section.
EMPIRICAL RESULTS
In this section the benchmarking study of housing associations is described. First, the benchmarking process is introduced, followed by a description of how the benchmarking model evolved from being basically cost oriented, to also include, first, outcome-based benefits constituents and, second, process-based benefits constituents.
The benchmark has been performed for seven consecutive years, since 2002. The research presented in this paper concerns the last three years, during which the benchmarking organization and the 38 participating housing associations try to identify benefit constituents. The benchmark is developed and maintained by consultancy company M&I/Partners, having a well established benchmarking practice and also performing yearly benchmarking studies for municipalities and hospitals. The benchmark process is organized as follows. Participating organizations gather their own data, which is then validated by M&I/Partners’ experts. Depending on the bookkeeping quality and the accumulated level of experience, this data gathering takes three to six working days. All gathered data is then processed and the results are presented in elaborated standard reports for each organization. The benchmark also includes an interactive session in which all participating organizations meet and discuss the (causes of the) various differences. The benchmark is an important platform for participants to develop and discuss IT-related best practices for their line of business.
The benchmarking model originates from a Total Cost of Ownership (TCO) based benchmark of IS costs (Treacy, 1989). The TCO model covers six major IS cost categories; these are IT management, applications, work stations, wide and local area networks (WAN and LAN), and voice technology. The housing associations are compared by dividing the overall cost to the number of ‘rentable units’. The IS cost levels per rentable unit for each of the 38 housing associations are represented in Figure 2.
From the very beginning, this aspect of the benchmark has been experienced as well developed. Frequently, organizations even adapt their bookkeeping standards to fit the cost constituents of the benchmarking model. Over time, only minor changes have been made to the TCO model and its application in other industries requires hardly any adjustments. These indications support the earlier findings that the foundations for benchmarking IS costs are firmly established.
IS c o st s p er r en ta b le u n it $-$20 $40 $60 $80 $100 $120 $140 $160 $180 $200 1 2 3 4 5 6 7 8 9 10 11 12 13 14 15 16 17 18 19 20 21 22 23 24 25 26 27 28 29 30 31 32 33 34 35 36 37 38 Speech Apps WAN LAN Workstation IT management Housing associations
Figure 2. IS costs per rentable unit for 38 housing associations
Figure 2, together with the other figures in the benchmark report, provides the participants with new insights into the performance of their organization. This point is emphasized by participants regularly making statement such as “It creates an awareness of certain cost components.” and “It helps our clients better argue decisions regarding investments.”
As participants became more experienced with the use of these cost models, they began investigating various reasons to explain the differences between organizations. Aspects such as IS functionality, quality, maturity of the IT organization, the number of offices and certain technical and organizational choices were put forward. All in all, the yearly returning ‘hot topic’ in the interactive sessions is the question for measuring IS benefits. As commented on by participants: “Now I know the costs, but what are the benefits?” and “How much value do we get from our IT?” Organizations that, for example, might appear to be expensive, could provide valuable additional functionality. Whereas other, seemingly more cost efficient, organizations might lose out on the benefits.
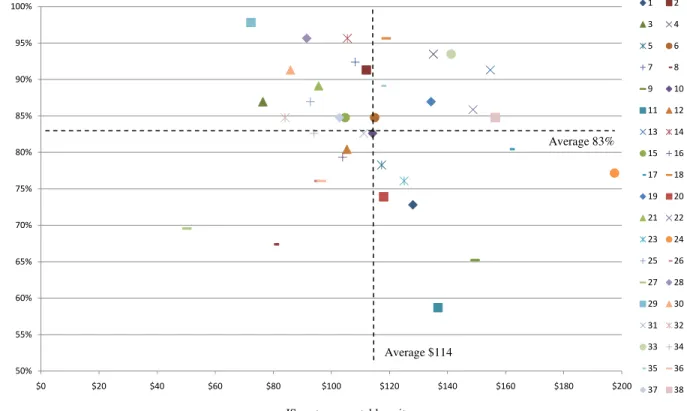
In the first year of the study, an outcome-based approach enabled the benchmarking of benefits by measuring the implemented level of IS functionality in each housing association against a predefined set of typical IS functionalities. This set contains both generic functionalities found in each typical larger organization, such as Customer Relationship Management (CRM), intranet and workflow management, and functionalities particular to the industry, such as maintenance and renovation support, strategic construction management and treasury. The underlying assumption is that when employees have more functionality available, they will also create more (IS-based) benefits for the organization.
Participants score each typical functionality as (0) when no specific IS is present (1) when an IS is present, but is still under development or (2) when an IS is in use. Together with an appropriate weight factor for each type of functionality, this results in a total functionality score (reported as a percentage). The overall functionality score associated to the overall IS cost per rentable unit is illustrated in Figure 3. The numbers 1 to 38 correspond to the same numbers in Figure 2.
Housing associations IS f u n ct io n al it y s co re 50% 55% 60% 65% 70% 75% 80% 85% 90% 95% 100% $0 $20 $40 $60 $80 $100 $120 $140 $160 $180 $200 1 2 3 4 5 6 7 8 9 10 11 12 13 14 15 16 17 18 19 20 21 22 23 24 25 26 27 28 29 30 31 32 33 34 35 36 37 38
IS costs per rentable unit
Figure 3. IS functionality score vs. IS cost per rentable unit, for 38 housing associations
The individual benchmark reports also contain more detailed figures for each functionality. The measurements provide insight into the current coverage of functionality, the functionalities housing associations are working on and an explanation for differences between IS cost levels. This implies that, although there is hardly a statistical significant trend in Figure 3, the data does provide ample information for individual organizations. Their position in Figure 3 provides an indication how much functionality the IT department is supporting, given a particular cost level. The more expensive IT organizations are hardly supporting additional services.
Having experienced the measurement of IS functionality, participants stressed another important factor influencing IS benefits and variations in costs levels: the quality aspect of functionality provided. When providing a higher level of quality for the same functionality, higher costs would be justified and vice versa. M&I/Partners investigated several opportunities and concluded that measuring the various aspects of quality for all functionalities in an outcome-based approach would be far too complex. This would for instance include identifying relevant quality aspects of an IS, such as scalability, usability, security, robustness, data integrity, work process support, quality of procedures and manuals, technical quality, adherence to standards and measuring all those aspects for every IS in each housing association.
Therefore, in the second year of our study a process-based approach was selected: the measurement of IT process maturity. The assumption is that a higher level of organizational process quality (commonly referred to as process maturity) leads to a higher quality of IS and consequently more IS benefits (DeLone and McLean, 2003; Byrd, Thrasher, Lang, and Davidson,
Average 83%
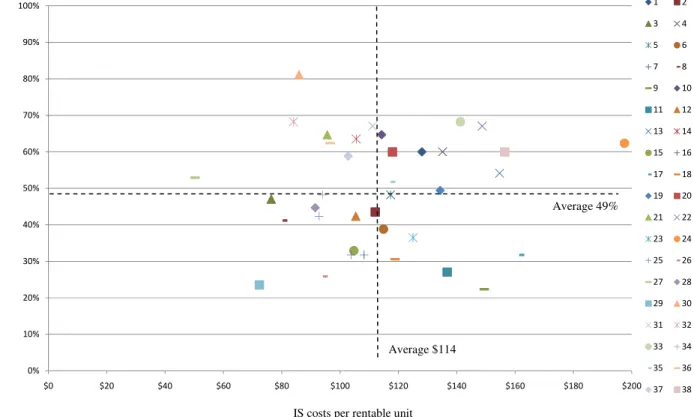
2006). Using CobiT (ISACA, 2009) as a starting point, the IT process maturity measurement was established. Since all participating housing associations are represented by their IT managers and keeping the level of detail manageable has been a major concern of the benchmark model from the beginning, the main focus was put on CobiT’s Delivery and Support (DS) processes. In addition, the generic qualitative maturity scale was used. Currently, the measurement contains seventeen processes; these include, define and manage service levels (DS1), educate and train users (DS7) and manage problems (DS10). The maturity scale ranges from non-existent (0) to optimized (5), each with an extensive definition used as reference. Participants score each process four times on the maturity scale, (1) for current formal set-up, (2) for current actual working, (3) for next year’s ambition and (4) for long-term ambition. The result is illustrated in Figure 4, in which the total maturity scores for formal set-up are reported as a percentage and are related to the average IS costs per housing association.
Housing associations IS m at u ri ty s co re 0% 10% 20% 30% 40% 50% 60% 70% 80% 90% 100% $0 $20 $40 $60 $80 $100 $120 $140 $160 $180 $200 1 2 3 4 5 6 7 8 9 10 11 12 13 14 15 16 17 18 19 20 21 22 23 24 25 26 27 28 29 30 31 32 33 34 35 36 37 38
IS costs per rentable unit
Figure 4. IT process maturity score vs. IS cost per rentable unit, for 38 housing associations
The benchmark reports contain additional figures, also showing results for each individual process. The measurement of IT process maturity provides insight into the organization and working of the IT department and into the relative costs incurred. Some participants comment that the result confirms more objectively what their ‘gut feeling’ already told them; “It confirms certain opinions I have about my own IT department.” But then these results help them taking their intuition a step further;
“It assists in communicating with internal clients of the IT department.” Other participants notice that certain processes have typically been over-formalized, while others have been neglected blind spots, commenting: “[The benchmark result] offers a starting point for a more efficient organization of the IT department.”
In conclusion, the outcome-based IS functionality and the process-based IT process maturity measurements are complementary by reflecting different dimensions of IS benefits. Both assist the housing associations to gain insights into the differences in IS cost levels and disclose aspects of IS benefits that help to find best practices and improvements for their IS performance. As the measurements are under continuous development, becoming more sophisticated over the years, participants become more proficient with the concepts and definitions. For IS functionality this means that the number of functionalities increases, as the common base among the organizations increases. Additionally, however, participants ask for advancement of the relatively simple scores. For IT process maturity it means that, as the importance of IT increases and the organizations demand more formal IT governance, participants ask for inclusion of more processes. In accordance with IS benefits literature, especially processes outside the IT department require attention. In addition, more sophisticated maturity scales are requested. There are many intermediate steps from the IT investment to a business benefit. Outcome-based
Average 49%
approaches offer better opportunities for a financial assessment of benefits. However, in order to complete this assessment IS functionality should be linked to business processes and business processes to financial returns. This information is hardly available at the organizations in this study.
In this study the process-based approach is experienced as a more comprehensive and a more efficient way to measure benefits. The process-based approach is, however, primarily based on subjective judgements of process maturity. This means a constant focus on reliability of the results, including common understanding of terms and definitions and the number and role of the employees completing the benchmarking questions.
CONCLUSION
This exploratory study offers new insights into benchmarking cost and benefits of IT. It shows potential usage of the outcome and process-based approaches in IT benchmarking. The outcome-based approach focuses on actual cost and benefits. The process-based approach addresses management practices to engender appropriate cost and benefit levels. Processes and outcomes are interrelated, as the best possible outcomes depend on well-established processes and have proven to be successful complementary approaches in software quality improvement approaches (Boehm, 1978).
In the longitudinal case study presented in this paper, managers prefer the outcome-based approach for their cost data. Cost of ownership models identify the cost constituents. There is an emerging perspective on the measurement of benefits data. In the first year the outcome-based approach was preferred. However, in consecutive years the process-based approach was preferred. The benefit constituents evolved in these three years of study. Several reasons were identified for these changes. First, there is the internal manager’s learning, which were hardly proficient in understanding the business impact of IT. Second, there was a lack of data on benefits, which made it difficult to link, for instance, information systems to business processes to revenues. Although several sets of benefit constituents were defined, this list did not yet stabilize.
Although the case study described considers multiple benchmarks, the research method is limited by the analysis of a single industry. Additional research in other industries is necessary in order to provide more generalizable conclusions. In addition, a single top level of analysis is used. Upon stabilization of the benefits list, quantitative research approaches could be employed to analyze the benchmark data of the individual organizations participating in the benchmark. These results could provide additional triangulated validation of the applied method.
In the future it will be the question whether to focus the benchmark or to enhance the outcome and process-based approaches alongside each other. It can be argued that the process-based approach will be useful as long as the outcome-based approach is not as standardized, objective and agreed upon as it is for costs measurement and management. It is however questionable whether this level of establishment can be reached for IS benefits. One possible direction of development would be an outcome-based measurement which takes the current operational information systems into account, acknowledges that benefits are generated through the supported business processes and identifies which benefits offer actual strategic advantage. The method of Bedell (Bedell, 1985) is one method that attempts to deal with these issues, but should be taken a significant step forward before it will be generally accepted as an objective and standardized way of measuring and benchmarking IS benefits. Overall, benefits benchmarking can be seen as to be an extremely challenging field of research, where still much is to be gained from both a theoretical and practical perspective.
REFERENCES
1. Alshawi, S., Irani, Z., and Baldwin, L. (2003) Benchmarking information technology investment and benefits extraction,
Benchmarking: An International Journal, 10, 4, 414-423.
2. Bedell, E.F. (1985) The computer solution: Strategies for success in the information age, USA.
3. Bicego, A., Koch, G., Krzanik, L., Kuvaja, P., Saukkonen, S., and Similä, J. (1994) Software Process Assessment & Improvement The BOOSTRAP Approach, Blackwell Business.
4. Byrd, T., Thrasher, E., Lang, T. and Davidson, N. (2006) A process-oriented perspective of IS success: Examining the impact of IS on operational cost, Omega, 34, 5, 448-460.
5. Boehm, B.W. (1978) Characteristics of Software Quality, North-Holland.
6. Camp, R. (1995) Business Process Benchmarking, Finding and Implementing Best Practices, Wisconsin, ASQC, Quality Press.
7. Compass (1997) Measuring value in IT, Compass Analysis Canada Ltd.
8. DeLone, W.H. and McLean, E.R. (2003) The DeLone and McLean Model of Information Systems Success: A Ten-Year Update, Journal of Management Information Systems, 19, 4, 9-30.
9. Doll, W.J., Deng, X., and Scazzero, J.A. (2003) A process for post-implementation IT benchmarking, Information & Management, 41, 2, 199.
10. Hinton, M., Francis, G., and Holloway, J. (2000) Best practice benchmarking in the UK, Benchmarking: An International Journal, 7, 1, 52-61.
11. Irani, Z., Ghoneim, A., and Love, P.E.D. (2006) Evaluating cost taxonomies for information systems management,
European Journal of Operational Research, 173, 3, 1103-1122. 12. ISACA (2007) Val IT overview, available www.isaca.org/valit/. 13. ISACA (2009) CobiT, available www.isaca.org/cobit/.
14. ISO/IEC (1994) Information Technology -Software quality characteristics and metrics- “Quality characteristics and subcharacteristics”, part 1.
15. Love, P.E.D., Irani, Z., Standing, C., Lin, C. and Burn, J.M. (2005) The enigma of evaluation: Benefits, costs and risks of IT in Australian small/medium-sized enterprises, Information & Management, 42, 7, 947-964.
16. Lynch, R.L., and Cross, K.F. (1995) Measure up!: Yardsticks for continuous improvement, 2nd ed., Wiley.
17. Markus, M.L., and Robey, D. (1988) Information Technology and Organizational Change: Causal Structure in Theory and Research, Management Science, 34, 5, 583-598.
18. McCall, J.A., Richards, P.K., and Walters, G.F. (1977) Factors in Software Quality, Vols I, II, III, US Rome Air Development Center Reports NTIS AD/A-049, 14, 015-055.
19. McDonald, M.P. (2006) Increasing the yield on IT resources, Gartner IT XPO, November 5-9, Cannes. 20. McNair, C.J., and Leibfried, K.H.J. (1992) Benchmarking: A Tool for Continuous Improvement, OMNEO.
21. Mohr, L.B. (1982) Explaining organizational behavior: the limits and possibilities of theory and research, San Francisco: Jossey-Bass.
22. Pfleeger, S.F. (1991) Software Engineering: the production of quality software, McMillan Publishing, New York. 23. Power, M. (1997) The audit society: Rituals of verification, Oxford University Press, Oxford.
24. Redman, B., Kirwin, B., and Berg, T. (1998) TCO: A Critical Tool for Managing IT, Strategic Analysis Report R-06-1697, Gartner Group, Stamford CT.
25. Remenyi, D., and Sherwood-Smith, M. (1998) Business benefits from information systems through an active benefits realisation programme, International Journal of Project Management, 16, 2, 81.
26. Remenyi, D., Sherwood-Smith, M., and White, T. (1997) Achieving maximum value from information systems: a process approach, Wiley.
27. Smith, J., Schuff, D., and Louis, R. (2002) Managing your IT total cost of ownership, Communications of the ACM, 45, 1, 101-106.
28. Thorp, J. (1998) The information paradox: Realizing the business benefits of information technology, McGraw-Hill, Toronto.
29. Tiernan, C., and Peppard, J. (2004) Information technology: Of value or a vulture?, European Management Journal, 22, 6, 609-623.
30. Treacy, M.E. (1989) The Cost of Network Ownership, Index Group, Inc., Cambridge, USA.
31. Ward, J., and Daniel, E. (2006) Benefits management: Delivering value from IS & IT investments, John Wiley & Sons Ltd., Chichester.
32. Zairi, M., and Ahmed, P.K. (1999) Benchmarking maturity as we approach the millennium?, Total Quality Management, 10, 4-5, 810-816.