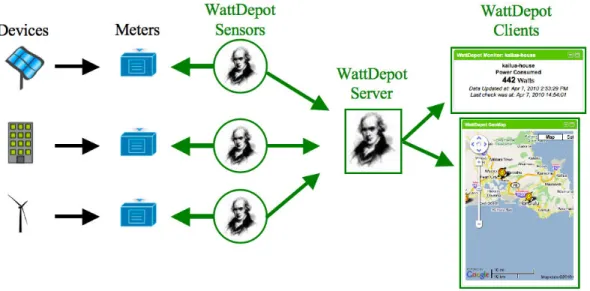
WattDepot: An open source software ecosystem for. for energy data collection, storage, analysis, and visualization.
Full text
Figure
Related documents
While suppliers will continue to work to monetize the computing and network assets that underpin the cloud services, it is the operational expertise of billing
This is the first study to explore non-overweight and overweight children’s engagement in different physical activity intensities, and determine the contribution of recess to
Essential information- Methodological notes: The 2007 survey covered all agricultural holdings having an area planted with fruit trees (apple, pear, peach, apricot, orange, lemon
Objectives: To provide the means of developing the basic public safety skills required by the Criminal Justice Standards and Training Commission and the Lake Technical
Methods: A cross-sectional study with 220 CDs adolescents and 110 healthy controls includ- ing: demographic/anthropometric data; puberty markers; modified questionnaire evaluating
We hypothesized that if general population without Parkinson‘s disease have PD-related NMSs which implies underlying alpha synucleinopathy, they are likely to be vulnerable
Position SPARE PARTS CODE VARIANT Accessories DESCRIPTION For each main item multiply q.ty by 1 26027336 SCHEDA MASTER SMT.. 3 22084222-01
The necessary volume of investment production of the main types of agricultural supply chain products for the satisfaction of the country's needs in achieving food security of
