Implementation of Element Space Spectral MUSIC
Based on ULA of
λ
/2 Dipole in Coherent
Environment for 2D Sources
1
Dhusar Kumar Mondal,
2B N Biswas
1,2Dept. of ECE, SKFGI, Mankundu, Hooghly, WB, India
Abstract
Classical MUSIC algorithm works with reasonable accuracy and resolution on the premise that the impinging signals are not fully correlated. But the performance degrades severely in a highly correlated environment. Spectral MUSIC with spatial smoothing as preprocessing scheme solve this problem of coherency detection. In this work complete attention is paid to analyze the performance limitation when element space spectral MUSIC algorithm is implemented with ULA of practical dipole element in multipath coherent signal environment. The ultimate performance of the
system is restricted due to the specific array pattern of ULA as
well as gain pattern of individual elements of array.
Keywords
Uniform Linear Array(ULA), MUSIC, Spatial Smoothing, Resolving power, Azimuth and Elevation Angle.
I. Introduction
Increase in demand of new wireless multimedia services such as internet access, multimedia data transfer, video conferencing etc by twentieth century wireless user is one of the most important reason of meteoritic growth of wireless industry. But it is a great challenge for wireless operator to accommodate these increased wireless traffic in their limited available bandwidth. Other important factors which restrain the quality of transmission are multiple access interference, multipath fading, and co-channel interference, are obvious in mobile communication. One of the most promising techniques for increasing system capacity without consuming extra bandwidth and power and simultaneously solving the above challenges is the concept of smart antenna system. Smart antenna works on two principles (1) Determining the angle of arrival(AOA) of user with the help of Direction of Arrival(DOA) estimation algorithm (2) Transmitting a focused beam towards the user only by Beamforming network. The angle of arrival estimation and focusing the beam in the same direction is done in synchronism and adaptive manner. It is only possible by implementing a new multiple access technique called Space Division Multiple Access
Different direction finding techniques and algorithm has been developed leading to significant improvements in DOA estimation
over the last decades. It is proved by different researchers that subspace based method provide high resolution DOA estimation. In this paper MUSIC is chosen for implementation as it is more stable, accurate, provide high resolution and require less computation. MUSIC algorithm estimates the DOA of signals from peak of MUSIC pseudospectra or spectrum. The spectrum is composed of eigenvectors of noise subspace which is orthogonal to the signal subspace. The Eigen vectors are extracted by singular value decomposition (SVD) applied on array correlation matrix. But if the sources are coherent or correlated the algorithm fails to resolve the source directions. Hence the performance of conventional MUSIC degrades severely in wireless communication which is a highly correlated environment as encountered in multipath propagation.
Several researchers have proposed some techniques which are to make MUSIC work in coherent or correlated environment,
and basically involves modification of signal covariance matrix
through preprocessing scheme [1-2].
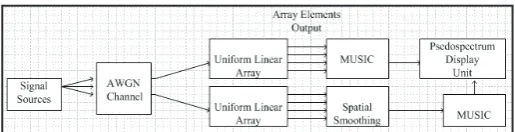
Fig. 1: System Blocks of DOA Estimation
In this work we have implemented Forward Spatial Smoothing
which can be utilized for ULA, the first choice of several
researchers, though it is having its own pros and cons. To the best of our knowledge most of the work in this area has been performed assuming the elements of array as isotropic which is unrealistic. So in this paper we have considered dipole antenna as it is realistic to implement in practice. Also in most of the earlier works all the sources are considered in XY plane only and their azimuth angles are estimated overlooking the effects of source elevation angle w.r.t plane of the array which is not really ignorable [3-4]
In this work first we have implemented element space MUSIC with spatial smoothing as preprocessing scheme so that it can fit
well in coherent environment with the help of uniform linear array (ULA) of identical dipoles. Secondly we have specially studied the effects of elevation angle on the resolving power of the array to determine the azimuthal angle of arrival. The dipole antenna elements are designed in HFSS and simulation of algorithm is performed in MATLAB.
II. Data Model
A complete theoretical and simulation analysis in Ref.[3, 4] shows that MUSIC with single ULA of half wavelength dipole can be implemented to estimate azimuth or elevation angle, one at a time, not both simultaneously in non coherent environment depending upon the orientation of ULA. Hence utilizing Spatial Smoothing as a preprocessing technique, before feeding the sample data of the array elements output to MUSIC algorithm, can be used for angle of arrival (azimuth or elevation) determination in coherent
environment also. The ULA remains the first choice in direction finding application because of its simple structure and mathematical
(1)
Where
(2)
Steering vector
(3)
is the signal spatial signature matrix of isotropic elements for
any angle of arrival (θ,φ).
Since in this work dipole element is selected as array element, whose gain is not uniform, hence the gain of directional array will also not be uniform and hence the steering vector needs to
be modified by:
(4)
where Gdipole(θ,φ) is the gain of dipole element
(5) But in practice we have only a finite no of discrete time measurements for calculation i.e.
Where (n) denotes finite time sample number.
(6) The signal autocovariance matrix [6] can be calculated from K samples collected from array element output:
(7)
III. MUSIC Algorithm
MUSIC algorithm requires subspace estimation from signal autocovariance matrix and it can be obtained from eigen decomposition process. The subspace estimation can be given by:
(8) Where Es and En are signal and noise subspace eigen vectors
respectively and Λs are signal subspace eigen value.
The output power known as pseudospectrum in MUSIC algorithm is given as [7-8]:
(9) MUSIC algorithm works well in noncoherrent environment but when the source become highly correlated its performance degrades
badly with increase in degree of correlation ρ given by
(10)
Reason for this degradation can be explained in brief as follows.
The signal covariance matrix Rxx observed to be nonsingular and diagonal in case of noncoherent signals [9]. But in case of coherent and highly correlated signal the same covariance matrix is singular, nondiagonal and the multiplicity of the smallest eigen value of covariance matrix is m-1. Thus the Rank of Rxx depends upon
signal correlation ρ(t). As in correlated scenario Rxx is not full rank and thus non invertible, which may cause MUSIC to fail.
IV. Forward Spatial Smoothing Technique
It is true that full rank of signal covariance matrix is necessary condition for DOA estimation in the application of subspace based method.The spatial smoothing initially suggested by J.E. Evans and then extensively studied by D.F. Suns is quite effective to restore rank of signal covariance matrix. There are other technique also not possible to discuss here. Spatial smoothing is based on averaging the covariance matrix of identical overlapping arrays and require an array of identical elements built with some form of periodic structure, such as ULA. In this technique the array of m elements is divided into p=m-L+1 smaller subarrays containing L no of elements each (Fig 2). Covariance matrix from the output of each subarray are separately calculated and then averaged to calculate the smoothed covariance matrix as: [6]
(11) Where Rifs is the covariance matrix of ith subarray.
1 2 3 4 5 6 7 8 9 10 11 12
Sub Array 1
Sub Array 2
Sub Array 3 * * *
Sub Array 7 Total Element 12
Sub Array Size 6 No of Sub Array 7
Fig. 2: Formation of Subarray (m=12, L=6)
The smoothed covariance matrix thus calculated is utilized to find En and ultimately P(θ,φ) which gives us desired DOA.
V. Simulation Result
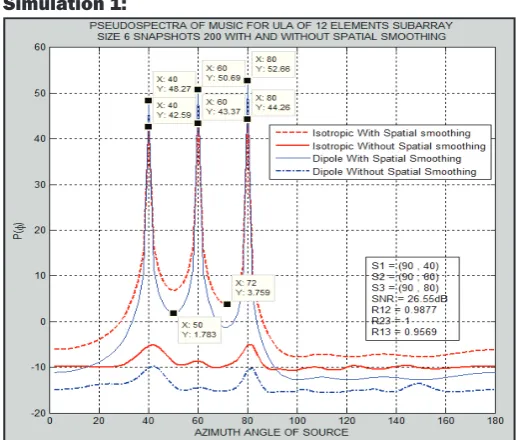
Simulation 1:
In this simulation three highly correlated source at same elevation angle 90 deg i.e. in XY plane only separated by 20 deg in azimuth are considered for array of isotropic as well as dipole elements. Proposed system detects well with comparatively approx 6.5 dB lower value of pseudospectrum in case of dipole elements.
Simulation 2 :
Fig. 4: Three Source are at Different Elevation
In these two cases we have consider a more practical scenario.
In fig.4 all the three sources are at three different elevation and
azimuth angle of 20deg apart.
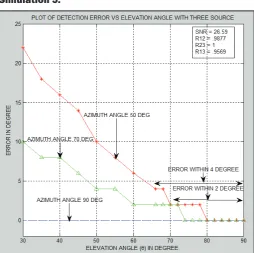
Simulation 3:
All the three sources at three different azimuth angle but for three
same elevation plane is studied. Result of fig 4 and 5 shows for
lower value of elevation angle detection errors are high and as the source goes away from broadside of array its pseudospectrum value in dB decreases hence resolving power of detection will falls. But if there are occasional combination of lower value of elevation angle with azimuth angle far away from 90 deg the result will be worst i.e. pseudospectrum value will decrease accompanied by more detection error.
Fig. 5: Simultaneous Plot of Three Different Scenario i.e. Azimuth
Angle (90,70,50) at Three Elevation Plane(φ) = 80,60,40.
Simulation 4:
Fig. 6: Three Source [(70,90) (50,70) (30,50)] [Source (30,50)
→ Undetectable]
Output result of fig. 6 reveal that the source direction (30,50) is undetectable but in fig. 7 increasing the elevation angle by 10 deg,
resulting source direction become detectable.
Fig. 7: Three Source [(70,90) (50,70) (30,50)]
Simulation 5:
Fig. 8: Error vs Elevation Angle
Though here it is enlisted under one simulation but fig.8 basically outcome of several simulation. Here effort has been put specifically
to enlist the effect of source elevation on detection accuracy. The plot shows that the detection error remains zero up to certain elevation angle there after increases with source elevation angle. The range of elevation angle where detection error is almost zero further depends on azimuth angle, source near to broadside of array maintain larger range. Further observations show that source at exactly 90 deg azimuth angle is detected with nil error within detectable elevation range.
Table 1:
Azimuth Angle Elevation Angle Range (deg)Nil Error 2 deg Error 4deg Error 90 deg 30 - 90 --- ---70 deg 74 - 90 60 - 90 50 – 90 50 deg 80 - 90 70 - 90 75 – 90
Simulation 6:
Figure 9: P(θ,φ) vs elevation angle.
Fig. 9 is also outcome of several simulation result. Here to find
out detection capability of system with nil error, within 2 deg error or with more error value of pseudospectrum vs elevation for three different azimuth angle 20 deg apart are plotted. Value of pseudospectrum is taken as difference between peak value and min value between peaks. Higher is the value more is the detection capability. Plot shows that source near the broadside of array as well as more elevation angle are easily detectable.
VII. Design of Half Wavelength Dipole
1.00 1.25 1.50 1.75 2.00 2.25 2.50 2.75 3.00
Freq [GHz] -16.00
-14.00 -12.00 -10.00 -8.00 -6.00 -4.00 -2.00 0.00
dB(S(port1,port1))
HFSSDesign1
XY Plot 6 ANSOFT
Curve Info dB(S(port1,port1)) Setup1 : Sw eep gap_src='0.0125mm' lambda='170mm'
dB(S(port1,port1)) Setup1 : Sw eep gap_src='0.0125mm' lambda='200mm'
dB(S(port1,port1)) Setup1 : Sw eep gap_src='0.05mm' lambda='170mm'
dB(S(port1,port1)) Setup1 : Sw eep gap_src='0.1mm' lambda='170mm'
dB(S(port1,port1)) Setup1 : Sw eep gap_src='0.5mm' lambda='170mm'
dB(S(port1,port1)) Setup1 : Sw eep gap_src='1mm' lambda='170mm'
dB(S(port1,port1)) Setup1 : Sw eep gap_src='0.125mm' lambda='200mm'
Fig. 10: S(1,1) Parameter of Dipole(1.8 GHz)
Fig. 11: Gain PatternG (θ,φ) of Dipole (1.8GHZ)
Half wave length dipole antenna is design in HFSS at operating frequency 1.8 GHz whose S(1,1) parameter and gain pattern
G(θ,φ) in dB are shown in fig. 10 and fig. 11. The same gain
pattern value as obtained from HFSS is utilized in MATLAB simulation of DOA estimation algorithm.
VII. Conclusion
Element space spectral MUSIC DOA estimation algorithm is suitable for estimation of DOA in coherent environment for practical application of smart antenna system with ULA of half wavelength dipole. The practicability of dipole is checked in HFSS software for gain pattern and application bandwidth calculation. Results obtained in all the simulation help us in deciding about the operating limitation we will encounter in case of practical application. Simulation results also clearly specify the error free operating range, as well as operating range within 2 deg error and 4 deg error. Radiation pattern of ULA with designed dipole element restrict the position of coherent source in 2D so that its azimuth angle of arrival can be detected with reasonable accuracy and resolution. Also it is concluded that system performance in terms of detect ability truly depends upon the position of highly correlated source with respect to ULA. This performance analysis is true for three correlated source only. For more than three sources it will be different from the results shown in this paper.
References
IEEE, Vol. 85, No. 7, July1997.
[2] Lal.C.Godra,"Application of Antenna Arrays to Mobile Communications, PartII: Beam- Forming and Direction of Arrival Considerations”, Proceedings of IEEE, Vol. 85, No. 8, August 1997.
[3] Dhusar Kumar Mondal,"Studies of Different Direction of Arrival (DOA) Estimation Algorithm for Smart Antenna in Wireless Communication”, International Journal of Electronics & Communication,Vol. 4, Issue-SPL-2, Jan-Mar2013.
[4] Dhusar Kumar Mondal,"Study of Spectral Music Direction of Arrival Estimation Algorithm of Smart Antenna Using Half-Wavelength Dipole Uniform Linear Array”, International Journal of Electronics & Communication, Vol. 5, Issue-SPL-2, Jan-Mar 2014.
[5] Raymond J. Weber, Yikun Huang,"Performance Analysis of direction Arrival Estimation with a Uniform Circular array”, 2012 IEEE, IEEEAC Paper#1705, Ver. 2.
[6] B.D.Rao, K.V.S.Hari,"Effect of spatial smoothing on the performance of MUSIC and minimum-norm method”, IEEE Proceedings, Vol. 137, Pt.F, No. 6, Dec1990.
[7] K.V.Nikolakopoulos, D.Anagnostou, C.G. Christodoulou M.T.Chryssomallis,“Estimation of Direction of Arrival for Coherrent Signals in Wireless communication Systems”, 2004 IEEE.
[8] Franck B. Gross,“Smart Antenna for Wireless Communi-cation”, 2005 by McGraw Hill Companies, Inc.
![Fig. 6: Three Source [(70,90) (50,70) (30,50)] [Source (30,50) → Undetectable]](https://thumb-us.123doks.com/thumbv2/123dok_us/1339356.1642475/3.595.37.282.541.766/fig-source-source-undetectable.webp)