Big Data in Transport Case Study: Open Traffic
Purpose: Information
Submitted by: World Bank Group
9th Transportation Ministerial Meeting Cebu, Philippines 8-10 October 2015
“Driving Economic Growth through Inclusive Mobility and Sustainable Transport Systems.”
Driving Economic Growth through Inclusive Mobility and Sustainable Transport Systems.
Big Data in Transport
Case Study: Open Traffic
On-going World Bank regional collaboration with GrabTaxi
Background
• Traffic congestion affects everyone – all social and income classes – and can exacerbate pollution and GHG emissions, as well as restrict urban economic growth.
• Resource-constrained traffic management agencies are challenged to mitigate congestion
• Starting in 2011, the project team worked with the Cebu City Government to develop an open-source platform for
collecting, visualizing, and analyzing traffic speed data derived from taxi drivers’ smartphones.
• This pilot project successfully achieved a proof of concept and the platform, Cebu Traffic, won first prize in the 2013 Philippines National E-Governance Competition
Background
• With this success, the project team then sought to use these proven methodologies to support the development of a replicable, inexpensive alternative to traditional travel time and congestion data
collection and analysis.
•Objective: Empower resource-constrained
agencies to make better, evidence-based decisions that previously had been out of reach – decisions about traffic signal timing plans, public transit
provision, roadway infrastructure needs, emergency traffic management, and travel demand
Background
• To this end, the team partnered with GrabTaxi, an on-demand taxi service that generates taxi GPS data in countries the Bank supports, as well as Conveyal, an open-source transport software development firm.
• With these partnerships and support from the World Bank’s Big Data Challenge Innovation Grant, the team improved upon the initial pilot platform, tested it with data from six countries, and deployed the platform in Cebu City for live testing.
The Difference
Big Data Makes
1/3 of the global population
is expected to have a
smartphone
by 2017
Think of Smartphones as Traffic Probes
GPS and Wi-Fi pings create a sensor
network that:
• is not limited to specific corridors
• is continuously updated in real time
• does not require any maintenance or
upkeep
Rise in Taxi Hailing Apps and TNCs
These companies maintain databases of
millions of GPS points that crisscross urban
areas, and each company’s individual
database may span more than a hundred
cities, across many countries.
1 web-based, open-source
application
+
1 regional data partnership
=
traffic monitoring and
management across
dozens of APEC cities
“Driving Economic Growth through Inclusive Mobility and Sustainable Transport Systems.”
Open Traffic
Methodology
Density of GPS location points captured from participating taxis
during Cebu Traffic pilot (2013)
Three Step Methodology:
1.
Calling of the relevant Open Street Map
(OSM) tiles.
2.
Assigning virtual “detectors” to the OSM
tiles.
3.
Estimating travel time, based on virtual
detector crossings.
1. Calling OSM Tiles
What is Open Street Map?
• OSM is a free, global geographic dataset populated by volunteers.
• This map is considered “open data” and has no licensing requirements.
• The OSM may be freely updated and
improved by transport agencies and others, per a project’s particular needs, using free and open-source editing tools made available by the OSM Foundation.
1. Calling OSM Tiles
• The Open Traffic platform links average traffic speed calculations to OSM road segments. • “Calling” the relevant OSM “tiles” means
downloading the relevant portion of the global OSM map for use in calculating average
traffic speeds.
• While it is possible to download the entire global OSM map for these analyses, for the sake of speed and efficiency, only those tiles that are needed to estimate traffic speed for a given set of GPS points are called.
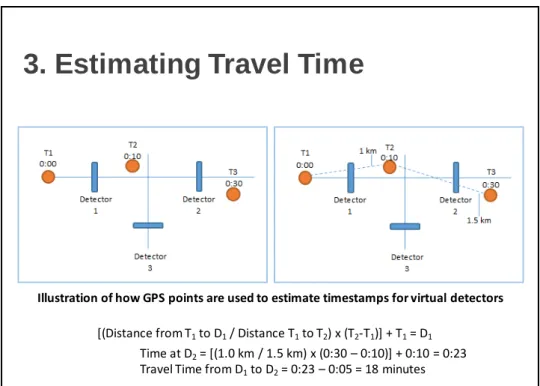
3. Estimating Travel Time
Illustration of how GPS points are used to estimate timestamps for virtual detectors
[(Distance from T1to D1/ Distance T1to T2) x (T2‐T1)] + T1= D1 Time at D2= [(1.0 km / 1.5 km) x (0:30 – 0:10)] + 0:10 = 0:23 Travel Time from D1to D2= 0:23 – 0:05 = 18 minutes
“Driving Economic Growth through Inclusive Mobility and Sustainable Transport Systems.”
Initial Results
Manila Jakarta Kuala Lumpur Singapore Ho Chi Minh Bangkok
Congestion Variability
Screenshot from First Iteration of Open Traffic Platform under the Big Data
Challenge Project, with EDSA 7.4 km Stretch
Southbound Trip – Average Travel Time and Speed on Friday, July 24, at 6:00 p.m.
“Driving Economic Growth through Inclusive Mobility and Sustainable Transport Systems.”
Next Steps
Software Development Completion
Phase I
• User Interface Improvement
• Administrative Interface Development • Confidence Intervals
• Aggregated Traffic Speed Data Export
Phase II
• Critical Road Segment Analysis
Optimizing Traffic Signals
Cebu Pilot Program Objective
Develop a methodology for improving traffic signal timing plans for select corridors in Cebu, without the need for regularly updated turning counts and/or fully-functioning detectors / sensors.
Emergency Service Dispatch
Combine DRIVER with
traffic speed data to
derive optimal ambulance and emergency services stations and dispatch.
Open Traffic for All
As part of the World Bank’s mission and GrabTaxi’s corporate social responsibility mandate, we would like
make this open-source platform available to all transport agencies and
ministries in APEC countries where GrabTaxi operates, without charge.
Open Traffic for All
In return, we ask that
you try Open Traffic.
That you use these data
to support
evidence-based decisions that will
improve traffic, for the
public good.
“Driving Economic Growth through Inclusive Mobility and Sustainable Transport Systems.”
For More Information:
Interim Project Reporthttp://bit.ly/opentrans
Contacts
Holly Krambeck, [email protected]
Natasha Beshorner, [email protected]
Atty. Rafael Yap, [email protected]
Deevya Desai, [email protected]
“Driving Economic Growth through Inclusive Mobility and Sustainable Transport Systems.”
Extra Slides
Optimizing Traffic Signals
Methodology
1. Using turning counts conducted by Cebu City Transportation Office from February through March, 2015, update the SCATS timing plan for N. Bacalso Ave., using traditional signal optimization methods. 2. Using only taxi GPS data provided by GrabTaxi,
develop a new algorithm for optimization. Iterate. 3. Compare:
1. Business-as-Usual
2. Brief period when signals turned off (January 2015) 3. Updated signal timing, traditional method (July
2015)