Proof of Concept for a Visual Analytics Dashboard for Transportation
Network Analysis
Marian Sorin Nistor
Universität der Bundeswehr München, Germany
Abstract
This paper discusses the latest developments in the field of visual analytics, and the role of network analysis for transportation systems. Multilayer and multiplex based visualizations are considered reliable solutions for handling the information overload the decision makers are facing in the addressed domain. The existing tools matching these requirements are briefly reviewed. Then, a proof of concept for a dashboard is presented focusing on a transportation network analysis with multiple network measures and indices in a multiplex visualization.
Visual Analytics Dashboard; Transportation Network Analysis; Multilayer and Multiplex Visualization.
1. Introduction
Due to current developments, more and more data is daily being generated [1], which needs to be processed to be transformed into information. This needs to be judged by decision makers based on various sets of features to be considered valuable. Thus, computer systems, which are able to handle significant amounts of information and structure it based on predefined criteria, are vital in a decision-making process.
In this paper, the focus will be on facilitating the decision-making process in transportation systems with advanced computer systems. Most transportation systems can be modeled as a network (graph) G=(N,E), where N is a finite collection of nodes(e.g. stations, road junctions, airports, etc.) and E is a set of pairs of nodes – edges, which represent the connections between nodes. It is important to note, that for transportation models all nodes need to be connected.
Many studies tried to analyze different aspects of these type of networks like network centrality [2–5], vulnerability [6–8], reliability [9,10], resilience [11–
13], flows [14–16], etc., and there has been a considerable progress in the past few decades. However, most of the studies are at a theoretical level and the decision-makers need a consistent background in the field of graph theory to perform such analyses and to accurately interpret the results. Moreover, interpreting network data without proper visualizations complicates obtaining valuable information from the results. Different visualization perspectives can lead to better insights from the processed information.
Visual analytics is a reliable solution to combine network data, visualization, and human factor for decision-making [17,18], through interactive visual interfaces [19].
This paper contributes a concise review of the current development in this direction, and introduces a new concept for a visual analytics dashboard. The goal is to allow the decision-maker to perform analyses on transportation networks with the support of various sets of criteria. At the same time, it should be possible to interact with the resulting data and visualizations.
In the following section, the relevance of network modeling is presented along with a review of the publications on visual analytics for network data. Finally, the current stage in the development of interactive dashboards for network data is highlighted as far as it is relevant for the application to transportation networks. In section 3, the new proof of concept for a dashboard is described. Through its unique combination of features an attempt is made to increase the usability of tools from graph theory for applications. In Section 4, this paper concludes with final remarks.
2. Background and State-of-the-Art
The initial problem analyzed in graph theory was related to transportation. Euler tried to find a way how one can cross all of the seven bridges of Königsberg exactly once [20]. However, only in the
Proceedings of the 51st Hawaii International Conference on System Sciences|2018
URI: http://hdl.handle.net/10125/50006 ISBN: 978-0-9981331-1-9
last few decades did practical applications of this field start to be popular [21,22].
Modeling and analyzing transportation networks with the support of graph theory lead to non-trivial results. The networks can be analyzed from global or local perspectives with the support of several measures and indices. These can be categorized based on the type of the conducted analysis.
Centrality measures and indices [5], reveal the key nodes of a network that handle important amounts of flow, e.g., traffic load. Vulnerability measures and indices [7], identify those nodes, or links, for which removal would disconnect the network. Reliability measures and indices [9], analyze how much disruption a network can handle before failure, while the resilience ones [12], analyze how much time the network needs to return to the operating state after disruption. One application for the flow measures and indices [14] is to analyze the flow efficiency of the network, and to quantify the drop in efficiency in case of disruption.
Figure 1. Example of a multiplex visualization generated with Pymnet [23].
With the continued advancement in transportation network analysis, decision makers need more support to interpret the results, to avoid overloading the process with too much information structured in large tables and overcrowded plots.
Visual analytics provides tools to overcome this problem. This field is a branch of Information Visualization. The latter focuses on abstract data visualization, while visual analytics combines automated analysis algorithms with interactive visualizations to support the decision process in accessing relevant information in the shortest time possible [18].
While this field is still maturing, many visual analytics techniques or tools have been developed to date. Only a few reviews offer an exhaustive
overview of the recent developments, allocating just a small section to the tools able to handle network data. One of the papers [24] reviews the tools developed after 2009, or older if they have a newer version released in the past couple of years. The review includes open-source tools, and ones not yet available for public, discovered in recent literature. Another paper [25] reviews the available open-source toolkits, and this review [26] complements the latter with the available commercial toolkits.
The reviewed tools use different visualization techniques to solve the layout problem when large network datasets need to be displayed. However, the impact of these techniques is limited to a two-dimensional space. The latest software developments break this barrier, and allow the network analysis to evolve to a three-dimensional interactive space. Thus, it is possible to visualize multilayer or multiplex networks. The visualization of transportation networks in a multilayer mode enables the user to combine and to explore different types of networks (e.g. rail, road, air) in the same display. The multiplex visualization focuses on different aspects of the same network. This mode enables the user to explore, e.g., different stages/analyses of one transportation network on multiple layers. Comprehensive reviews of exiting types of multilayer and multiplex networks and their applications are already available in literature [27,28].
Figure 2. Example of a multilayer visualization captured from Multinet.js [29].
The reviews on visual analytics are extended here, to the best of the author’s knowledge, by the tools or toolkits capable of handling network data in multilayer or multiplex visualizations that may be applicable to transportation network analysis as well.
Python and R are two top leading scientific programming languages that offer a wide variety of libraries for network analysis at an efficient computational time. Pymnet [23], a library for Python, offers a plotting function for multilayer and multiplex networks visualizations (see a plot example in Figure 1) among other more theoretical tools. To the best of author’s knowledge, this function is unique to both Python and R.
This visualization solution is very useful for quick plots of any kind of network. This back-end library offer high quality images [23], but it lacks the interaction with the network. To implement the interaction and to benefit from the computation advantages offered by Python for network analysis, a front-end solution is needed.
Such solution is offered by Multinet.js [29], a web-based tool developed by the Chair of Systems Design at ETH Zurich, Switzerland. The front-end is developed in JavaScript, while the back-end is programmed in Python. In Figure 2, a capture of the multilayer visualization generated by Multinet.js [29] can be seen. In the top right corner a plus sign can be seen, that opens a panel box for visualization. By clicking a button in the bottom left corner the displayed data is also available as a table with details. Besides the different features in the panel box, two important ones are available: the time frame selection of the data to be displayed and the interlayer connection together with an information box popping up when clicking on a particular node. However, the tool is meant for large datasets visualizations especially for social and economic networks. To display technical systems, it needs to include special features like geolocation and coordinate points for transportation networks. Furthermore, this tool was developed for network data exploration only, and no analysis features are provided.
The last tool meeting the selection criteria of this paper is MuxViz [30]. This tool is a result of a European project [30], and is the most complex among the ones reviewed. In Figure 3 an example of a multiplex visualization captured from MuxViz is presented.
While the first two were complementary, MuxViz is fundamentally different. Instead of Python, it uses the combination of R and GNU Octave as scientific programming languages on the back-end for a faster computation time. The front end is a mixture of a complex web-based dashboard developed in Shiny (similar technology to JavaScript) and R. This tool comes with a complex network analysis package, bringing together the most important network libraries of R, and some dedicated analyses as well. The advantage of this open-source tool is that the
users can easily customize the network analysis package at the back-end.
This tool comes with a split visualization mode. The first mode is for interactively exploring the results of the analyses directly in the dashboard. The second mode is for the network visualization which is not integrated in the dashboard. This visualization is initiated from the dashboard and opens in a separated R graphics device window appears using the Open GL technology to render the network(s) as a three-dimensional object. This means that the exploration is limited to rotations and zoom; the interaction part with the components of the network is not possible. MuxViz, like Pymnet, is a powerful computational tool for network analysis, but the provided network visualization modes are developed more towards disseminating the results (final step) than visual exploring and interacting with the resulting network analysis (intermediary step).
Figure 3. Example of a multiplex visualization captured from MuxViz [30].
3. Dashboard features
The reviewed tools already incorporate features with some of the latest technological developments in the field. However, these features are rather scattered among them, and each tool presents significant pros and cons. In this section, the components of the proof of concept tool will be discussed, neatly combining all relevant features and allowing user interaction during the analysis.
For the back-end it is important that the network analysis is performed on a server with a high computation power to be able to cope with an active analysis of the user. Active analysis means that the user requests during the exploratory analysis on the front-end need quick response from the back-end. R and Python proved to be suitable programming languages to perform the network analysis on the server side.
The types of network analysis proposed to be performed have already been introduced at the beginning of the previous section.
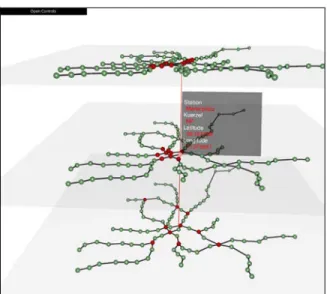
The front-end is very important for visualization, therefore the main attention on the dashboard should be on the multilayer and multiplex visualization, an example for which is presented in Figure 4. It should be noted that this visualization receives two thirds of the available space. The other one third is reserved for numerical results (e.g. tables) and two-dimensional graphical representations (e.g. histograms, density plots, boxplots, pie charts, etc.). The selection of the network(s) and of the analysis to be conducted is made through a control panel which appears and disappears on top of the visualizations. An example of such a button can be seen in Figure 4 in the top left corner.
The technology in charge of handling the visualization is web-based and programmed in JavaScript. The latter offers very suitable libraries like D3.js [31] and Three.js [32] for interactive three-dimensional representations.
Figure 4. Visualization concept for the transportation network analysis dashboard.
A novel feature of this tool is the focus on multiple network measures and indices simultaneously applied to one network. Whereas, the
existing tools focus on applying, e.g., one analysis on multiple networks to compare the impact of that analysis on different networks. Figure 4 shows the Munich subway network [33] as an exemplified transportation network analyzed using different measures. Each layer has a selection (in red) of the top ten nodes as a result of one analysis. The differences between those stresses the importance of the network exploratory part as an intermediary step of the analysis, and not as a final step of the results dissemination.
The position of the nodes in Figure 4 use the real geolocation of the stations, which gives the decision maker a more realistic impact of the results, with or without a satellite capture as a background of the layer. This feature is practical for small to medium sized transportation networks. For large networks the classic layout algorithms can be used [34].
4. Conclusions
As presented in the previous sections, the advancements of visual analytics are significant, but not yet mature. This field is closely connected with the advancements of new software technologies. The latter enable new ways of visual explorations that just few years ago were only at a concept level.
The development of new visual analytics techniques, or tools, should keep up with the latest available technologies to cope with the massive increase of the daily generated data.
Furthermore, the increase of data should be used as an advantage for the decision makers. E.g. a railway network manager willing to assess the vulnerabilities of the network should be able to consider not only the general flow information of the trains and passengers, but also the information generated by, e.g., sensors installed in trains and stations. The role of visual analytics is to handle this information load, to structure it, and to conduct automated analyses to aid the decision-making process.
This is also the goal of the presented dashboard which uses the recent software technologies to propose a visual analytics solution focused on the application to transportation network analysis. The same concept can be adapted and used for other networks as well.
5. Acknowledgements
Inputs to the paper from Maximilian Moll are gratefully acknowledged.
6. References
[1] IBM, What is big data?, available at https://www- 01.ibm.com/software/data/bigdata/what-is-big-data.html (accessed on June 14, 2017).
[2] D. Tsiotas, S. Polyzos, Introducing a new centrality measure from the transportation network analysis in Greece, Ann Oper Res 227 (1) (2015) 93–117. [3] J. Wang, H. Mo, F. Wang, F. Jin, Exploring the
network structure and nodal centrality of China’s air transport network: A complex network approach, Journal of Transport Geography 19 (4) (2011) 712– 721.
[4] S. Derrible, Network centrality of metro systems, PLoS ONE 7 (7) (2012) e40575.
[5] M. Zsifkovits, Z. Wang, M.S. Nistor, S.W. Pickl, Complex System Analysis using Graph Theory - Identifying Criticality in Transportation Networks, in: Security Research Conference. 11th Future Security 2016, Berlin, Germany, Fraunhofer Verlag, Stuttgart, Germany, 2016, pp. 269–275.
[6] B. Berche, C. von Ferber, T. Holovatch, Y. Holovatch, Public transport networks under random failure and directed attack, arXiv preprint arXiv:1002.2300 (2010).
[7] M. Appert, L. Chapelon, Measuring urban road network vulnerability using graph theory: The case of Montpellier’s road network, 2013.
[8] E. Rodríguez-Núñez, J.C. García-Palomares, Measuring the vulnerability of public transport networks, Journal of Transport Geography 35 (2014) 50–63.
[9] M.S. Nistor, M. Dehmer, S.W. Pickl, Network Exploratory Analysis on Subway Transportation Systems against Complex Threats Including a Human Factors Perspective, Procedia Manufacturing 3 (2015) 6593–6598.
[10] H.-N.L. Teodorescu, Revisiting Models of Vulnerabilities of the Networks, Studies in Informatics and Control 25 (4) (2016) 469–478. [11] S.S. Chopra, T. Dillon, M.M. Bilec, V. Khanna, A
network-based framework for assessing infrastructure resilience: A case study of the London metro system, Journal of The Royal Society Interface 13 (118) (2016) 20160113.
[12] M.E. O’Kelly, Network hub structure and resilience, Networks and Spatial Economics 15 (2) (2015) 235– 251.
[13] S. Dunn, S.M. Wilkinson, Increasing the resilience of air traffic networks using a network graph theory approach, Transportation Research Part E: Logistics and Transportation Review 90 (2016) 39–50. [14] M.S. Nistor, S.W. Pickl, M. Raap, M. Zsifkovits,
Network efficiency and vulnerability analysis using the flow‐weighted efficiency measure, International Transactions in Operational Research (0) (2017) 1– 12.
[15] V. Latora, M. Marchiori, Is the Boston subway a small-world network?, Physica A: Statistical Mechanics and its Applications 314 (1) (2002) 109– 113.
[16] V. Latora, M. Marchiori, Efficient behavior of small-world networks, Physical review letters 87 (19) (2001) 198701.
[17] Keim D A, Andrienko G, Fekete J, others, Visual analytics: Definition, process, and challenges, in: Information Visualization: Human-Centered Issues, K.A. Perspectives, Stasko J, Fekete J, others (Eds.), Springer, 2008.
[18] D.A. Keim, F. Mansmann, D. Oelke, H. Ziegler, Visual Analytics: Combining Automated Discovery with Interactive Visualizations, in: J.-F. Jean-Fran, M.R. Berthold, T. Horváth (Eds.), Discovery Science: 11th International Conference, DS 2008, Budapest, Hungary, October 13-16, 2008. Proceedings, Springer Berlin Heidelberg, Berlin, Heidelberg, 2008, pp. 2–14.
[19] Pak Chung Wong, J. Thomas, Visual Analytics, IEEE Comput. Grap. Appl. 24 (5) (2004) 20–21. [20] L. Euler, Leonhard Euler and the Königsberg
bridges, Scientific American 189 (1) (1953) 66–70. [21] F.S. Roberts, Graph theory and its applications to
problems of society, SIAM, 1978.
[22] J.A. Bondy, U.S.R. Murty, Graph theory with applications, Macmillan London, 1976.
[23] Mikko Kivelä, Multilayer Networks Library for Python (Pymnet), available at http://www.mkivela.com/pymnet/ (accessed on June 14, 2017).
[24] S. Jarukasemratana, T. Murata, Recent Large Graph Visualization Tools: A Review, Information and Media Technologies 8 (4) (2013) 944–960.
[25] J.R. Harger, P.J. Crossno, Comparison of open-source visual analytics toolkits, in: IS&T/SPIE Electronic Imaging, 2012, 82940E‐82940E.
[26] L. Zhang, A. Stoffel, M. Behrisch, S. Mittelstadt, T. Schreck, R. Pompl, S. Weber, H. Last, D. Keim, Visual analytics for the big data era—A comparative review of state-of-the-art commercial systems, in: Visual Analytics Science and Technology (VAST), 2012 IEEE Conference on, 2012, pp. 173–182. [27] M. Kivelä, A. Arenas, M. Barthelemy, J.P. Gleeson,
Y. Moreno, M.A. Porter, Multilayer networks, Journal of Complex Networks 2 (3) (2014) 203–271. [28] S. Boccaletti, G. Bianconi, R. Criado, C.I. Del Genio,
J. Gómez-Gardenes, M. Romance, I. Sendina-Nadal, Z. Wang, M. Zanin, The structure and dynamics of multilayer networks, Physics Reports 544 (1) (2014) 1–122.
[29] Chair of Systems Design at ETH Zurich, Multinet.js a visualization framework for large, dynamic and multi-layered graphs, available at https://multinets.io/ (accessed on June 14, 2017).
[30] M. de Domenico, M.A. Porter, A. Arenas, MuxViz: a tool for multilayer analysis and visualization of networks, Journal of Complex Networks (2014) cnu038.
[31] N.Q. Zhu, Data visualization with D3. js cookbook, Packt Publishing Ltd, 2013.
[32] J. Dirksen, Learning Three. js: The JavaScript 3D library for WebGL, Packt Publishing Ltd, 2013. [33] MVV - Münchner Verkehrs- und Tarifverbund,
MVV GmbH, available at http://www.mvv-muenchen.de/ (accessed on March 12, 2017). [34] S. Tripathi, M. Dehmer, F. Emmert-Streib, NetBioV:
an R package for visualizing large network data in biology and medicine, Bioinformatics 30 (19) (2014) 2834–2836.
![Figure 2. Example of a multilayer visualization captured from Multinet.js [29].](https://thumb-us.123doks.com/thumbv2/123dok_us/630799.2575985/2.918.483.811.622.922/figure-example-multilayer-visualization-captured-multinet-js.webp)
![Figure 3. Example of a multiplex visualization captured from MuxViz [30].](https://thumb-us.123doks.com/thumbv2/123dok_us/630799.2575985/3.918.484.811.445.811/figure-example-multiplex-visualization-captured-muxviz.webp)