Phylogenetics
Advance Access publication April 20, 2014Efficient Bayesian inference under the structured coalescent
Timothy G. Vaughan
1,*, Denise Ku¨hnert
1,2,3, Alex Popinga
1,3, David Welch
1,3and
Alexei J. Drummond
1,31
Allan Wilson Centre for Molecular Ecology and Evolution, Massey University, Palmerston North 4442, New Zealand,
2
Institute of Integrative Biology, Swiss Federal Institute of Technology (ETH), Zurich 8092, Switzerland and3Department of Computer Science, University of Auckland, Auckland 1142, New Zealand
Associate Editor: David Posada
ABSTRACT
Motivation: Population structure significantly affects evolutionary dynamics. Such structure may be due to spatial segregation, but may also reflect any other gene-flow-limiting aspect of a model. In combination with the structured coalescent, this fact can be used to inform phylogenetic tree reconstruction, as well as to infer parameters such as migration rates and subpopulation sizes from annotated se-quence data. However, conducting Bayesian inference under the structured coalescent is impeded by the difficulty of constructing Markov Chain Monte Carlo (MCMC) sampling algorithms (samplers) capable of efficiently exploring the state space.
Results:In this article, we present a new MCMC sampler capable of sampling from posterior distributions over structured trees: timed phylogenetic trees in which lineages are associated with the distinct subpopulation in which they lie. The sampler includes a set of MCMC proposal functions that offer significant mixing improvements over a previously published method. Furthermore, its implementation as a BEAST 2 package ensures maximum flexibility with respect to model and prior specification. We demonstrate the usefulness of this new sampler by using it to infer migration rates and effective popula-tion sizes of H3N2 influenza between New Zealand, New York and Hong Kong from publicly available hemagglutinin (HA) gene se-quences under the structured coalescent.
Availability and implementation:The sampler has been implemented as a publicly available BEAST 2 package that is distributed under version 3 of the GNU General Public License at http://compevol. github.io/MultiTypeTree.
Contact:[email protected]
Supplementary information:Supplementary data are available at
Bioinformaticsonline.
Received on October 2, 2013; revised on April 8, 2014; accepted on April 11, 2014
1 INTRODUCTION
Model-based phylogenetic inference has become one of the prin-cipal methods of using genetic sequence data to test scientific hypotheses pertaining to evolving populations. Its wide-spread adoption has been driven not only by improvements in compu-tational and sequencing hardware but also by advances in meth-ods of statistical inference. An important initial step in this
development was the derivation of the n-coalescent process (Kingman, 1982), which probabilistically ties the shape of a rooted phylogenetic tree of n randomly chosen individuals to the parameters of an underlying Wright–Fisher population gen-etics model. In conjunction with Felsenstein’s ‘pruning algo-rithm’ (Felsenstein, 1981), this allowed for the computational inference of the sample genealogy itself alongside population genetic parameters, such as the effective population size.
Since these beginnings, an array of sophisticated models and inference methods has been developed, allowing molecular mu-tation rates, population size histories and other population gen-etic parameters of interest to be inferred alongside increasingly sophisticated phylogenetic tree reconstructions, which, for ex-ample, do away with the assumption of a strict molecular clock (Drummondet al., 2006; Sanderson, 2002; Thorne et al., 1998). Rapidly evolving populations such as viruses and bacteria are of particular interest, as such populations may undergo sig-nificant demographic variation over timescales comparable with the age of the genealogy of sampled data. Such data form the basis of the emerging field of phylodynamics (Grenfell et al., 2004; Ku¨hnert et al., 2011; Lemey et al., 2009; Volz et al., 2013), which exploits these overlapping timescales by using the genetic data to select and infer parameters of sophisticated epidemiological models.
Many of the models that are of interest to population geneti-cists and epidemiologists are structured in some way. This struc-ture may represent the spatial subdivision of a population into several distinct ‘demes’, or it may represent some other logical categorization of individuals such as the temporal subdivision used in compartmental epidemiological models. Such struc-ture can strongly affect the shape of inferred genealogies (Pannell, 2003), and can provide a source of statistical bias when ignored.
A time-tested means of including this structure in phylogenetic analyses is through the use of the structured coalescent (Hudson, 1990; Notohara, 1990), an extension of Kingman’s coalescent in which the unstructured Wright–Fisher model is replaced by a structured equivalent encompassing a number of discrete subpopulations. Phylogenetic analyses based on this model are capable of both (i) reducing model misspecification bias in the inference of the genealogy and (ii) estimating parameters specific to structured models such as migration rates and effective subpopulation sizes. While similar, this model is distinct from the character-based treatment of lineage locations used by Lemey et al. (2009), in that the structured coalescent allows
*To whom correspondence should be addressed.
location to explicitly affect coalescent rate. (This is discussed in Section 1 of the Supplementary Material.)
At least two distinct Markov Chain Monte Carlo (MCMC) schemes for conducting inference under the structured coalescent exist in the literature. Both of these schemes use an MCMC algorithm to explicitly sample both the demographic and evolu-tionary model parameters and the structured genealogy: a phylo-genetic tree annotated with individual migration events. The first of these schemes is the method of Beerli and Felsenstein (Beerli, 2006; Beerli and Felsenstein, 1999, 2001), which is implemented in the software package Migrate-n. At its core, this method in-volves a single proposal function, which updates the structured tree by ‘dissolving’ a randomly selected edge and drawing a new edge by simulating from the structured coalescent conditional on the remaining edges.
The other scheme is the work of Ewinget al. (2004), who have published a set of simple and fast proposal functions that act solely on the migration events on the structured genealogy. In combination with those for traversing the space of unstructured trees (Drummond et al., 2002), Ewing et al. showed that an MCMC algorithm based on these moves is capable not only of jointly inferring the structured tree and migration model param-eters, but also of exploiting the additional information contained in serially sampled data to infer absolute migration rates. While certainly functional and useful, this scheme suffers from perform-ance issues, which arise in the form of slow ‘mixing’, meaning that MCMC calculations must be run for a long time to obtain useful information about the posterior probability distribution. An additional issue is that no implementation of the sampler has been made widely available.
In this article, we introduce a new set of MCMC proposal functions (or ‘operators’) that provide an efficient means of using serially sampled sequence data to infer the full structured tree and related model parameters (including mutation rates) under the structured coalescent. These operators, together with the data structure representing the structured tree itself and the probability density calculation algorithm for the structured co-alescent, are implemented and distributed as a package extension to BEAST 2 (Bouckaert et al., 2014; http://www.beast2.org). When applied to equivalent data, and assuming equivalent evolutionary models and parameter priors, this new package yields posterior distributions, which are exactly equivalent to those obtained using Migrate-n. However, the use of the BEAST 2 platform for our implementation gives our sampler access to a large array of molecular evolution models and parameter priors not yet available in Migrate-n. Additionally, we have implemented the operators described by Ewing et al., allowing direct comparison between the two sampling methods. This comparison shows that the new operators achieve significantly faster mixing when applied to simulated data, with an order of magnitude improvement in some cases. We go on to demonstrate the practicality of the new sampler by using it to infer mutation rates, effective population sizes and the structured tree from geographically annotated HA gene se-quences derived from the Influenza A subtype H3N2 strain. We interpret these results in light of recent work by Bedfordet al. (2010).
2 MATHEMATICAL BACKGROUND
2.1 Structured tree definition
Before discussing the inference procedure, we need to define pre-cisely what we mean by a ‘structured tree’.
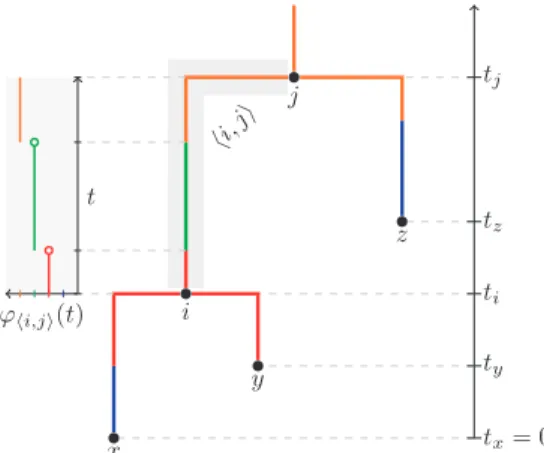
In this article, we define a structured treeT ofnleaves as a fully resolved, rooted and timed phylogenetic tree in which every internal node represents a coalescent event and where every point on each edge of the tree is associated with exactly one typed drawn from a fixed setDof such types. Mathematically, we write T ¼ ðV;E;t;MÞ. The first three elements are the usual phylo-genetic tree components: a setVof 2n1 nodes, a setE con-taining directed edges of the formhi;ji between nodesi;j2V and a set of node agest¼ ftiji2Vgwheretiis the age of nodei. The direction of each edgehi;jiis such that ti5tj. The set of nodes is partitioned into two smaller setsYandI, representing then1 internal andnexternal nodes, respectively.
The final element inT is the one that is unique to structured trees and is defined byM¼ f’hi;jijhi;ji 2Eg, where each function
’hi;ji:½ti;tj!Dis piecewise constant and defined such that’hi;ji ðtÞis the type associated with the timeton edgehi;ji 2E. Such a tree is illustrated in Figure 1.
We caution that the term ‘structured tree’ is not a standard name. For instance, elsewhere these objects are referred to as ‘migration-coalescent trees’ (Ewing et al., 2004) or simply as ‘genealogies’ (Beerli and Felsenstein, 1999; Hudson, 1990). Our choice is based on the desire to at once distinguish these trees from regular phylogenetic trees and to extend their applicability beyond the special case of spatial structuring.
2.2 Bayesian inference framework
The goal of the inference scheme discussed here is to characterize the joint posterior probability densityPðE;tY;M;m;m;yjS;tI;LÞ, where tY¼ ftiji2Yg and tI¼ ftiji2Ig are the times of the internal and external nodes,m represents the set of substitution model parameters, m and y are the immigration rate matrix and population size vectors defined later andS¼ fsiji2Ig and L¼ fliji2Igare the sequences and types associated with each of the leaf nodes. The values ofS;tIandLrepresent the data. Fig. 1. A structured tree T ¼ ðV;E;t;MÞ with V¼I[Y where
I¼ fx;y;zg;Y¼ fi;jg,E¼ fhx;ii;hy;ii;hi;ji;hz;jigand the coalescence timestand type mappingsMare as shown. Here we have selected the type setD¼ fblue;red;green;orangeg, although this can be composed of the values of any discrete trait
The inference framework centres around the following expansion:
PðE;tY;M;m;m;yjS;tI;LÞ
/PFðSjE;t;mÞPðE;tY;MjtI;L;m;yÞPðm;m;yÞ: ð1Þ
The first termPFðSjE;t;mÞ is the probability of the sequence alignment and can be efficiently evaluated using Felsenstein’s pruning algorithm (Felsenstein, 1981). The second term captures the joint probability of the genealogy and the type mapping, conditional on the number of samples, their types and the times at which they were recorded, and the demographic model parameters. This is given by the structured coalescent, as discussed below. The final term is the joint prior for all model parameters and can be factorized intoPðmÞPðmÞPðyÞ.
Our goal here is to use MCMC to draw samples from Equation (1), thus allowing us to uncover what the data have to say about the structured tree and the demographic and evo-lutionary model parameters.
2.3 The structured coalescent probability density
The structured coalescent, allowing for serially sampled se-quences as detailed by Ewinget al. (2004), assumes the following demographic model. A discrete set of connected subpopulations Dwith sizesNdford2D are evolving under a Wright–Fisher model in which each generation of lengthgis divided into two stages. In the first stage, each haploid individual in the model migrates from its current location/typedto a new location d0 with probability qdd0g, or remains in the same subpopulation
with probability 1Pd02Dndqdd0g. In the second stage,Nd
indi-viduals are sampled with replacement from the occupants of each subpopulation following stage 1, with the sampled individuals forming the next generation.
To express the probability density of a structured tree under this model, we require the following additional definitions. First, we divide the period spanned by the tree intoBadjacent intervals of lengthst1;t2;. . .;tBsuch thatPBa¼1ta¼trwheretris the age of the root. Each interval is bracketed by a pair of consecutive ‘events’, each of which may be a ‘coalescent’, ‘migration’ or ‘sampling’ event. Coalescent events correspond to internal nodes i2Y, migrations correspond to discontinuities in the type functions ’hi;jiðtÞ and sampling events correspond to leaf nodesx2I. The total number of migration events from thed0 type to thedtype inMis given bynm
dd0, while the total number of
coalescent events (i.e. internal tree nodes) occurring in typedis nc
d. Finally, the number of tree edgeshi;jifor which’hi;jiðtÞ ¼d fort in interval a is given by ka;d. All of this information is readily available fromT as defined previously.
The probability density of the components of the structured tree before conditioning on the sequence data is then given by
PðE;tY;MjtI;L;m;yÞ ¼ exp X B a¼1 ta X d2D ka;d 2 0 @ 1 A1 yd þka;d X d02Dnd mdd0 0 @ 1 A 2 4 3 5 ðmdd0Þn m dd0 1 yd nc d ð2Þ
whereyd¼Ndg are population sizes scaled by the generation length andmdd0 ðyd=yd0Þqd0dare the immigration rates intod
fromd0 (per individual ind0). (This is essentially Equation (3) from Beerli and Felsenstein (2001) but allowing for heterochro-nous leaves.)
The structured coalescent, as well as other models including the reversible Markov model used by Lemeyet al. (2009), im-poses the following additional constraint on the structured tree beyond those laid out in section 2.1: that the type functions for all edges meeting at node i possess the same value at ti. Formally,
’hi;ipiðtiÞ ¼’hicl;iiðtiÞ ¼’hicr;iiðtiÞ ð3Þ
whereip;iclandicrare the parent, left child and right child ofi, respectively.
3 MCMC SAMPLING ALGORITHM
As outlined above, our goal here is to use MCMC to efficiently draw samples from the joint posterior Equation (1) over the state space spanned byx¼ ðE;tY;M;m;m;yÞ. To perform efficiently, MCMC sampling algorithms need to be able to (i) rapidly cal-culate the value of a target distribution for a particular statex and (ii) propose new statesx0that are far enough from the cur-rent state for state space to be explored relatively quickly but not so far that the proposal acceptance rate becomes low.
Much of this problem is solved by existing methods. For re-versible substitution processes, the probability of the sequence alignment given the tree can be efficiently evaluated using the pruning algorithm (Felsenstein, 1981). For inference under the structured coalescent, the density of the structured genealogy can be evaluated very simply by directly applying Equation (2), which scales according to the number of ‘events’ (coalescent, migration and sampling) making up the tree. The prior densities for the parameters (m,m,y) are usually chosen to be standard functions for which numerical evaluation is straightforward. In terms of state proposal, standard proposal distributions for sam-pling distributions over real numbers can be used to propose new parameter combinations.
The remaining component is a set of proposal operators that allow exploration of those regions ofT space that have finite support under the structured coalescent. As noted above, this has been addressed in two distinct ways by Beerli and Felsenstein (1999) and Ewinget al. (2004). Here we introduce a novel set of operators that directly builds on an existing set of unstructured phylogenetic tree operators (Drummondet al., 2002) that form the basis for the phylogenetics package BEAST (Bouckaertet al., 2014; Drummond and Rambaut, 2007; Drummondet al., 2012) and as such have been shown capable of efficiently traversing the space ofðE;tYÞ.
3.1 Structured tree operator design strategy
Our general operator construction strategy involves the following:
(1) the application of an existing unstructured tree operator, mappingðE;tYÞ!ðE0;t
0
(2) the application of an edge type function proposal, which produces type functions ’hi;ji2M0 for a subset of the edgeshi;ji 2E0 to ensure Equation (3) is satisfied at all nodes.
New type functions are proposed by using a backward-in-time continuous-time Markov chain (CTMC) to describe the type-change process along an edge, with the type transition rate matrix fixed to the jointly estimated structured coalescent immi-gration rate matrixm. We define the CTMC in terms of the probability of the edge taking a particular type given the type at the most recent node,pðd;tÞ Pð’hi;jiðtÞ ¼dj’hi;jiðtiÞ ¼diÞ, by way of the following master equation:
d dtpðd;tÞ ¼ X d02D mdd0pðd0;tÞ ð4Þ where we definemdd¼ Pd02Dndmdd0.
Drawing type-space paths from Equation (4) is straightfor-ward (Gillespie, 1976, 1977). However, to ensure Equation (3) is satisfied, we need to be able to draw paths from the CTMC conditioned on the typedianddjat ‘both’ ends of an edgehi;ji. To do this, we use the uniformization-based scheme of Fearnhead and Sherlock (2006). (A useful summary is provided by Rodrigueet al. (2008).)
This method involves defining a ‘uniformized’ version of the process that has a uniform intensity¼maxd½mdd over the length of an edge. This is accomplished by allowing for ‘do noth-ing’ transitions that are not associated with a type change. This means that the number of transition events and the time at which the events occur do not depend on exactly which transitions occur. We can therefore sample these aspects of the type function first.
The number of ‘virtual’ eventsnv, which includes the ‘do noth-ing’ transitions, is distributed according to
Pðnvjdi;djÞ ¼PðnvÞ½R nv di;dj ½em" di;dj ð5Þ where"¼tjti;PðnvÞis a Poissonian with rate parameter"; Ris the stochastic matrixm=þIandem"is a matrix exponen-tial. We sample from this distribution using the technique described in Section 2 of the Supplementary Material, then sample the event times by uniformly selectingnvtimes from the interval [ti,tj] and sorting the result.
The remaining problem of sampling the transition types them-selves is equivalent to sampling paths of a discrete time Markov chain conditional on the end states, and is addressed using the standard forward–backward algorithm (Baumet al., 1970).
One difficulty with this approach is its reliance on the matrix exponential em". Identifying general numerical approaches to matrix exponentiation is known to be problematic (Moler and Van Loan, 2003). We use the scaled Pade´ approximation method as implemented in the Java libraryjblas (http://mikiobraun. github.io/jblas), which generally performs well. However, in our experience it can become unreliable when very large and very small (yet non-zero) migration rates exist in the same matrix. For some data and prior combinations, it may therefore be necessary to temporarily switch to an alternative proposal mechanism when the MCMC chain strays into problematic regions.
3.2 Proposal acceptance probabilities
Non-unitary proposal acceptance probabilities are integral to the Metropolis–Hastings MCMC algorithm. For a given proposal operator op, a proposed statex0is accepted with the probability
aopðx0;xÞ ¼min 1; fðx0Þ fðxÞopðx 0jxÞ ð6Þ wheref(x) is the target density andopðx0jxÞis what we refer to as the Hastings–Green factor (HGF)—a generalization of the usual Hastings ratio to reversible jump MCMC operators (Green, 1995).
To calculate the HGF for each of our new operators, we need to be able to determine the probability density with which a particular type-change path is proposed. This density is given by
Pð’hi;jijdi;djÞ ¼
Pð’hi;jijdiÞ PðdjjdiÞ
ð7Þ
HerePð’hi;jijdiÞis the probability of the CTMC path conditional only on the most recent type, which can be derived directly from Equation (4) and is a simple product of exponential waiting time factors and transition rates. The denominatorPðdjjdiÞis the total transition probability over the length of the edge and may be computed using the same matrix exponential em" used in the previous section.
3.3 Structured tree operators
As described above, the tree-specific operators present in our sampler are straightforward extensions of the unstructured tree operators described by Drummondet al. (2002). They include the following:
The ‘Wilson–Balding’ move (Wilson and Balding, 1998), which disconnects a subtree and reattaches it at a randomly chosen location on the rest of the tree. Our extension re-quires generating a type function for the new connecting edge.
The ‘subtree exchange’ move, which chooses two subtrees and switches the points at which they connect to the rest of tree. Again, our extension requires generating a type func-tion for each of the two new edges.
A ‘node height shifting’ move, which repositions a randomly selected internal node by drawing from a uniform distribu-tion between its oldest child and its parent. Our implemen-tation randomly selects a new type for the selected node and then generates three new type functions—one for each of the connecting edges.
A ‘tree height scaling’ move, which does not alter the top-ology but instead scales the age of each node by a randomly chosen factor. Our extension does not generate new type functions but merely scales the times of the type changes in the same way. This move is also used by Ewing et al. (2004).
In addition, we include a ‘node retype’ operator, which selects a new type for an internal node and generates new type functions
for the connecting edges. (This is a special case of the node height shift move.)
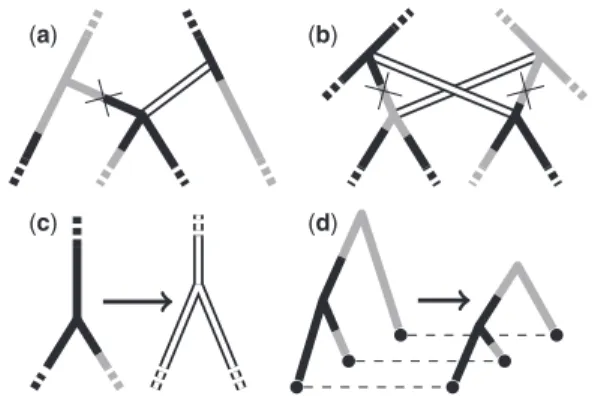
The actions of these operators are illustrated in Figure 2. For complete operator descriptions including HGFs, refer to Section 3 of the Supplementary Material.
4 IMPLEMENTATION
We have implemented the structured tree data structure, the structured coalescent tree density and the structured tree pro-posal operators as a BEAST 2 package. In this section we test the correctness and efficiency of the algorithm and its implementation.
4.1 Validation
In principle, a correctly implemented MCMC algorithm is cap-able of drawing samples from any target density or distribution defined over the state space traversed by its proposal operators. Thus, a good way to test correctness of an operator implemen-tation is to use the implemenimplemen-tation to produce a large number of samples from a target distribution that is either known exactly or can be sampled in some other independent way. Any disagree-ment between the MCMC-generated samples and the true distri-bution, or the externally generated samples from that distribution, is then indicative of an implementation error.
In our case, the structured coalescent density itself [Equation (2)] provides a sensible reference distribution, as its backwards-in-time Markovian structure allows structured trees to be easily sampled via stochastic simulation (Gillespie, 1976). The mean and variance of the root height are also known exactly for two taxon trees (see, for example, Heinet al., 2005), allowing additional testing. Finally, this choice allows us to test the im-plementation of the structured coalescent density.
Comparisons between the tree height and migration event counts obtained using our sampler (2107steps minus 2106 burn-in) and those obtained through 105 direct simulations
generated using MASTER (Vaughan and Drummond, 2013) for trees with five leaves having times 0, 5, 10, 15, 20 and loca-tions 0, 1, 2, 3, 0 in a 4 deme model withyd¼7 and mdd0¼0.05
for alld,d0 are shown in Figure 3. Additional comparisons for smaller sets of operators and against analytical results for the tree height expectations and variances are presented in Section 4 of the Supplementary Material. Together, these results are convin-cing evidence that the operators and structured coalescent dens-ity evaluation have been implemented correctly.
Note that using this package to perform inference from genetic data exploits additional machinery already present in the core BEAST 2 platform. In particular, modules for calculating the likelihood of a tree conditional on available sequence data are used. These modules have been implemented independently and have undergone their own extensive testing, so we do not expli-citly test them here. (Indeed, this is one of the benefits of imple-menting a method using an existing inference platform.) However, many of those components are implicitly tested in the Migrate-n comparison reported below.
4.2 Inference from simulated data
We have applied the implemented sampler to the inference of evolutionary and demographic parameters from simulated sam-pling data to ensure that the inference scheme is capable of recovering the truth in situations where this is knowna priori.
The data simulation procedure involved the following steps. (The relevant BEAST 2 XML files are provided as Supplementary Material.)
(1) A structured coalescent model was chosen with a particu-lar set of types,D, immigration rate matrixmand popu-lation size vectory.
(2) A 128 taxon structured coalescent tree was simulated under this model using MASTER, with times of the leaf nodes spread evenly amongt¼0, 1, 2, 3 and the types of each set of 32 contemporaneous leaves chosen as evenly as possible fromD.
(3) A randomly selected 2 kb nucelotide sequence was evolved down this tree according to the HKY model (Hasegawa et al., 1985) with transition/transversion rate ratio of 3 and base substitution ratem0¼0.005 subst./site/unit time using
(a) (b)
(c) (d)
Fig. 2. Schematics illustrating actions of the tree-specific operators used in our structured tree MCMC algorithm, including structured tree imple-mentations of the (a) Wilson–Balding, (b) subtree exchange, (c) node height shift and (d) tree scaling operators. The solid edge shadings rep-resent the deme to which each lineage belongs at each time. Double white lines represent edges for which new type functions will be proposed as part of the move, crosses represent edges to be removed and dashes represent edges that may continue beyond the schematic boundary
(a) (b)
Fig. 3. Agreement of (a) tree height and (b) migration count distributions sampled from the structured coalescent distribution using our implemen-tation of the described MCMC algorithm (black lines) with those gener-ated via direct simulation (grey lines). See text for more detail
the BEAST 2 alignment simulator, resulting in a simulated alignment of 128 sequences.
(4) The MCMC procedure outlined in the previous section was used to infer the parameters , m0, m and y, with log-normal prior distributions lnN ð0;4Þon each element of these parameters. A total of 108 MCMC steps were generated, with the first 10% being discarded to account for burn-in, resulting in an average effective sample size (ESS) of 1164 (5 and 95% sample quantiles 277 and 2425) for the slowest mixing parameter.
The diagrams in the first column of Table 1 illustrate three different structured coalescent models, with the nodes represent-ing typesD, the numeric labels on the nodes representing values ofy, the edges representing allowed transitions between these types and the numeric labels on the edges representing the values ofm. The simulation and inference procedure was carried out 100 times for each of these models. The four right-most col-umns of the table present the fractions of inference runs that included the truth of the parameter at the head of the column within the 95% highest posterior density (HPD). In the case ofy andm, the average over each of the elements is displayed. Note that in the 4 deme mode, only the non-zero elements ofmwere used to calculate the coverage fraction although all elements were independently estimated.
Section 5 of the Supplementary Material describes these results in more detail. An important message to convey here is that increasing the number of demes without increasing the available data can have strong negative effects on the amount of signal that can be recovered. For this reason, while the sampler itself is capable of sampling from structured tree distributions with higher numbers of demes (as shown in Section 5.2 of the Supplementary Material), doing so requires additional con-straints on the model. In our experience, 3–4 demes seems to be an upper limit for inference from a 128 taxon dataset if all mi-gration rates are to be reliably estimated (given non-informative priors).
4.3 Comparison with Ewinget al., 2004
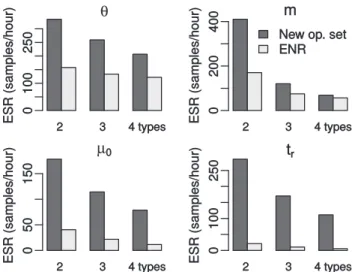
To compare the new structured tree operators with those of Ewinget al. (2004), we have implemented the operators described in that paper in our BEAST 2 package and used them to analyse the same simulated data sets described above. As each set of operators is capable of traversing the structured tree state space, there should be no difference in the inference results ob-tained by each set given sufficient MCMC steps. However, as discussed in Section 3, the specific proposal distributions used can have a significant impact on the rate at which the Markov chain produces effectively independent samples from the target distribution. This rate can be quantified using the inverse of the integrated auto-correlation time (IACT): the number of effect-ively independent samples (i.e. the ESS) generated per iteration of the MCMC algorithm. While IACT is usually expressed in terms of MCMC iterations, we use the total computation times used by each inference run to express it in terms of real time. This ‘effective sample rate’ (ESR) allows us to directly compare the computational efficiency of our proposal operators with those of Ewinget al. (2004), despite the fact that their operators are individually less computationally demanding. Such rates will depend on the specific hardware used to perform the computa-tions, of course, but useful comparisons can still be made pro-vided the same hardware is used across all analyses.
Figure 4 shows how the ESRs for demographic (y and m), evolutionary (m0) and genealogy-related (time of most recent common ancestor, tr) parameters depend on the number of types,jDj, and the operator set used. Two features are immedi-ately obvious. Firstly, there is a clear decline in ESR as the number of types increases, which is to be expected due to the corresponding increase in the size of the state space. Secondly, the ESR estimates obtained from the new proposal operators are greater than those obtained using our implementation of the operators proposed by Ewinget al. (2004). This improvement Fig. 4.ESRs per hour of MCMC calculation recorded from the simu-lated data analyses using both the new proposal operators and our im-plementation of those developed by Ewinget al.(2004) (ENR), whereyis the vector of population sizes,mis the immigration rate matrix,m0is the clock rate andtr is the age of the root. Values for the vector/matrix parametersyandmwere averaged across all elements
Table 1.95% HPD coverage fractions for demographic (population sizes
y, immigration ratesm) and evolutionary parameters (clock ratem0, tran-sition/transversion ratio) inferred from simulated sequence data under structured population models with different numbers jDj of subpopulations Model jDj ycoverage (%) mcoverage (%) m0coverage (%) coverage (%) 2 95.5 96 97 98 3 92.3 93.7 92 97 4 93.5 86 96 96
is particularly striking in the case of thetrparameter, for which our method produced at least an order of magnitude as many effective samples per unit time as our implementation of the previously published method.
We therefore find that the new operators presented here gen-erally outperform our implementation of the Ewinget al. (2004) operators, in spite of the additional computational complexity of our proposals.
4.4 Comparison with Migrate-n
Migrate-n (Beerli and Felsenstein, 1999, 2001; Beerli, 2006) has long been a popular tool for performing both Bayesian and max-imum-likelihood analysis under the structured coalescent. There are numerous differences between the MCMC sampler presented here and Migrate-n: we focus on providing the capability to per-form joint estimation of heterochronous structured trees, demo-graphic model parameters and substitution model parameters, while Migrate-n excels at demographic model parameter infer-ence for trees with fixed clock rates or times expressed relative to an unknown substitution rate.
Despite this, it is possible to analyse some datasets under exactly equivalent assumptions in both packages. In Section 6 of the Supplementary Material, we directly compare sampled posteriors obtained for model parameters from heterochronous sequence datasets simulated under 2 and 3 deme models, assum-ing a known clock ratem0, and find perfect agreement. Given the complete independence of these implementations, this is ex-tremely strong evidence that both samplers are implemented correctly.
4.5 Application to global influenza epidemics
To assess the usefulness of our sampling strategy and its imple-mentation in the context of real genetic data, we address the problem of inferring global dynamics of influenza epidemics from genetic data. To do this, we assembled 980 H3N2 1.6kb HA sequences from NCBI GenBank, which were isolated from humans in Hong Kong (n¼220), New York (n¼320) and New Zealand (n¼440) between the years 2000 and 2006. (Accession numbers, sampling times and locations are tabulated in the Supplementary Material.) These locations were chosen to be rep-resentative of northern, southern and equatorial regions having human population sizes of comparable order of magnitude, while the sampling time boundaries were chosen to ensure a roughly even temporal and spatial distribution of samples. Additionally, these locations and times allow comparison with the study of global H3N2 dynamics conducted by Bedfordet al. (2010).
The data were analysed under a 3 deme structured coalescent model with a GTRþnucleotide substitution model and a strict molecular clock. As for the simulated data, the heterochronous sampling times and rapid evolution of influenza allowed for joint estimation of the clock rate,m0. Broad log-normal priors logN ð0;4Þwere used for all population size and rate parameters. Due to the large size of the data set, the MCMC algorithm was run for 3.7108iterations to ensure adequate mixing, giving a ‘min-imum’ ESS across the sampled parameters of150. Two add-itional chains of 3.3108 iterations each were run to assess convergence. (See Section 7 of the Supplementary Material for details, the full set of results and ESS estimates.)
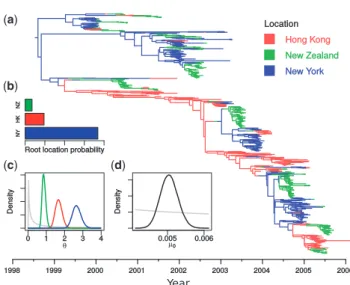
Figure 5 summarizes some of the results of this analysis, including the maximum sampled posterior tree, and posterior distributions for the root location, the subpopulation sizes y and the molecular clock ratem0. Assuming a constant generation time, the differences between elements ofyreflect differences in effective population sizes of the virus populations. It is therefore interesting that the order of these sizes corresponds to the order-ing of the human population sizes: New Zealand (smallest), Hong Kong, New York (largest). Furthermore, the estimated base mutation rate m0’5103 substitutions/site/year [95% HPD interval ð4:5103;5:5103Þ] is in line with previous estimates for the HA gene (Rambautet al., 2008). The placement of the root of the maximum sampled posterior tree in New York is in agreement with the posterior probability distribution of the root location (Fig. 5b). This may seem contrary to conventional wisdom that Asia provides the source for seasonal influenza epi-demics (Russellet al., 2008). However, the location of the root is very much a function of the particular dataset used. Furthermore, our result is in line with the results of Bedford et al. (2010) who applied a hierarchical approach to a much larger dataset and found that the ‘trunk’ location of their sampled H3N2 transmission tree was likely also within the USA at the time of the root of our tree (mid 1998).
5 DISCUSSION
Taken together, the results above are strong evidence that our new algorithm and its implementation are correct, computation-ally efficient and capable of analysing large datasets. However, the algorithm presented here does not address problems that are fundamental to the structured coalescent. As discussed in detail by Ewing et al. (2004), the structured coalescent tree density
(a)
(b)
(c) (d)
Fig. 5. Summary of results from spatial H3N2 influenza analysis, includ-ing (a) the 980 taxon maximum sampled posterior structured tree, the sampled posterior probability distributions for (b) the root location, (c) the subpopulation sizes and (d) the base substitution rate (substitu-tions/site/year). The grey lines in (c) and (d) show the visible portions of the logN ð0;4Þprior used for all of these parameters, scaled vertically for clarity
[Equation (2)] can yield improper posterior densities for elements of the migration rate and population size parameters when un-informative priors are used. In our experience, this can still lead to slow mixing with proper but broad priors. In such cases, we suggest following the advice of Ewinget al. (2004) by imposing sensible upper and lower bounds on the demographic parameters whenever known.
There are many possible extensions to this work. Firstly, as we discuss in Section 1 of the Supplementary Material, other models involving structured trees exist beyond the structured coalescent. Some of these are likely to be particularly important in the field of viral phylodynamics, where the overlapping epidemiological and evolutionary time scales mean that birth–death sampling models (Stadler, 2008) or generalized coalescent processes (Volz, 2012) are needed to explain the sequence data. Developing, implementing and testing the performance of our proposal operators on spatial extensions to these models will therefore be an important area of future research.
Secondly, the problem of summarizing large numbers of struc-tured trees sampled from posterior distributions requires special attention. While existing techniques for summarizing phylogen-etic tree distributions [Felsenstein (2003) provides a good review] allow for the un-typed component of the trees in the sampled set to be summarized, this discards useful information. In our influ-enza analysis we chose to use the sampled structured tree with the HPD. While retaining type information, this approach is also suboptimal because it gives no indication of the uncertainty asso-ciated with the type-change paths depicted.
The BEAST 2 package implementing the algorithms discussed in this article and used in the analyses may be found at http:// compevol.github.io/MultiTypeTree, together with an example analysis and a tutorial. The software source code is available under the GNU General Public License and is highly extensible, making third-party implementation of further structured tree models practical.
ACKNOWLEDGEMENTS
The authors also wish to acknowledge the contribution of the NeSI high-performance computing facilities and the staff at the Centre for eResearch at the University of Auckland. The authors thank Peter Beerli for helpful comments and suggestions. Funding: The work was supported by the Allan Wilson Centre for Molecular Ecology and Evolution (to T.G.V. and A.P.); Royal Society of New Zealand Marsden grant [UOA0809 to D.K. and A.J.D.]; Rutherford Discovery Fellowship from the Royal Society of New Zealand (to A.J.D.).
Conflict of Interest: none declared.
REFERENCES
Baum,L.E.et al. (1970) A maximization technique occurring in the statistical ana-lysis of probabilistic functions of Markov chains.Ann. Math. Stat.,41, 164. Bedford,T.et al. (2010) Global migration dynamics underlie evolution and
persist-ence of human influenza A (H3N2).PLoS Pathog.,6, e1000918.
Beerli,P. (2006) Comparison of Bayesian and maximum-likelihood inference of population genetic parameters.Bioinformatics,22, 341–345.
Beerli,P. and Felsenstein,J. (1999) Maximum-likelihood estimation of migration rates and effective population numbers in two populations using a coalescent approach.Genetics,152, 763–773.
Beerli,P. and Felsenstein,J. (2001) Maximum likelihood estimation of a migration matrix and effective population sizes in n subpopulations by using a coalescent approach.Proc. Natl Acad. Sci. USA,98, 4563–4568.
Bouckaert,R.et al. (2014) BEAST 2: a software platform for Bayesian evolutionary analysis.PLoS Comp. Biol.,10, e1003537.
Drummond,A.J. and Rambaut,A. (2007) BEAST: Bayesian evolutionary analysis by sampling trees.BMC Evol. Biol.,7, 214.
Drummond,A.J.et al. (2006) Relaxed phylogenetics and dating with confidence. PLoS Biol.,4, e88.
Drummond,A.J.et al. (2002) Estimating mutation parameters, population history and genealogy simultaneously from temporally spaced sequence data.Genetics, 161, 1307.
Drummond,A.J.et al. (2012) Bayesian phylogenetics with BEAUti and the BEAST 1.7.Mol. Biol. Evol.,29, 1969–1973.
Ewing,G.et al. (2004) Using temporally spaced sequences to simultaneously esti-mate migration rates, mutation rate and population sizes in measurably evolving populations.Genetics,168, 2407–2420.
Fearnhead,P. and Sherlock,C. (2006) An exact Gibbs sampler for the Markov-modulated Poisson process.J. R. Stat. Soc. Ser. B,68, 767.
Felsenstein,J. (1981) Evolutionary trees from DNA sequences: a maximum likeli-hood approach.J. Mol. Evol.,17, 368–376.
Felsenstein,J. (2003)Inferring Phylogenies. Sinauer Associates, Massachusetts. Gillespie,D.T. (1976) A general method for numerically simulating the stochastic
time evolution of coupled chemical reactions.J. Comp. Phys.,22, 403. Gillespie,D.T. (1977) Stochastic simulation of coupled chemical reactions.J. Phys.
Chem.,81, 2340.
Green,P. (1995) Reversible jump Markov chain Monte Carlo computation and Bayesian model determination.Biometrika,82, 711–732.
Grenfell,B.T.et al. (2004) Unifying the epidemiological and evolutionary dynamics of pathogens.Science,303, 327–332.
Hasegawa,M.et al. (1985) Dating of the human-ape splitting by a molecular clock of mitochondrial DNA.J. Mol. Evol.,22, 160–174.
Hein,J. et al. (2005) Gene Genealogies, Variation and Evolution: a Primer in Coalescent Theory. Oxford University Press, New York.
Hudson,R.R. (1990) Gene genealogies and the coalescent process.Oxf. Surv. Evol. Biol.,7, 1.
Kingman,J.F.C. (1982) On the genealogy of large populations.J. Appl. Probab.,19, 27.
Ku¨hnert,D.et al. (2011) Phylogenetic and epidemic modeling of rapidly evolving infectious diseases.Infect. Genet. Evol.,11, 1825–1841.
Lemey,P.et al. (2009) Bayesian phylogeography finds its roots.PLoS Comput. Biol., 5, e1000520.
Moler,C. and Van Loan,C. (2003) Nineteen dubious ways to compute the exponen-tial of a matrix, twenty-five years later.SIAM Rev.,45, 3–49.
Notohara,M. (1990) The coalescent and the genealogical process in geographically structured population.J. Math. Biol.,29, 59–75.
Pannell,J.R. (2003) Coalescence in a metapopulation with recurrent local extinction and recolonization.Evolution,57, 949–961.
Rambaut,A.et al. (2008) The genomic and epidemiological dynamics of human influenza A virus.Nature,453, 615–619.
Rodrigue,N.et al. (2008) Uniformization for sampling realizations of Markov pro-cesses: applications to Bayesian implementations of codon substitution models. Bioinformatics,24, 56–62.
Russell,C.A.et al. (2008) The global circulation of seasonal influenza a (H3N2) viruses.Science,320, 340–346.
Sanderson,M.J. (2002) Estimating absolute rates of molecular evolution and diver-gence times: a penalized likelihood approach.Mol. Biol. Evol.,19, 101–109. Stadler,T. (2008) Lineages-through-time plots of neutral models for speciation.
Math. Biosci.,216, 163–171.
Thorne,J.L.et al. (1998) Estimating the rate of evolution of the rate of molecular evolution.Mol. Biol. Evol.,15, 1647–1657.
Vaughan,T.G. and Drummond,A.J. (2013) A stochastic simulator of birth-death master equations with application to phylodynamics. Mol. Biol. Evol., 30, 1480–1493.
Volz,E.M. (2012) Complex population dynamics and the coalescent under neutral-ity.Genetics,190, 187–201.
Volz,E.M.et al. (2013) Viral phylodynamics.PLoS Comput. Biol.,9, e1002947. Wilson,I.J. and Balding,D.J. (1998) Genealogical inference from microsatellite data.