5
Contents
Preface
1. Introduction 9
Part I: Scope and Methodology 13
2. Ageing: a global problem 13
2.1 Ageing in the Netherlands 13
2.2 Ageing abroad 15
2.3 Consequences of ageing for participation and GDP 19
2.4 Policy responses 20
2.5 Saving, investment, and interest rates 20
2.6 International labour markets (migration) 22
2.7 Conclusions 22
3. How to measure sustainability of public finances? 23
3.1 Sustainability 23
3.2 Intergenerational distribution 28
3.3 Equity and efficiency 31
3.4 Intergenerational risk sharing 35
3.5 Long term projections 37
Appendix 38
Part II: Budgetary consequences of ageing 41
4. Long-term projections for the government budget 41
4.1 The assumptions in the base-case scenario 41
4.2 Future public finances under base-case assumptions 53
4.3 The effect on generations 61
4.4 Sketching future shifts in economic aggregates 62
Appendix 64
5. Sensitivity analysis 67
5.1 Changes in assumptions 67
5.2 The robustness of the policy recipes 72
Part III: Policies to cope with ageing 77
6. Budgetary policies 77
6.1 Other budgetary measures to close the gap 77
6.2 Higher productivity growth with lagging expenditure 78
6.3 Effect of a later policy adjustment 78
6.4 Alternative forms of fiscal response 80
7. Increasing labour force participation 85
7.1 Women 86
7.2 Older persons 88
7.3 Low-skilled persons 94
7.4 A number of policies and their effect on sustainability 95
8. Does ageing affect pensions? 99
8.1 Increasing life-expectancy 100
8.2 Increasing vulnerability to shocks 103
8.3 Policy options 104
8.4 A rise in the statutory retirement age for public pensions 105
Appendix 108
9. Reforming healtcare 113
9.1 The Dutch healthcare scheme 114
9.2 Solidarity in the healthcare scheme 116
9.3 Efficiency in the healthcare scheme 116
9.4 The implications of ageing 117
9.5 Policy options 118
9.6 Two policy scenarios 120
10. Conclusion 123
10.1 The problem of ageing 123
10.2 Uncertainties 125
10.3 Debt policy and intergenerational equity 127
10.4 National life cycle 128
10.5 Other policy options 129
10.6 Intergenerational risk sharing 132
7
Preface
Ageing will be one of the major policy issues in the decades to come. Widespread is the growing awareness that the issue of ageing requires timely and adequate reactions in fiscal policies. On the brink of a new century, and now that public finances seem under control, policymakers in the Netherlands have the opportunity to look in the more distant future, and consider the consequences that ageing may have for the Dutch economy C and public finances in particular. This study provides a comprehensive analysis of the economic consequences of ageing in the Netherlands. It focuses on the government budget, but also considers the impact of ageing on important sectors as healthcare and the pension system.
This study has greatly benefited from the input of many people. As part of the preparation for this document, CPB organised several workshops on specific areas. Contributions by Joop de Beer (Statistics Netherlands) on demographic projections for the Netherlands, and Evert van Imhoff (Netherlands Interdisciplinary Demographic Institute, NIDI) on economic and socio-cultural impacts on demography and participation, are gratefully acknowledged. In addition to the main authors, many people inside and outside CPB contributed to this study. Arjan Lejour and Guido van Steen contributed to the international analysis in Chapter 2, Hans Roodenburg provided many valuable comments (and a box) on labour market and participation issues, and Adri den Ouden, who did an excellent job on the demographics, is the author of the appendix to Chapter 4. Ruud Okker and Gilbert van Hagen contributed in many ways to the analysis. Arie van der Giessen assisted with computational programming, and Ria van der Hoorn and Erwin Zijleman handled the layout. Finally, the study greatly benefited from the ideas and comments of CPB advisors, Lans Bovenberg and Sweder van Wijnbergen, and of the representatives of different ministries in our advisory committee.
Henk Don Director
9
Chapter 1 Introduction
The demographic shift between generations due to ageing will have a considerable impact on society. In particular, it may put current arrangements for public pensions and healthcare under pressure. When the number of workers declines, who is going to pay for the taxes needed to finance government expenditures for the old? Is the burden of ageing going to be shifted to future generations, and will they be able and willing to pay for these taxes? These questions reflect the concern about ageing, and are central in this study on the consequences of ageing in the Netherlands.
Ageing will dramatically change the balance between young and old generations in the coming decades. In the Netherlands, the share of elderly persons (aged 65 years and older) in the total population will increase from 14% at present to 23% in 2040. This is due to a dramatic decline of fertility (baby bust) in the 1960s and 1970s, together with a steady increase in life expectancy. After 2040, the share of elderly people in the population will remain high.
This trend will have significant consequences for the government budget and social security. The share of public pensions (AOW) and healthcare in the government budget is expected to increase from 26% at present to 38% in 2040 as a result of the growing number of old people. This will put pressure on the government budget, and may lead to growing deficits and increasing public debt if no proper fiscal policies are installed in due course. A major issue is the impact of ageing on the intergenerational distribution of income. Who is going to pay for the costs of ageing? Will the burden be shifted to future generations, or will present generations also contribute to the cost of ageing by adjusting fiscal policies in a timely manner?
Sustainability of public finances is the main focus of the study. The central question is whether current public arrangements can be maintained in the future without the government running into financial problems, and without shifting the burden to future generations. More specifically, the study aims to do the following:
1. To assess the burden of ageing upon public finances in the Netherlands. Are current arrangements sustainable without having to raise taxes in the future? The study is comprehensive: it considers the impact of demography on the government budget, taking account of the age profile of public expenditures and (tax) revenues. It does this against the background of a stylised long-term path for the Dutch economy for the 21st century, focussing on demography, labour market participation, pensions and healthcare.
2. To explore ways to tackle the challenges imposed by the ageing phenomenon. Are future generations going to pay for the costs of pensions and care for the elderly, or is it possible to anticipate the situation by starting to save now? To what extent could and should other policies contribute? Is there scope for policies to increase participation? Special attention is paid to the pension system and healthcare.
3. To assess the impact of different policies on the distribution of income over generations.
4. To consider whether current arrangements for intergenerational risk sharing (i.e. pensions and healthcare) are at risk when the burden for future generation increases. 5. To assess the main uncertainties underlying the long-term projections, and their
implications for policy. What is the best way to cope with these risks?
The focus on public finance implies a serious limitation in the scope of this study, as it is only a small facet of intergenerational relations. Transfers within the private sector, within households, and through knowledge and environmental stocks remain outside the scope of this study. Furthermore, this study looks forward only. Not analysed here are current generations’ past net contributions made to the government. This restricts the analysis of the intergenerational distribution, as it is not possible to compare equity between current and future generations over their entire lifetimes.
The study is built up in three parts.
Part I starts by sketching the problem of ageing in the Netherlands in a global context
in Chapter 2. It is shown that ageing is a worldwide phenomenon, covering not only the OECD, but also the non-OECD countries. Ageing will significantly reduce per capita growth. The impact on the interest rate is ambiguous, however, as both investment and savings fall.
Chapter 3 discusses long-term aspects of budgetary policies, and discusses the methodology for analysing the sustainability of public finance. It introduces the criteria for solvency and efficiency of the government budget. An important principle for efficiency is ‘tax smoothing.’ As the government has insufficient instruments to influence the intergenerational distribution, it might face a trade-off between efficiency and equity between generations. Pay-as-you-go arrangements play an important role in intergenerational risk sharing. These arrangements exist not only in public pensions, but also in healthcare and private (second-pillar) pensions, for example. Does ageing pose a risk for these arrangements?
Part II constructs long-term projections for the government budget and analyses the
consequences of ageing in Chapter 4. Using the age profile of public expenditure and long-term projections for government revenue, the study establishes under what conditions public finance is sustainable in the long run. It is shown that sustainability can be gained if policy in the Netherlands aims at a budget surplus for a longer period in order to reduce public debt and interest payments on public debt. In order to assess the robustness of these policy implications, Chapter 5 performs a sensitivity analysis for the major determinants of these projections, i.e. demography, participation, productivity growth, the interest rate, and healthcare costs.
I NTRODUCTI ON 11
Finally, Part III considers alternative policies to cope with ageing in four important
areas: budgetary policy, participation, healthcare and pensions. Chapter 6 considers alternative fiscal policies, and discusses their consequences for efficiency as they deviate from tax smoothing and their impact on the intergenerational distribution. Increasing labour participation can be an effective means to alleviate the burden of ageing. Options to do so are discussed for two major groups with relatively low participation: women and older persons (Chapter 7). Ageing does affect the pension system in several ways. An increase in life expectancy raises pension costs, and ageing changes the balance between generations, thus reducing the possibilities to absorb unanticipated shocks (Chapter 8). Healthcare can be restructured in many ways all having their specific effect on future costs for government. Two variants of such a restructuring are considered (Chapter 9). Chapter 10 concludes.
This study reflects the growing awareness that ageing requires timely and adequate reactions in fiscal policies. For the Netherlands, the WRR (the Dutch Scientific Council for the government) has already performed a broad interdisciplinary study on ageing (WRR, 1999). Recently, both the European Union (EU) and the OECD started major projects to establish the budgetary consequences of ageing in their member countries. The present study may serve to provide background to the results for the Netherlands in these projects. There may be differences between the results presented here and in these international studies, due to methodological differences (see also the appendix to Chapter 7 for differences in demographic projections). As the EU and OECD studies aim at a wide coverage of countries, they necessarily have to compromise on ambition with regard to method and institutional detail. This study, therefore, also complements these international studies by focussing on the specific details of the ageing problem in the Netherlands.
This study builds on earlier work on generational accounts for the Netherlands by ter Rele (1998) and Bovenberg and ter Rele (1999, 2000), as well as on the long-term budgetary prospects by van Ewijk and ter Rele (1999). It largely follows the methodology developed in these earlier studies. This study, which is based on the most recent data available in the Summer of 2000, is wider in scope, and goes into more detail in a number of areas healthcare, participation, and the pension system, in particular.
13 1900 1910 1920 1930 1940 1950 1960 1970 1980 1990 2000 2010 2020 2030 2040 2050 45 50 55 60 65 70 75 80 85 men women
Figure 2.1 Life-expectancy at birth of men and women
PART I SCOPE AND METHODOLOGY
Chapter 2 Ageing: a global problem
This chapter sketches the problem of ageing in the Netherlands. It argues that ageing stems not only from the ageing of the baby-boom generations, but also from declining fertility rates and decreasing mortality rates. Ageing thus implies a permanently older population structure. This chapter also demonstrates that ageing is a world wide phenomenon, covering not only the OECD but also the non-OECD countries.
2.1 Ageing in the Netherlands
Several factors contributed to the ageing of the population in the last three decades. Important factors were the decline in fertility rates and the increase in life expectancy. The effect of these factors has been that the elderly dependency ratio, defined as the number of 65+ as a percentage of the 20- to 64-year olds, gradually increased from 19 percent in 1970 to its current level of 22 percent.
1900 1910 1920 1930 1940 1950 1960 1970 1980 1990 2000 2010 2020 2030 2040 2050 1 1.5 2 2.5 3 3.5 4 4.5
Figure 2.2 Total fertility rate in the Netherlands
The increase in life expectancy, i.e. the fall in mortality rates, is the first factor contributing to the ageing process. Figure 2.1 shows life expectancy at birth of men and women. In 1900, life expectancy at birth in the Netherlands was 49 years for men and 52 years for women. However, high infant mortality rates in the beginning of the century depressed life expectancy at birth significantly. This follows from the life expectancy of a one year old. The life expectancy of a one-year-old man and women in 1900 was 60 and 62 years respectively. Thus, if one survived the first year, life expectancy rose by 11 years for a man and 10 years for a woman. Nowadays the effect of infant-mortality on life expectancy at birth is seriously diminished. Surviving the first entails an extra expected lifetime of less than 6 months.
In 2000 life expectancy at birth has gone up to respectively 75 and 81 years. Statistics Netherlands assumes between 2000 and 2050 a further increase to 80 years for men and 83 years for women. Striking is the strong increase for women during the last fifty years. Before World War II life expectancy of women was only 2 years higher than that of men, but after the war life expectancy of women showed a steep increase while the comparable increase for men was quite modest. By 1990, the difference in life-expectancy had grown to more than 6 years.
A G E I N G: A G L O B A L P R O B L E M 15
Figure 2.2 shows the development of the total fertility rate in the Netherlands since 1900. It shows the drop in the fertility rate in the pre-war period, the baby-boom after World war II and the baby-bust starting in the sixties and lasting till today. And while in the average family the number of children fell from about 4 some hundred years ago to 1½ nowadays, also in the population at large the number of young people caring for the elderly is about to fall dramatically. This decline in fertility rates is the main factor contributing to the ageing of the population, and this process will speed up as soon as the baby-boom generation starts to retire.
For the coming decades, demographic forces will continue to affect the structure of the population. First of all, the occurred decline in fertility rates will continue to affect the age structure of the population for several decades. In addition, life expectancy is expected to keep increasing, due to a further decline of mortality rates. Moreover, the baby boom generations are now close to retirement. As a result, the elderly dependency ratio is expected to increase to a peak level of 43% around 2040. After 2040, it will decline as the baby boom generations pass away. This decline is relatively small and does not bring the elderly dependency ratio back to its original level; rather, it may stabilise at a level of around 40%.
2.2 Ageing abroad
Population ageing is occurring not only in the Netherlands, but in many countries around the world. World-wide one can observe a trend of decreasing fertility rates, partly as a response to economic progress. In addition, economic progress enables countries to invest in health services and hygiene, which raises life expectancy. For some countries, among which the Netherlands, the retirement of the baby-boom generations S although transient S is also an important factor. The international aspects of ageing are important for at least two reasons. First of all, the fundamental challenges of funding social security and health care systems are very similar in societies with growing cohorts of older people, although specific demographic circumstances and details of related policies differ across countries. This enables us to compare the effects of ageing in various countries and to learn from the different policy options under investigation. A second reason is that countries participate in a globalising world. International linkages on goods, services, capital and labour markets may strengthen or weaken the ageing process in other countries.
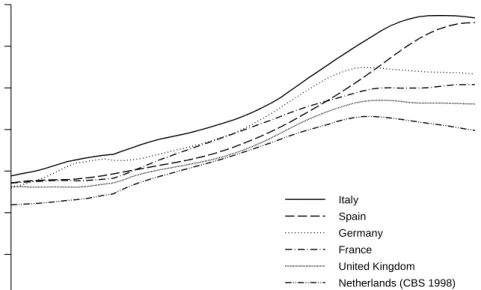
Figure 2.3 illustrates the expected demographic transition in the five largest EU countries and the Netherlands: a sharp increase in the elderly dependency ratio. In some sense this dependency ratio is a misleading measure because more and more elderly people remain healthy and keep on working after their 65th, thus keeping their economic independence. Participation rates among older Japanese workers for example have risen between 1987 and 1995. Hence, changes in the elderly dependency ratio may sometimes
1
Forecasts until the middle of the 21st century are subject to wide margins of error.
year 2000 2005 2010 2015 2020 2025 2030 2035 2040 2045 2050 0 0.1 0.2 0.3 0.4 0.5 0.6 0.7 Italy Spain Germany France United Kingdom Netherlands (CBS 1998)
Figure 2.3 Elderly dependency ratios in selected EU-countries
proxy only imperfectly for the participation effects of demographic changes which it is supposed to measure. As better alternatives seem to be lacking and in order to stay in
Source: Eurostat (2000), but for The Netherlands: CBS (1998).
line with other studies on ageing however, we will stick to the use of the elderly dependency ratio in this study.
According to EU (1999) the population of the EU countries will have shrunk from 372 million in 1995 to 367 million in 2050. By then, the population structure will be completely different. The elderly dependency ratio will have risen from its current level of 27% to a level of 53% in 2050, as can be seen in Table 2.1. The variation between EU countries will also increase. Ireland’s 19% ratio is nowadays the smallest in the EU. Sweden’s 30% ratio is currently the highest. By the year 2050 the variation within the EU is expected to be between 40 and 67%. By then Italy will have the highest elderly dependency ratio and the Netherlands the lowest ratio.1 Ageing also occurs rapidly in Spain, while it will be less pronounced in the United Kingdom.
The current relatively low percentage of persons aged 65 or over in the Netherlands can be explained by the fact that the post-war baby boom continued longer than in most
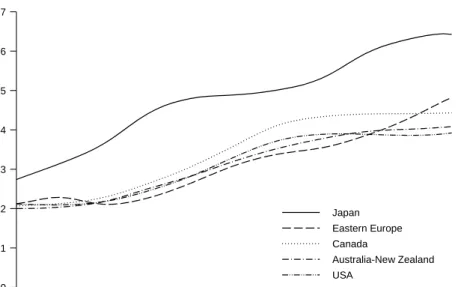
A G E I N G: A G L O B A L P R O B L E M 17 2 See De Beer (1996). year 2000 2005 2010 2015 2020 2025 2030 2035 2040 2045 2050 0 0.1 0.2 0.3 0.4 0.5 0.6 0.7 Japan Eastern Europe Canada Australia-New Zealand USA
Figure 2.4 Elderly dependency ratios in other OECD-countries
other countries.2 In the period 2000-2035 the elderly dependency ratio in the Nether-lands shows an increase comparable with developments in other countries. Afterwards the Dutch dependency ratio decreases somewhat, in line with the decline in Germany and the UK. One of the contributing factors is the age composition of immigration and emigration: immigrants are relatively young, while emigrants are relatively old (on average).
Table 2.1 Elderly dependency ratios in EU
2000 2050 2000 2050 Belgium 0.28 0.50 Luxembourg 0.23 0.42 Denmark 0.24 0.42 Netherlands 0.22 0.40 Germany 0.26 0.53 Austria 0.25 0.55 Greece 0.28 0.59 Portugal 0.25 0.49 Spain 0.27 0.66 Finland 0.24 0.48 France 0.27 0.51 Sweden 0.30 0.46
Ireland 0.19 0.44 United Kingdom 0.26 0.46
Italy 0.29 0.67 EU-15 0.27 0.53
Source: Eurostat 2000, but for The Netherlands: CBS 1998
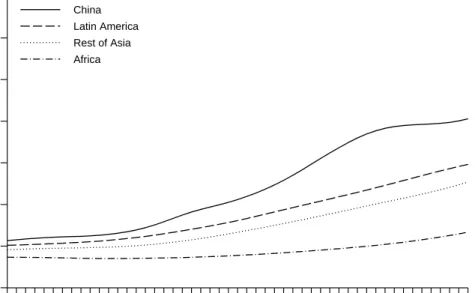
year 2000 2005 2010 2015 2020 2025 2030 2035 2040 2045 2050 0 0.1 0.2 0.3 0.4 0.5 0.6 0.7 China Latin America Rest of Asia Africa
Figure 2.5 Elderly dependency ratios in non-OECD-countries
Japan will also face serious consequences of ageing. In Figure 2.4, Japan’s elderly dependency ratio can be seen to rise in a fast way, more or less comparable to what is expected to happen in Spain and Italy. The rise in the US elderly dependency ratio is more moderate. It lags approximately 30 years behind the European and Japanese ratios. The pace at which ageing takes place in Canada and in Australia - New Zealand is also relatively slow. It is in the range of what is observed in Denmark and Sweden. Moreover, the Canadian elderly dependency ratio seems to stabilise between 2030 and 2050. In this period the Eastern European ratios increase sharply.
For most non-OECD countries ageing will not become a serious problem until the second half of this century. Figure 2.5 shows the elderly dependency ratios for several non-OECD regions. In 2000 these ratios are low compared to what is observed in OECD countries.
Source: UN (1998).
In all regions the ratios will rise. The rise is modest in Africa, where the ratio will hardly exceed 10% in 2050. However, it is much more pronounced in China, where ageing will have become a serious problem in 2050. In the other regions the elderly dependency ratio will have reached a level that is common in most OECD countries now.
A G E I N G: A G L O B A L P R O B L E M 19
2.3 Consequences of ageing for participation and GDP
The OECD study of Turner et al. (1998) predicts that the increase in dependency ratios in the US, Europe and Japan will lower per capita GDP by approximately 10, 18 and 23% respectively in 2050 compared to a baseline in which dependency ratios remain at their current levels. The EU (1999) study reports similar results. The ranking of the GDP effects reflects the expected speed of ageing in the various regions. In Japan the process of ageing starts earlier than in Europe and the United States, as is shown in Figures 2.3 and 2.4.
Within Europe there are pronounced differences (EU 1999). On average ageing will lower annual per capita growth by about 0.4 percentage points until 2050. In Sweden and the United Kingdom the average effect is just about 0.3 points, whereas it is approximately 0.5 points in the Southern EU member states and in Ireland.
The reason for lower GDP growth per capita is that higher elderly dependency ratios imply a relative contraction of the labour force. The EU study clearly shows that GDP growth declines faster in countries that experience a sharper increase in elderly dependency ratios. A growth-accounting exercise also shows that the reduction in GDP growth is mainly caused by a reduced growth in labour inputs. This explains about 70% of the decline in GDP growth. The remainder of the decline stems from a reduced pace of capital accumulation.
Despite these effects, the impact of ageing upon other macroeconomic variables may be rather small. In particular, the effect upon the interest rate and the wage rate may be close to zero. A serious objection may be that ageing is a global phenomenon however. On the one hand, the world interest rate may decline due to smaller investment needs; on the other hand, it may increase as older people save less and an ageing population thus reduces the saving rate. Our benchmark assumption is that the world interest rate will remain unaffected. As the interest rate and wage rate are inversely related, the same holds true for the wage rate.
A different question concerns the impact of ageing for fiscal variables. In particular, the decline in labour market participation may reduce tax revenues, whereas the increase in the number of retirees may boost the expenditure on pensions and health care. It is this combination which has led many to question the sustainability of current fiscal arrangements. This question has been explored for a number of OECD countries. Most of these studies are generational accounting exercises. Auerbach, Kotlikoff and Leibfritz (1999) collect the main results of these generational accounting exercises constructed in 1996 and 1997. Most of the studies summarised find that current fiscal policies are unsustainable. Exceptions are Thailand, New Zealand and Sweden. Whether ageing makes Dutch fiscal institutions unsustainable, will be investigated thoroughly in the next chapters.
2.4 Policy responses
In the EU and OECD calculations of the macroeconomic effects of ageing it is assumed that governments do not take any policy action towards ageing. Policy action could reduce the negative consequences of ageing for economic growth. The EU and OECD studies assess the consequences of potential policy responses to a fall in per capita GDP growth rates. These responses are directed towards shifts in the government budget, toward labour market reforms, and toward productivity increases, respectively.
A government that does not allow an increasing deficit would either have to increase its tax base or cut expenses on other budgetary items. Because taxes in the OECD are considered relatively high anyway, both the EU and the OECD studies concentrate on curbing other government expenditures.
The labour market reforms discussed include a gradual increase in the effective retirement age. This will increase labour market participation and lead to lower pension costs. It is accompanied by other policies that increase labour market participation and reduce unemployment.
Regulatory and market reforms aim to improve efficiency and to increase factor productivity growth. Examples are increased openness and competition and macroeconomic stability.
None of the policy measures investigated completely compensates the reduction in GDP. Combinations of these policies may be more effective. EU (1999) presents simulations of combined policies that suggest a 0.5 point increase in average annual per capita growth. Using a similar kind of policy package the OECD study reports an annual increase in per capita GDP of 0.3, 0.6 and 0.7 percentage points for the US, Japan and the EU, respectively.
Table 2 Economic growth and real interest rates
Average growth 1995-2050 Real interest rate
2000 2050
policy reference policy reference policy
United States 1.1 1.4 5.0 5.5 4.2
European Union 1.3 2.0 5.0 4.9 3.5
Japan 1.1 1.7 5.0 5.4 3.8
source: Turner et al. (1998).
2.5 Saving, investment, and interest rates
The projected demographic changes affect savings and investment in different ways. First of all the decline in output growth due to a shrinking labour force will lower the
A G E I N G: A G L O B A L P R O B L E M 21
3
This simulation assumes that the pension rate is constant in the simulation period.
demand for capital and investment. As a result, both the marginal productivity of capital and the real interest rate will decrease. Turner et al. (1998) report that a 1% point per annum decrease in output growth will lead to a 1% point lower interest rate in 2050.
However, this is not the only effect of ageing. According to the life cycle hypothesis (Modigliani and Brumberg, 1954) ageing will in principle lead to dissaving. Savings in the OECD are expected to rise in the coming decade. From then, dissaving is expected to dominate, which a priori will push up interest rates. In countries where ageing is moderate, savings will probably rise for a longer period. Turner et al. (1998) assume that a 1 percentage point rise in the dependency ratio reduces private savings by 0.3 per cent. A third effect is the change in the relative shares of world output. In the next decades the relative weight of the non OECD region will become larger. This applies to Asia in particular. The growth of the economies in the non OECD will demand much capital. These investments will to a large extent be financed through increased domestic savings. High economic growth and a slight shift in the population structure from young to middle-aged in these regions will contribute to this increase. Nonetheless, non-OECD countries will probably run into current account deficits, whereas the OECD saves more than it invests. As a result the latter region will accumulate net foreign assets.
A priori the resulting effect on the interest rate is ambiguous. EU (1999) does not provide a quantitative assessment. Turner et al. (1998) expect that the direct positive effect of ageing on the interest rates will slightly dominate the downward pressure in Japan and the United States, which is due to a decline in output growth. For Europe the interest rate decreases very slightly from 5.0% in 2000 to 4.9% in 2050. These differences within the OECD can be traced back to the development in savings and investment.
It is not clear whether these results for the interest rates are robust. For example Miles (1999) calculates that the interest rate in Europe will decrease from 5.2 % in 2000 to 4.9% in 2050.3 He uses a dynamic OLG model for one region in which the interest rate is endogenous. The private savings rate in Europe decreases from 14.5% to 4.5% in that period. The figures in Turner et al. suggest a similar fall in the savings rate in Europe. Apparently the fall in investment is slightly more important in his model. Cutler et al. (1990) expect also that the effect of a declining output is more important. Their study uses a two country model of the USA vs the rest of the OECD. Beforehand Turner et al. (1998) notice that the relation between changes in the dependency rate and savings is not robust. Empirical estimates of this relation vary widely.
Thus, ex-ante both the effect of ageing on savings and the effect of ageing on interest rates can not easily be determined. This applies even more to the ex-post signs of savings and interest rates, i.e. after any policy measures have been taken into account. Much will depend on the changes in public and private savings. Are governments able
4
Borjas (1994) and Roodenburg (2000) provide a overview of this debate.
to finance the increasing pension and health care costs through tax increases or by reductions in government expenditure? Policy measures, such as a change in the effective retirement age may also affect private savings. This could lead to an extra downward pressure on interest rates.
Turner et al. (1998) show that an OECD policy package including postponed retirement, government debt reduction, higher labour force participation, and higher total factor productivity could lower real interest rates by about 1.5% point in 2050 (see Table 2). Late retirement and debt reduction in particular contribute to this fall in interest rates.
2.6 International labour markets (migration)
A major effect of ageing is the decline in participation rates. It is heavily debated whether more international migration can offset this decline.4 The answer depends on characteristics of the migrants at issue. It is also contingent on characteristics of the receiving country. If, for example, labour migration induces large flows of non-participating family members, the participation rate may even decrease. Moreover, a lack of skills could hamper the immigrants’ integration in the labour market.
UN (2000) computes the size of the migration flows that are necessary to keep the elderly dependency ratios constant until 2050. The conclusion is that migration flows have to increase to much higher levels in the near future. Hence, migration may be ineffective in solving the ageing problem. CPB (2000) does not expect migration to affect participation rates in a significant way either. Chapter 5 of this study comments on the UN (2000) study.
2.7 Conclusions
Ageing will hit the OECD economies quite harshly in the coming decades. Productivity, investment, savings and interest rates may be affected in all countries although the intensity of the effects may differ among different countries. Ageing will occur more rapidly in Japan and Western Europe. Therefore the economic effects will be larger in these regions. GDP per capita may end up about 20% lower, compared to what it could have been if the demographic structure of the population would have remained unchanged. Policy responses as a reduction of other public expenditures, an increase of the effective retirement age, a higher labour market participation, a higher productivity and increased competition could offset the slowdown in economic growth and restore the unsustainability of public finances. International labour migration seems to be less effective as an instrument against the impact of the ageing problem.
23
Chapter 3 How to measure sustainability of public finances?
This chapter discusses long term aspects of budgetary policies. It introduces the criteria for solvency and efficiency of the government budget, in particular the principle of ‘tax smoothing’. As the government has insufficient instruments to influence the inter-generational distribution it faces a trade off between efficiency and equity between generations.
Pay as you go arrangements play an important role in intergenerational risk sharing. These arrangements exist in public pensions, but also in for example health care and private (second pillar) pensions. Is ageing a danger for these arrangements? Is there a need to reconsider these institutions?
3.1 Sustainability
The government budget has an important impact on the distribution of income between generations. Present social security institutions involve large transfers between generations, both from the old to the young, and from the young to the old. For example, expenditures on education can be regarded as a transfer from average tax payers to the younger generations, while public pensions and health care expenditures constitute a transfer to the older generations.
Ageing will change the balance between benefits and contributions of generations from the government sector. In general, transfers to the old will increase while those to the younger generations will stabilise or decline. In the Netherlands, ageing will cause public pensions (AOW) and health care expenditures to increase from 26 % of the present government budget to 38% in 2040, whereas the share of education expenditures will decrease from 10% in 2001 to 9% in 2040. This shift in the government budget obviously affects the net benefit of generations from the government budget.
The natural instrument influence the intergenerational distribution is debt policy. By timely raising taxes and reducing public debt, the government can compensate for the rising costs of ageing in the budget. The falling burden of debt service due to such a policy could avoid that taxes have to be raised in the future when ageing is at its peak. The government can effectively influence the distribution of income over generations by its finance policy. As long as the government satisfies the long term solvency constraint it can vary the path of taxation over time, and thereby influence how the burden of taxation is distributed over generations. It cannot do this perfectly, however. As there are no age specific taxes, the government has an insufficient number of instruments to attain any desired intergenerational distribution of income. In particular, it is difficult to allocate the burden among currently living generations. There is no specific tax for 30 years old, 31 years old, etcetera. Consequently, the government may face a trade-off between efficiency and desired S intergenerational S income policies.
Solvency
This study focuses on sustainability of public finance. The central question is whether current fiscal and social security arrangements can be maintained in the future without the government running into financial problems. That is, the government cannot play a Ponzi game, and let its debt explode in the long run. Solvency requires that total liabilities, i.e. the present value of future expenditures plus present public debt, does no exceed the present value of future tax revenues. To put it formally, total tax revenues T (in present value) should be sufficient to finance total public liabilities L, which is defined as the sum of expenditures G (present value) and the initial stock of public debt D (which can have either sign). The intertemporal budget constraint, or solvency constraint, can thus be written as (at date t):
Tt Lt Gt Dt
Of course, sustainability is no problem when the burden would be shifted to future generations by a tax increase in some indefinite future, or when future government expenditure is curtailed to compensate for the costs of ageing.
Therefore, for a judgement of sustainability one should be more specific about future policy. A natural benchmark is to consider a policy that maintains the current fiscal arrangements. Sustainability thus gives an answer to the question: is it possible to keep up social security and government expenditure without running into financial problems, and thus having to raise taxes in the (distant) future? Or more briefly, sustainability is defined as solvency of government finances upon continuation of current fiscal arrangements. Thus we can define solvency and sustainability:
$$$$ Solvency of public finances requires that the present value of the governments’
income is sufficient to cover total liabilities, TtLt.
$$$$ Sustainability applies to current fiscal policy, and requires that public finances
satisfy the solvency condition if current public arrangements would be continued for ever.
The solvency condition S or intertemporal government budget constraint S applies all possible time paths of fiscal policy. Sustainability is a more restrictive concept, as it refers to a specific path of taxes and revenues that follows from continuation of current fiscal arrangements and social security.
This concept of sustainability provides a useful indicator for the financial stance of fiscal policy from a long-term perspective. Obviously, it does not imply the optimality of such a policy. It only indicates whether present fiscal policy can be sustained in the future from a financial point of view. If not, fiscal policies will sooner or later have to adjusted.
H O W T O M E A S U R E S U S T A I N A B I L I T Y O F P U B L I C F I N A N C E S? 25
Should public debt go to zero in the long run?
The solvency condition puts an upper bound to the development of the public debt ratio. In particular, solvency requires that the public debt ratio increases with less than the differential between the interest rate and the rate of economic growth. This ‘no-ponzi game’ condition has two implications.
$ First, the solvency condition does not require the debt ratio ultimately to stabilise at
a constant level, and certainly not at a zero level. Indeed, the debt ratio may proceed along an ever increasing path. The only restriction imposed by solvency is that it does not increase too fast. More precisely, it may increase as long as its discounted size goes to zero in the long run.
$ Second, the level of the debt ratio in any particular year in the far future cannot be
derived from final conditions. The level of the debt ratio in some future year also depends on the development of public expenditure till that year.
The intuition behind this ‘indeterminateness’ of the final debt is that the discounted weight of debt in the distant future is zero. So for current fiscal policy it does not really matter what happens in the very distant future.
If policy follows the tax smoothing principle (to be discussed below), and keeps tax rates constant over time, one can say more. Let us for example take a look at the case where public expenditure in terms of GDP increases for a number of years and then stabilises at the level achieved S the pattern that arises from ageing in the Netherlands
S . It can be shown that - upon tax smoothing - the debt to GDP ratio declines during the
first period (when expenditure is increasing), and thereafter stabilises when public expenditure is constant. The new equilibrium of the debt ratio depends among other things upon the initial debt ratio and the length of the first period with increasing expenditure.
The important message is that the time path of the public debt ratio features hysteresis: the level at which the debt ratio settles ultimately, cannot be determined without information on the period of transition. This framework thus does not generate a simple norm for the absolute size of public debt. In stead, it is the time path of debt that matters.
Constant fiscal policy
The concept of ‘constant fiscal arrangements’ in the definition of sustainability is not unambiguous. Does it mean constant tax brackets or constant average tax rates? Does it imply continuation of present indexation rules in social security, or does it assume that all transfers grow in proportion to wages? Should one take account of inflationary biases in fiscal rules?
It is obvious that these questions have quite different answers depending on the time horizon of the analysis. In the short run it is natural to follow the ‘formal’ fiscal rules. For a long-term analysis this makes little sense, however. The time horizon of current fiscal policy is far to short to take them as a basis for long term projections. Over a time
period of decades fiscal policies are endogenous, and subject to the discretion of future governments. The present government is unable to commit future governments. It makes therefore makes little sense to extend current fiscal rules indefinitely to the future. For example, extending current tax brackets to the year 2020 implies that almost all workers would be in the highest tax bracket purely as a result of income growth, yielding an enormous increase in tax revenue - even in the absence of an inflationary bias - . This obviously would make little sense in the context of a study of ageing.
Therefore we define a ‘steady growth’ scenario of future policy where all relevant
S age specific S categories of government expenditure grow in proportion to
productivity in the private sector. This applies to transfers and social security benefits as well, which is a natural assumption, as transfers are linked to wages, and wages grow at the same rate as productivity. This will be worked out more precisely in section 3.4 below, and Chapter 4, where we will also explain how ageing affects the growth of government expenditures.
Tax smoothing
On the revenue side sustainability is measured under the condition of constant tax rates. An important advantage of this concept of a constant tax rate is that it satisfies the principle of ‘tax smoothing’, which is a criterion for efficiency of taxation (Barro, 1979). Efficiency is defined here as the time path of taxes that minimises the welfare costs that arise from the distortionary character of taxation. Intertemporal efficiency requires uniform tax rates over time. Alternatively, (convex) collection costs of taxes may provide a rational for tax smoothing, as in Barro (1979). Essential is that the marginal welfare costs of taxation are constant over time (as a fraction of GDP). Then tax rates should be uniform as well.
An important feature of tax smoothing is that the level of public expenditure in a particular year is irrelevant for the optimal tax rate in that year. The height of the tax rate follows from the intertemporal government budget constraint. The tax rate should be such that public finances satisfies solvency constraint, that is, the present value of tax revenues should be equal to the liabilities of the government, i.e. the present value of future expenditure plus initial debt.
In an uncertain world this equality should hold for the expected values. Tax smoothing will then apply ex ante, but not necessarily ex post. Whenever new information becomes available, the government should adjust its policy, and revise its tax rates instantaneously to the new S constant S level. As a result, although tax rates are aimed to be constant ex ante, they will in general not be constant ex post.
Some qualifications are in order:
$ Note that the principle of tax smoothing, while efficient, is not necessarily optimal
from a social point of view. Indeed, it does not necessarily imply intergenerational neutrality. Due to lack of instruments the government might face a trade off between
H O W T O M E A S U R E S U S T A I N A B I L I T Y O F P U B L I C F I N A N C E S? 27
efficiency and equity. This may be a reason to deviate from tax smoothing. As will be argued below, this is not necessarily a problem when designing long-term policies. In a steady-growth environment tax smoothing may well coincide with "neutrality" with regard to the intergenerational distribution (see section 3.3 below).
$ Whether the government deviates from tax smoothing depends on the costs and
benefits. The benefits of tax smoothing depends on the relation between the tax rate and its distortionary effect. Recent analysis suggests that these benefits of tax smoothing may be limited (Cutler et al., 1990). In chapter 6 a similar exercise is made for the Netherlands, and also finds limited welfare effects.
$ Tax smoothing assumes that the marginal distortionary costs of taxation are constant
over time. This needs not to be true in reality. For instance, increasing international mobility of the tax base may lead to rising marginal cost. This may be a reason for a declining path of tax rates. On the other hand, improving information technologies may lead to falling (marginal) costs, in particular as the collection cost of taxes decline.
Required adjustment of tax rate
Using this framework it is possible to determine the distance between the current path of fiscal policy and a sustainable path. The gap in solvability can be measured as the discrepancy in expected present value between taxes revenues and liabilities (expenditures plus debt), Lt - Tt. In this study we will use a more practical measure, viz.
the required adjustment in (indirect) taxes that would be necessary to restore solvency. This measure is closely related to the gap in present value terms; in fact, it is the annuity of this gap using the growth adjusted interest rate. This can be written as (see the appendix):
required adjustment (Rt Nt) Lt Tt GDPt
where Rt and Nt represent the long-term interest rate and growth rate. This annuity
determines the permanent increase in taxes (% GDP) that is sufficient to cover the gap in solvency, taking into account that the tax base is expected to growth by Nt on average
over time. This measure is intuitive, and moreover satisfies tax smoothing., as it implies an immediate and permanent adjustment in the tax rate.
The focus on taxation rather than expenditures as the instrument to restore sustainability is natural in the present context which takes the time path of expenditure as given, and concentrates on the financing of the government budget. The choice is between future taxes and current taxes. The determination of S optimal S volume of government expenditures is quite a different issue, in which the cost of financing (the excess burden) is only one of the S many S determinants.
0 5 10 15 20 25 30 35 40 45 50 55 60 65 70 75 80 85 90 95 -10 0 10 20 30 40 Net benefits 1000 euro 3.2 Intergenerational distribution
How the fiscal policies affect the intergenerational distribution can be established using the tools of Generational Accounting (GA). This method, which has been designed by Auerbach Gokhale, and Kotlikoff (1991), establishes the net benefit of generations from the government budget. The net benefit is measured as the benefits of government expenditures enjoyed by a generation minus taxes paid by this generation, both in present value terms. The method of GA has been extended for the Netherlands (Ter Rele (1998)), and provides a comprehensive basis for establishing the age-profile of govern-ment expenditures and revenues.
Generational accounts calculate the net benefit of that current generations of would receive from the government if current fiscal rules were continued. Therefore one extrapolates the age profile of net benefits, i.e. public expenditures (imputed to age groups) minus taxes, into the future. The shape of the age profile for each spending and revenue category is determined for the base year, and is assumed to remain constant over time. Figure 3.1 shows the age profile of the net benefit to the government budget. Overall, the young and the elderly benefit from the public finances, while the middle-aged are net contributors.
H O W T O M E A S U R E S U S T A I N A B I L I T Y O F P U B L I C F I N A N C E S? 29
1
It is not clear, for example, whether child allowances should be allocated to the parents or the children, and whether taxes on a household are borne by the parents alone or also by the children.
The age profiles can be combined with projections for the aggregates of each spending and tax component to determine the fiscal benefits and burden for each age category. The GA approach assume that all government expenditures are assigned to generations, even though a significant part of expenditures are general, and not age related. Given the aggregate net fiscal benefit of current generations, the intertemporal government budget constraint (or solvency constraint) determines what is left for future generations. This follows from the intertemporal government budget constraint above (Tt = Gt + Dt ). The net benefit of current generations (B
c
) is equal the expenditures enjoyed received by these generations minus the taxes paid, hence
Bct Gtc Ttc
Similarly defining the net benefit of future generations as B f = G f - T f , one obtains
from the budget constraint Bft Btc Dt 0
That is, the sum of the net benefits and public debt must be zero. If there is a positive debt, this equality implies that the total net benefit is negative, and that the burden of debt is distributed over all current and future generations.
Intergenerational measures for sustainability Generational accounting yields three important measures.
$ The first one is the level of the net benefit for future generations B f
derived above. This benefit is usually expressed as the average benefit of future generations. It should be noticed that the level measure is very sensitive to the allocation of benefits over the life cycle, which is sometimes rather arbitrary.1 (See the box ‘Why doesn’t fertility improve public finances?’)
$ The second measure is generational neutrality. This is measured by the difference
in tax burden on current newborns (who are the youngest members of the current generations) and the tax burden on future generations. As they both apply to an entire lifetime, the tax burdens on these two generations are comparable.
The difference between these two lifetime tax burdens yields a measure for the sustainability of public arrangements. If the burden of the newly born (which depends on current arrangements) coincides with the burden on future generations (which is determined residually from the government budget constraint), public
arrangements can regarded as sustainable. There is no need to change current fiscal policies to meet the solvency condition. However, if future generations face a larger tax burden than the newly born do, then current public arrangements are too ‘generous’ and will have to be adjusted in the future.
$ Another way to measure the sustainability of the public arrangements is to determine
the permanent and immediate change in some tax or transfer instrument that is required to make arrangements sustainable (i.e. to equalise the net fiscal burdens facing the newly born and future generations).
Notice that the GA criterion of intergenerational neutrality is only a very partial measure of the distributive effects. It only looks to the distribution between the newborn and the ‘average’ future generation. This limitation is usually motivated by difficulty of data collection for the past. It is hard to establish the life time benefit of currently living generations, as this would require lots of information on past fiscal policies. This limitation hampers the assessment of intergenerational equity, however. It is hard to assess the distributional aspects if all current generations are left outside the analysis. This again emphasises that one should be very cautious in using this framework for evaluation of the distributive effects of fiscal policies.
This study, like previous ones for the Netherlands (see e.g. Ter Rele (1998), and Bovenberg and Ter Rele (1999 and 2000)), points out that there is a net benefit to future generations (see the box on fertility). According to the intertemporal budget constraint this implies that the expected contribution of current generations is more than sufficient to pay for current public debt. Does this it mean that current generations pay ‘too much’ whereas future generations benefit? No, this absolute value is little informative. First, as pointed out above, the measure for the level of the net benefit of future generations is highly sensitive to the construction of the age profile. Furthermore, a net benefit for future generations, does not imply that this has been built up by current generations. Also current generations may be net beneficiaries over their life time. They could have ‘inherited’ a favourable position from previous generations, for example from the silent generation of the post war period. Also, there may have been windfall gains to the government (e.g. natural gas) which are not assigned to a particular generation.
Equivalence between measures of sustainability
What is the relationship between this measure of sustainability that follows from generational neutrality, and the measure of sustainability of fiscal policy, defined earlier? In a steady-growth environment where all relevant variables - at the micro level - grow in fixed proportions to each other, both measures are equivalent. More specifically, this is so if:
H O W T O M E A S U R E S U S T A I N A B I L I T Y O F P U B L I C F I N A N C E S? 31
$ the age profiles of net benefits from the government are constant over time; that is,
all (age-specific) expenditure and income categories increase at the same rate, equal to productivity growth in the private sector.
$ life expectancy is constant over generations.
These assumptions must hold for newborn and future generations only; current generations are not taken into account in this measure. Under these assumptions everything in the economy moves in fixed proportions (except aggregate variables that may change due to changing demographic composition). In these circumstances steady government policies also imply a steady distribution between future generations. Hence, the net benefit of the newly born will be equal to the net benefit of future generations. The two requirements are not entirely satisfied in reality. Life expectancy increases, which causes an extra growth in expenditures on health care and public pensions. Furthermore, also the age profiles may change, for example if one category of expenditures (e.g. health) grows faster than other categories. Consequently, the net benefit of generations may change over time despite tax smoothing and sustainable public finance. In that case, tax smoothing would no longer coincide with generational neutrality.
For example, increasing life expectancy tends to raise the net benefit of future generations. If every next generation lives longer than the previous generation, they also benefit longer from government expenditures. The ensuing increase in expenditures puts an extra burden on the government budget, that according to the efficiency criterion -should be smoothed over all generations. This implies that current generations pay for the extra expenditures enjoyed by future generations. Alternatively, intergenerational neutrality would require tax rates to increase over time in order to compensate for the lengthening of lifetimes. Both criteria no longer coincide.
Something similar could happen in case of Baumol effects on public expenditures. If productivity in the public sector lags behind productivity growth in the private sector, the demand for public consumption goods may increase vis-a-vis private consumption. This will increasingly burden the government budget as time moves on. Again, according to tax smoothing principle the burden is should be shared among all generations, while obviously future generations benefit most from this increased government consumption. Tax smoothing thus no longer is neutral from the point of view of intergenerational distribution.
3.3 Equity and efficiency
Intergenerational neutrality takes as criterion that generations benefit equally from the government (relative to their income). Applying this criterion any increase in expenditure should be matched with a tax increase such that net benefits remain equal across generations. In reality, governments lack generation-specific tax instruments.
There are instruments that deal specifically with groups of generations, like the young or the elderly, but no instruments that focus on households born in a particular year. Obviously, the government can vary the tax instrument every year, but this does not resolve the problem either as each year a new generation is born. Therefore it is impossible to fully eliminate all undesired effects on the intergenerational distribution. Furthermore, the government may face a trade-off between distributive objectives and the distortionary effects of taxation. In this study we avoid the issue of ‘optimal distribution’ over generations. We will take account of the distributional consequences,
Why doesn’t higher fertility improve public finances? Although ageing in the Netherlands is caused by a dramatic decline in fertility in the 1960s and 1970s, it is by no means obvi-ous that increasing fertility would help to restore the sustainability of public finances. Calculations for the Netherlands in Chapter 5 of this study show that an increase in fertility is of no help at all for public finances in the Netherlands.
This somewhat surprising result points out that there is a big difference between ageing as a demographic phenomenon, and the economic consequences of ageing. Indeed, encouraging fertility would help to reduce the average age of population S as immigra-tion may do, see chapter 5 S, but it happens be ineffecitve in restoring the sustainability of the government budget.
This result can be explained using the framework developed in this chapter. Whether or not, new children improve the financial position of the government depends on their net benefit of the government budget over their life time. This can be positive or negative. New children do not only pay taxes, but also receive education, enjoy from culture, and benefit from health care when they are old. The balance of contributions and benefits depends on the stance of public finances at the moment when the child is born. If new generations are net beneficiaries ( Bf >0) their contribution
will be negative on balance. In this case new children cost more to the government than they contribute.
Future generations are net beneficiaries if the present value of taxes to be paid by currently living generations is S more than S sufficient to cover initial outstanding debt. In the Dutch case S under current fiscal rules S current generations are expected to contribute more to the government during their remaining life times than is needed to pay for total public debt, so that they leave a positive net benefit for future generations.
H O W T O M E A S U R E S U S T A I N A B I L I T Y O F P U B L I C F I N A N C E S? 33 2000 Expenditure ratio Tax ratio E t I
however, and derive distributive consequences of alternative fiscal policies for current and future generations.
Policies will thus be evaluated using both criteria:
$ efficiency
$ generational neutrality
As discussed above, both criteria are generally consistent in a long-term context when focussing on constant fiscal policies. For evaluation of discretionary policy measures these criteria no longer coincide. This can be illustrated by the following examples.
A boost in government consumption
First consider a temporary boost in public expenditure. Assume that only current generations benefit, e.g. a temporary increase in health expenditures. How should this increase in expenditures be financed? Two alternatives stand out:
$ According to the efficiency S tax smoothing S argument, this measure calls for an
immediate and permanent increase in the level of taxation. Taxes increase by less than expenditure, so that debt will grow, and part of the burden is shifted to future generations. The net benefit of current generations increases, at the expense of future generations.
$ Generational neutrality would imply a different time path for taxation. Here, the rise
in expenditures should be fully financed by current taxes, and future generations are unaffected. In accounting terms the net benefit remains the same for all generations. Figure 3.2 A temporary boost in public expenditure
Both alternatives are illustrated in figure 3.2. It is obvious that both criteria lead to very different conclusions regarding the time path of public finances. In the first case (labelled E in the figure) the financing is efficient, but not neutral with regard to intergenerational distribution. In the second case (labelled I ) the policy is neutral, but now leads to efficiency losses.
Notice that in case of a permanent change in public expenditure, there is no such a conflict between the two criteria. Then both require taxes to be raised immediately and permanently, and in the same amount as expenditures increase. In this case the path of public debt remains unchanged. Each generation pays for its own increase in expenditure.
This difference in conclusions raises the question which approach is relevant when evaluating discretionary fiscal measures. In theory, as the government cannot commit future governments, the first approach is the relevant one. The current government determines its fiscal policy taking future fiscal policies as given. In that case there is a clear conflict between the two criteria. In practice, however, there seems to exist considerable hysteresis in fiscal institutions and social security arrangements. Then the two criteria may coincide.
Increase in government investment
Next consider a temporary increase in government investment. Assume that this investment yields a S non pecuniary S flow of public services to the private sector, starting at some particular date in the future. Again the two criteria do not match:
$ Tax smoothing would require that the financial burden of investment is smoothed
over all generations.
$ According to intergenerational neutrality taxes should be borne by the generations
that benefit from it.
Both criteria have in common that part of the financial burden of investment is shifted to the future. In the first case, taxes are increased immediately, but by less than required to finance investment, so that public debt increases. In the second case, taxation will be postponed until the project yields its services to the private sector. As the government cannot perfectly target its taxation to specific generations, it will be impossible to establish a time path of taxes that is fully neutral between generations. Moreover, it is not evident which generations will benefit; it could be the old, if the project leads to higher returns on private investment, it could also be the young generations, if it leads to higher wages. In the latter case, as government expenditures (including pensions) are linked to wages, also the older generations will again benefit.
It is obvious that government investment can have an important impact on the size and the distribution of present and future welfare. Therefore investment policies could in
H O W T O M E A S U R E S U S T A I N A B I L I T Y O F P U B L I C F I N A N C E S? 35
principle be supportive to ageing policies. Its impact is however complex, and seems not very targeted to the intergenerational distribution. In this respect, the financing of the government budget still seems to be the natural instrument to achieve and maintain sustainability of public finances, and to avoid undesired effects on the intergenerational distribution.
Exogenous increase in productivity growth
Next consider an exogenous and permanent increase in productivity growth. Although, this certainly enhances welfare, it does not generally improve the sustainability of public finances. Again not only the government’s revenues increases, but its expenditures as well. There may be a small net effect depending on the size and sign of public debt. Required adjustment changes by an amount equal to the annuity of public debt. This effect can, however, easily be dominated by other aspects of the government budget, as we will seen in chapter 5 for the Netherlands.
Two qualifications are in order:
$ first, if the government has other preferences for the intergenerational distribution
than implied by the neutrality criterion adopted here, e.g. a convex social welfare function, the higher productivity growth may be a reason to change fiscal policies in favour of current generations;
$ second, this exercise extrapolates the initial public institutions. If these do not
represent a desired equilibrium, productivity growth may have a beneficial impact during the transition path towards the equilibrium. More specific, if the government is in a process of reducing the size of government expenditure, the transition period may become easier and shorter if productivity growth goes up, thereby relieving public finances.
These examples show that it is generally very difficult to evaluate discretionary policies in terms of efficiency and equity. Such a policy analysis would clearly be beyond the scope of this study. The next chapters will focus on a long-term assessment of public finances, and on the consequences of ageing for the sustainability of current public arrangements. For such a long-term assessment the criteria of intertemporal efficiency (tax smoothing) and intergenerational neutrality offer a useful benchmark, and generally coincide.
3.4 Intergenerational risk sharing
Most discussions on ageing focus on the S possibly undesired S effects on the inter-generational distribution arising from the current pay-as-you-go systems in public pensions and health care. There is another dimension which is also very important. One of the rationals behind public pension systems is their contribution to risk sharing
between generations. Private markets are unable to provide this insurance, as there is no party that can act on behalf of future generations. The government can compensate for this market failure. Pay-as-you-go arrangements in public pensions and health care may therefore be interpreted as an implicit contract between generations. As it is easier for younger people to accommodate to shocks in income than for the old, this risk sharing enhances total welfare. Moreover, the type of shocks faced by young and old is generally not be the same, so that they can gain by pooling their risks.
Funded pension schemes are subject to considerable risks. Although risks of longevity can be pooled among the members of each generation, the financial risks cannot be diversified within one generation. In particular assets are subject to risks in the rate of return, whereas liabilities may be subject to macroeconomic shocks, e.g. if pensions are indexed to wages. This situation creates scope for risk sharing, as for younger generations human capital is their main S risky S asset. Both mandatory pension schemes, and the government can contribute to intergenerational risk sharing. Further-more, the risks of funded pensions can be reduced S but not eliminated in the aggregate
S by asset liability management (ALM).
An important question is if the balance for risk sharing is going to change as ageing causes the weight of older generations to increase relative to younger generations. It is obvious that the share of financial assets in the ‘national’ portfolio will grow relative to human capital. As a result the marginal welfare costs of financial risks tend to increase, so that it becomes more expensive for old generations to ‘insure’ their financial risks. To put it differently, as there are less members of - future - young generations to trade with, it will become more difficult to insure financial risks for the old, and the price of insurance goes up. This may be a reason to reconsider current arrangements, and leave more of the risks with the older generations. This could be done many different ways, both in fiscal policy (e.g. extra ‘precautionary saving’), social security (e.g. less PAYG), and in private pension schemes (e.g. shifting from defined benefit to defined contribution schemes).
However, great caution is in order. First, little is known about the size of this effect. Nor do we know whether the initial situation was optimal. Furthermore, there are many other factors that affect the cost en benefits of intergenerational risk sharing as well. Therefore, one should be very careful to put the system of intergenerational risk sharing at risk. This could happen if the burden of ageing is shifted too much to one of the parties, i.e. the young generations. This again emphasises how important it is to avoid undesired effects of ageing on the intergenerational distribution by adequate fiscal policy.