Performance and Energy Efficiency Metrics for
Communication Systems of Cloud Computing
Data Centers
Claudio Fiandrino,
Student Member, IEEE,
Dzmitry Kliazovich,
Senior Member, IEEE,
Pascal Bouvry,
Member, IEEE,
and Albert Y. Zomaya,
Fellow, IEEE
Abstract—Cloud computing has become a de facto approach for service provisioning over the Internet. It operates relying on a pool of shared computing resources available on demand and usually hosted in data centers. Assessing performance and energy efficiency of data centers becomes fundamental. Industries use a number of metrics to assess efficiency and energy consumption of cloud computing systems, focusing mainly on the efficiency of IT equipment, cooling and power distribution systems. However, none of the existing metrics is precise enough to distinguish and analyze the performance of data center communication systems from IT equipment. This paper proposes a framework of new metrics able to assess performance and energy efficiency of cloud computing communication systems, processes and protocols. The proposed metrics have been evaluated for the most common data center architectures including fat tree three-tier, BCube, DCell and Hypercube.
Index Terms—Data center, cloud computing, performance and energy efficiency metrics
F
1
I
NTRODUCTIONCloud computing has emerged and has become fun-damental for IT operations worldwide, replacing tradi-tional business models. Enterprises can now access the vast majority of software and services online through a virtualized environment, avoiding the need for expensive investments into IT infrastructure, while covering only costs of infrastructure required to pro-vide connectivity. Instead, they can focus on their core business directly and consume IT services over the Internet on a pay-as-you-go basis. For operation, cloud computing relies on the network of geographically distributed data centers. Therefore, assessing data center performance is important for understanding the operation of existing data centers and crucial for the design and construction of next generation systems for cloud computing.
Data center performance and efficiency can be expressed in terms of the amount of supplied electrical energy that is actually turned into computing power. Data centers require a tremendous amount of energy to operate. In Europe, data centers are forecasted to consume up to 93 TWh by 2020 [1]. Almost 75% of this consumption is attributed to the IT and cooling equip-ment. The remaining 25% is lost in power distribution and facility operation systems.
• C. Fiandrino, D. Kliazovich, and P. Bouvry are with the University of Luxembourg, Luxembourg.
E-mail: [email protected]
• A. Y. Zomaya is with the University of Sydney, Australia. E-mail: [email protected]
Current research and industry standards propose a number of metrics for assessing efficiency of energy distribution [2], [3], [4], [5] and cooling [6], [7], [8]. The most popular metric used nowadays is Power Usage Effectiveness (PUE) [9]. It measures the portion of the supplied electricity actually delivered to the IT equip-ment. Unfortunately, most of the available metrics are too generic. They indeed are unable to differentiate between individual IT subsystems. For example, using existing metrics, it is not possible to distinguish the efficiency of the data center communication system from the efficiency of the computing servers, as both remain considered under the common umbrella of IT equipment [10], [11].
Ideally, power consumption of network devices should be proportional to the workload. However, in reality their power consumption is composed of two parts, fixed (for switch chassis and line cards) and variable (for active transmitters). Only the latter scales with the transmission rate, or the presence of forwarded traffic, while the former part remains con-stant, even when the switch is idle. This phenomenon, known as energy proportionality, describes the relation between energy consumption and offered load in the system or a component. With current network switches, the difference between peak and idle consumption is less than 8%, while turning off an unused port saves only 1-2 watts [12]. As computing servers’ power consumption becomes more proportional to the workload and effective at low utilization levels, network power consumption remains a concern. In certain scenarios, network power consumption can account for nearly 50% of the overall data center
power consumption [13]. To assess the degree of energy proportionality for network devices, we propose a metric which can be applied to investigate both the energy proportionality of individual network devices as well as of the whole system.
Distinguishing communication systems from the IT equipment and assessing their performance is very important. Most cloud applications follow a Software-as-a-Service (SaaS) model [14], and communication pro-cesses, not computing, tend to become the bottleneck limiting overall system performance [15]. Specifically, latency, available bandwidth or both can become lim-iting factors. Voice conferencing, for example, imposes severe constraints on the communication latency, but does not require high bandwidth availability. On the opposite side, video streaming, cloud storage and cloud backup applications require high bandwidth to transfer huge amounts of data, but remain tolerant to network delays. Finally, cloud gaming produces high traffic load and requires tight delay constraints to keep players synchronized.
Cloud communications can be categorized according to the direction of information flow: cloud-to-user and intra-cloud. The former is related to serving cloud users located in the access network. This was not needed in the PC era when all data and software were available on user devices. The latter corresponds to the traffic which remains inside a data center. Cisco estimates that network traffic is the fastest-growing data center component, rising to 4.3 ZiB in 2016 with a combined annual growth rate of 44% [16]. Networking solutions, architectures and protocols therefore must be carefully considered to achieve good performance. In this paper we propose a framework of metrics for assessing performance and energy efficiency of communication systems for cloud computing data cen-ters. Unlike existing metrics, the proposed framework allows a fine-grain analysis and comparison of com-munication systems, processes, and protocols, defining their influence on the performance of cloud applica-tions. The presented framework is being considered for standardization and is positioned to become an essential tool for scientific research in cloud computing and data center industries. The contribution synopsis of the paper is as follows.
• Analysis of existing metrics for energy efficiency,
infrastructure effectiveness, and cooling in data centers (Section 2).
• Development of a framework of new metrics for
assessing performance and energy efficiency of communication systems and processes in cloud computing data centers (Section 3).
• Evaluation and comparison of the proposed
met-rics analytically as well as using traffic traces collected from operational data centers (Section 4 and Section 5).
2
B
ACKGROUND OND
ATAC
ENTERM
ET-RICS
Existing metrics that assess efficiency, performance and quality of cloud computing systems can be attributed to the following three categories.
Power and energy efficiency:The most important metrics in this category are PUE and Data Center infrastructure Efficiency (DCiE) [17]. PUE is defined as the ratio between the power consumed by the facility and the power consumed by the IT equipment, while DCiE is the reciprocal of PUE. Energy Utilization Effectiveness (EUE) [18] is analogous to PUE, but is based on energy rather than power. The Energy Reuse Effectiveness (ERE) and Energy Reuse Factor (ERF) [19] measure how much energy can be reused outside the data center, and the Uninterruptible Power Supply (UPS) Load Factor [20] accounts for the average UPS load over the total UPS capacity. Two more generic metrics are Data Center Energy Productivity (DCEP) [21] and Power to Performance Effectiveness (PPE) [22]. They evaluate respectively the amount of energy spent to produce useful work and effectiveness of the IT equipment in terms of power consumption relative to the delivered performance.
Environment and air management:One of the most important metrics for environment and air manage-ment is the Return Temperature Index (RTI) [6]. RTI evaluates the energy performance of air management in isolating cold and hot airstreams. The Recirculation Index (RI) [23] accounts for the percentage of recircu-lated air absorbed by a rack while the Capture Index (CI) [24] evaluates the fraction of airflow, entering or exiting a rack, which follows the desired path.
Cooling efficiency: The Rack Cooling Index (RCI) [6] is a metric evaluating rack cooling efficiency according to the thermal guidelines provided by manufacturers. Data Center Cooling System Efficiency (DCCSE) [25] assesses the amount of power needed to operate cooling equipment. It is defined as the ratio be-tween the average cooling system power consumption and load of the data center. Airflow Efficiency (AE) [25] assesses the fans and the efficiency of air circulation. The Air Economizer Utilization Factor (AEUF) [25] measures the number of hours in a year during which the air economizer exploits low external temperatures for chilling water. The technique is also known as “free-cooling.”
The metrics assessing performance of traditional communication networks typically focus on network latency, bandwidth and error rates as main indicators. The detailed surveys are available in [26], [27], [28].
Certain aspects of data center networks analysis are explored in several works [29], [30]. The focus is devoted to the evaluation of latency and bandwidth between pairs of running VMs [29] and the analysis of data center network costs and capacity [30].
TABLE 1
Communication Metrics for Cloud Computing Data Centers.
TYPE METRIC NAME DESCRIPTION
Power
CNEE Communication Network Energy Efficiency Energy to deliver a single bit of information NPUE Network Power Usage Effectiveness Ratio between total IT power and power consumed
by network equipment
EPC Energy Proportionality Coefficient Degree of energy proportionality of a device or a system
Performance
UDCL Uplink/Downlink Communication Latency Communication latency between data center gate-way and computing servers
UDHD Uplink/Downlink Hop Distance Hop distance between data center gateway and computing servers
ISCL Inter-Server Communication Latency Communication latency between computing servers ISHD Inter-Server Hop Distance Hop distance between computing servers
DAL Database Access Latency Average latency of accessing database from comput-ing servers
BOR Bandwidth Oversubscription Ratio Actual bandwidth servers can exploit under full load UDER Uplink/Downlink Error Rate Error rate of the paths between data center gateway
and servers
ISER Inter-Server Error Rate Error rate of the network paths between computing servers
ALUR Average Link Utilization Ratio Average link level occupancy
ASDC Average Server Degree Connectivity Average number of network links per server
Network
T
raf
fic ITR Internal Traffic Ratio Traffic exchanged within the data center ETR External Traffic Ratio Traffic destined outside the data center
MMTR Management and Monitoring Traffic Ratio Traffic generated by management and monitoring operations
MMTE Management and Monitoring Traffic Energy Energy consumption of management and monitoring traffic
3
C
OMMUNICATIONM
ETRICS FORC
LOUDC
OMPUTINGD
ATAC
ENTERSThis section defines a framework of metrics that characterize performance and energy efficiency of communication systems in cloud computing data centers.
Cloud applications, with the only exception for High Performance Computing (HPC), are communication-intensive [15]. Therefore, the communication parame-ters, such as bandwidth capacity, latency and error rate, can affect system performance dramatically. Unfortu-nately, existing performance and power-related metrics that are widely used in the data center industry (see Section 2) fail to distinguish communication systems from the category of IT equipment. The proposed metrics address this gap by allowing finer granularity. At the same time, they remain general and intuitive to be universal and applicable to the vast majority of existing data centers and their communication systems. The proposed metrics can be broadly attributed to the following three categories:
• power-related metrics;
• performance-related metrics;
• network traffic-related metrics.
Power-related metrics assess energy efficiency of
communication systems by analyzing how much of the electric power is actually turned into the work
of information delivery. Performance-related metrics
analyze communication rate, capacity, and latency for information delivery. Finally,network traffic-related met-rics provide insights into the nature of the transmitted information and help to measure control traffic over-heads. Table 1 summarizes the power, performance and traffic related metrics presented in the following sections.
3.1 Power-Related Metrics
Communication Network Energy Efficiency
The communication network turns the supplied elec-tricity into the job of information delivery. The effi-ciency of this process can be measured by the metric Communication Network Energy Efficiency (CNEE):
CNEE=Power Consumed by Network Equipment Effective Network Throughput Capacity . (1)
The data center network equipment includes all the hardware components that take part in infor-mation delivery between servers, including network switches, routers, communication links, and Network Interface Cards (NICs) of the servers1. The effective
net-work throughput capacity is a maximum end-to-end throughput offered by the network to the computing
1. The servers, excluding their NICs, are considered to be devoted to computing and not as a communication equipment.
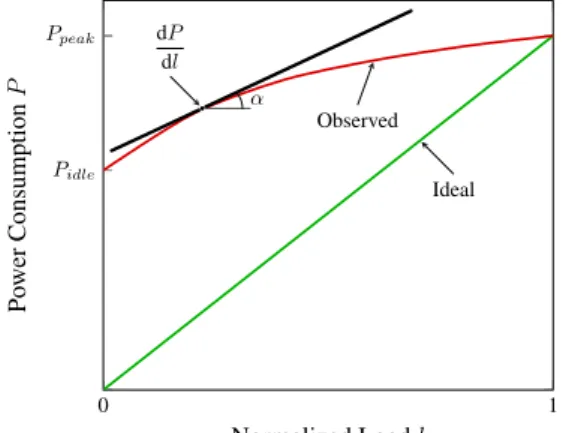
0 1 Pidle Ppeak Ideal Observed dP dl α Normalized Loadl Po wer Consumption P
Fig. 1. Energy proportionality.
servers. In the context of this paper, the terms “comput-ing servers” and “servers” are used interchangeably. The CNEE is measured in watts/bit/second, which is equivalent to joules/bit, or the amount of energy required to deliver a single bit of information by the network.
Network Power Usage Effectiveness
Another measure of the communication system effec-tiveness is in the power consumed by the network equipment as a fraction of the total power consumed by the IT equipment. This metric is called Network Power Usage Effectiveness (NPUE) and is defined as follows:
NPUE= Total Power Consumed by IT Equipment Power Consumed by Network Equipment. (2)
NPUE specifies which fraction of the power con-sumed by the IT equipment is used to operate data cen-ter communication system. In a similar way PUE [17] measures the portion of the amount of energy used by a data center facility that is delivered to power IT equipment. NPUE values can range from 1 to infinity. For example, for NPUE equal to 6 for every 6 watts consumed by IT equipment, 1 watt is devoted to operate network equipment. The NPUE value equal to 1 corresponds to the system where all the IT-related power is consumed by the network equipment, which is a not desirable target: if all the IT power is consumed by the network equipment, there is nothing left for computing servers. However, NPUE values approaching 1 are not necessarily symptoms of network inefficiency. It can signal that the computing servers were upgraded and became more energy efficient.
Energy Proportionality Coefficient
Ideally, energy consumption of network devices should be proportional to their workload. However, in reality neither computing servers nor network switches are energy proportional. Many servers consume up to 66% of their peak power consumption when idle [31]. For
1 −1 −1 1 0 π/2 π 3π/2
Fig. 2. Energy Proportionality Coeffient (EPC).
network switches this ratio is even higher and can reach 85% [32].
Energy Proportionality Coefficient (EPC) is mea-sured as energy consumption of a system or a device as a function of the offered load. In the ideal case, represented by a straight line in Figure 1, every
increase in loadl should correspond to the equivalent
increase in power consumption P. In reality, the
observed power consumption is often non-linear. Its energy proportionality varies depending on the incline with the respect to the ideal case. To analyze this deviation, a tangent line can be built at every point to
the observed curve. The angle of this tangent lineα
can be obtained by computing the first derivative of the observed function:
tanα=dP
dl . (3)
Havingtanαwe can define the measure of energy
proportionality as follows: EPC= Z 1 0 sin 2αdl= Z 1 0 2 tanα 1 + tan2αdl. (4)
Figure 2 plots the values of EPC metric for different
values ofαin polar coordinates. Forα=π/4, which
corresponds to a fully proportional case where each increase in the system load leads to an equal increase
in energy consumption, EPC is equal to 1. On the
contrary, forα=−π/4, which means for every increase
in the system load the energy consumption is equally
decreased, the EPC is equal to−1. In between, EPC
turns to zero for α = 0, which describes the case
when system energy consumption is constant and does
not depend on the load, and α=π/2, which is the
asymptote of the power consumption function. Energy proportionality has been first discussed for computing servers [33] and then for network equipment [13], [34]. In [34] the authors analyze how different routing strategies, aware and energy-unaware, affect energy proportionality of several data center network topologies.
Several metrics evaluating energy proportionality have already been proposed in the literature. The Energy Proportionality Index (EPI) [32] captures the difference between the measured power and the ideal power, the power that the device should consume if it is fully energy proportional. EPI is expressed through the idle and peak power only. EPI equal to zero shows that the energy consumption is agnostic to the workload, while EPI equal to 100 % indicates that the device is fully energy proportional.
The Idle-to-peak Power Ratio (IPR) and the Linear Deviation Ratio (LDR) [35] measure the ratio between the idle and the peak power consumptions and devi-ation of the observed power consumption from the fully proportional case respectively. IPR values tending to zero indicate energy proportional designs. LDR, instead, measures maximum deviation of the power consumption from a straight line connecting idle and peak power consumption values. Positive LDR values indicate that the measured power is above the line, while negative values are for the measured power below the line. When power consumption is perfectly linear, the LDR is equal to 0.
Unlike other existing metrics, EPC is able to express energy proportionality of a device or a system in every point of the observed power consumption, for any load level, allowing more accurate estimation. In contrast, EPI and IPR depend only on idle and peak power consumptions and LDR depends only on the absolute value of the highest deviation from a fully proportional case. Similar to EPC, EPI can be computed considering angles of ideal and measured power consumption functions. However, the functions where energy remains constant with the increase in the workload are not taken into account. EPC, instead, can differentiate between constant and non-constant functions.
3.2 Performance-Related Metrics
Cloud computing systems provide on-demand access to the pool of shared computing resources over the Internet. Therefore, communication processes, not computing, often define the efficiency of the cloud. In this section, we present a set of metrics which capture performance and describe energy efficiency of data center communication systems. These metrics combine traditional performance characteristics, such as bandwidth and delay, and data center specific parameters, such as degree of servers’ connectivity.
Network Latency
Cloud applications are found to be extremely sensitive to communication delays [15], [36]. Therefore, an abil-ity to monitor and control network latency is especially important to guarantee Quality of Service (QoS) and Service Level Agreements (SLAs). Network delays are composed of signal transmission time, channel
propagation delay, packet processing delays at every node and queuing delays. As a result, communication latency is proportional to the number of hops between information senders and receivers.
The most important latency-related metric is Up-link/Downlink Communication Latency (UDCL), or Uplink/Downlink Hop Distance (UDHD) if expressed in the number of hops. UDCL measures the time (in seconds) needed for an incoming to the data center request to reach a computing server (downlink) or the time it takes for a computing result to leave the data center network (uplink) and be on the way to the end user. UDCL is added on top of the task execution time for every processed user request. Network topologies hosting computing servers closer to the data center gateway have smaller UDCL and can provide faster response times.
Another important metric is Inter-Server Commu-nication Latency (ISCL), or Inter-Server Hop Distance (ISHD) if expressed in the number of hops. These metrics measure the time (in seconds), or the number of hops, it takes for one task to communicate with another task executed on a different server:
ISHD= 1 N(N−1) N X i=1 N X j=1 j6=i hij, (5)
whereN is the total number of servers, andhij is the
number of hops between the serversi andj.
ISCL and ISHD are particularly relevant for cloud applications whose execution can be parallelized. Their tasks will need to exchange data and will perform faster in network architectures with fewer hops be-tween servers and smaller inter-server delays. How-ever, inter-server delays will make no difference for standalone applications whose execution is confined to single server.
In addition to measuring average values, it is impor-tant to analyze deviation in the distribution of inter-server delays. Small deviation values will characterize data center networks with small distances between computing servers (e.g., switch-centric architectures, such as Al-Fares et al. proposal [37], PortLand [38] and VL2 [39]), and allow placement of interdependent tasks at any server, not depending on its location. However, for data centers with highly variable inter-server delays, such as inter-server-centric architectures like BCube [40] and DCell [41], it becomes highly beneficial to consolidate heavily communicating tasks to reduce network delays and improve performance.
The third delay-related metric is the Database Access Latency (DAL). DAL is defined as an average Round-Trip Time (RTT) measured between computing servers and the data center database. DAL is measured in seconds. An overwhelming majority of cloud applica-tions store and obtain data from database [15]. Thus, reducing the time required for sending a query and receiving data can significantly speed up performance.
Computing Servers Access Layer Aggregation Layer Core Layer Gateway Router DB
Internet Uplink/Downlink Latency (UDCL/UDHD)Inter-server Latency (ISCL/ISHD) Database Access Latency (DAL)
(a) Three-tier architecture.
DB Internet Computing Servers Commodity Switches Level 0 Commodity Switches Levelk= 1 Load Balancers Gateway Router (b) BCube architecture. DB Internet Computing Servers Commodity Switches Levelk= 1 Load Balancers Gateway Router (c) DCell architecture. Fig. 3. Communication latency in different data center architectures.
As an alternative to bringing databases physically closer, a number of data replication techniques can be employed [42]. Data replication reduces DAL for the cached data, but can also introduce traffic overhead for propagating replica updates in the system. Figure 3 illustrates the aforementioned delays in the three-tier, BCube and DCell data center architectures.
Bandwidth Oversubscription Ratio
Bandwidth oversubscription can be defined as the ratio between the aggregate ingress and aggregate egress bandwidth of a network switch [43]. For example, in a typical three-tier topology (see Fig. 3a), Top-of-Rack (ToR) switches are equipped with two 10 Gb/s links
to the aggregation network and can support up to 48 servers in the access network, each connected with a 1 Gb/s link. This entails a Bandwidth
Oversubscrip-tion Ratio (BOR) of (48Gb/s)/(20Gb/s) = 2.4 : 1,
which corresponds to a per-server bandwidth of
(1Gb/s)/2.4 = 416Mb/s under full load. Further bandwidth aggregation of 1.5:1 occurs at the aggrega-tion level, where each switch has eight 10 Gb/s links to the core network and twelve 10 Gb/s links to the access network. As a result, the per-server available band-width can be as low as(416Mb/s)/1.5 = 277Mb/s in a fully loaded topology [43]. Server-centric architectures do not introduce points of bandwidth oversubscription; as a result, BOR is equal to 1.
Computing BOR is important to estimate the min-imum non-blocking bandwidth available to every server. When the computing servers produce more traffic that the available bandwidth, ToR and aggre-gation switches can become congested and start to drop packets from the overflowed buffers, significantly degrading performance of cloud applications.
Network Losses
The packets travelling in a data center network may be lost and fail to reach their destination due to link errors. These losses may cause significant communication delays, as retransmissions are performed only at the transport layer using TCP protocol. For this, it is important to analyze end-to-end error rates at bit and packet levels to assure network performance and the desired level of QoS.
In data centers, interconnection links are not identi-cal. For example, a typical fat-tree three-tier architec-ture (see Fig. 3a) contains optical 10 Gb/s links with
per-link Bit Error Rate (BER) in the range of10−12 to
10−18in the core and access layers. While in the access
layer a less expensive twisted pair gigabit Ethernet
technology is used with BERs as high as10−10.
Know-ing the topology and characteristics of the network links, it becomes possible to calculate average end-to-end error rates depend-to-ending on the communication paths involved, e.g., servers-to-gateway or servers-to-servers. In this paper we define two metrics for error rate estimation. The first is the Uplink/Downlink Error Rate (UDER). UDER measures average BER on the paths between data center gateway and computing servers and is defined as follows:
UDER= 1 N · N X n=1 L X l=1 BERnl, (6)
where N is the number of computing servers,Lis the
number of hierarchical layers in network topology and
BERnl is the BER of the layer l link interconnecting
servernwith the data center gateway.
The Inter-Server Error Rate (ISER), instead, evaluates the average error rate of inter-server communications:
ISER= 1 N(N−1) · N X i=1 N X j=1 j6=i BERij, (7)
where N is the number of computing servers and
BERij is the BER of the path interconnecting server i
and serverj. The latter is calculated as a sum of BERs
of all links between servers iandj.
Measuring error rates is important. It allows diver-sifying resource allocation strategies that take into ac-count sensitivity of cloud applications to transmission errors and helps detecting hardware faults.
Average Link Utilization Ratio
Average Link Utilization Ratio (ALUR) shows average traffic load on data center communication links and can be defined as follows:
ALUR= 1 Ni · Ni X n=1 un, (8)
where un is the utilization ratio of link n andNi is
the number of links of typei. ALUR is an aggregate
network metric and is designed to improve analysis of traffic distribution and load levels in different parts of the data center network. It helps to define proper traffic management policies, can be used to detect network hotspots and becomes an essential tool for preventing performance degradation of cloud applications due to network congestion.
For a three-tier fat tree topology ALUR can be measured separately for the access, aggregation and core segments of the network. High congestion in any of these segments will signal the need to increase the capacity of network links and switches or even reconsider bandwidth oversubscription ratios between these segments. For BCube and DCell topologies, ALUR can be measured over server-to-server and server-to-switch segments of the network.
Average Server Degree Connectivity
Depending on the design strategy, data center topolo-gies are either switch-centric or server-centric. In switch-centric architectures, such as fat-tree, each server is usually connected to a single ToR switch with only one link. In server-centric architectures, instead, the computing servers are connected to several commodity switches (BCube) and/or a number of other servers (DCell) to increase network capacity and provide resilience to node and switch failures.
A higher degree of connectivity increases network capacity, makes the whole topology fault tolerant and helps to balance the load. However, having a high number of connections increases network power consumption as more links and NICs have to be deployed and utilized. To analyze how well the com-puting servers are connected, Average Server Degree Connectivity (ASDC) can be computed:
ASDC= 1 N · N X n=1 cn, (9)
whereN is a total number of data center servers and a
number ofcnnetwork links connects servernto other
devices, switches and/or servers.
3.3 Network Traffic-Related Metrics
Knowing the properties of network traffic is a key to understanding efficiency of data center communication systems. By the direction of signaling, network traffic can be classified into internal and external.
Internal trafficremains within the data center network and accounts for almost 75% of all communications in modern data centers [16]. It is mostly composed of storage and database interactions of cloud applications as well as communications between individual tasks executed in parallel. The performance of data center internal communications is subject to database access delays (metric DAL) as well as bandwidth availability (metric BOR) and latency between servers (metrics ISCL/ISHD). Neither bandwidth nor latency on the uplink and downlink paths of the data center network affect the performance of internal communications significantly.
External traffic is that destined to the end users. It
includes the traffic produced by cloud applications as well as inter data center traffic [16]. The external traffic is highly sensitive to the available bandwidth (metric BOR) and communication latency in the uplink and downlink (metrics UDCL/UDHD). At the same time, the bandwidth and communication latency be-tween servers (metrics ISCL/ISHD) do not affect the performance of external communications significantly.
The proportion between internal and external data center traffic can be estimated as follows.
• Internal Traffic Ratio (ITR) is the ratio of the traffic that remains inside the data center to the total data center traffic:
ITR= Internal Traffic
Total Data Center Traffic. (10)
• External Traffic Ratio (ETR) is the fraction of traffic that leaves the data center network:
ETR= 1−ITR= External Traffic
Total Data Center Traffic. (11)
In addition to categorizing network traffic according to its destination, it is important to distinguish user-or application-related messaging from the rest of the traffic which includes network management and monitoring. The latter is required to operate commu-nication networks. Management operations include transmissions for address resolution (e.g., ARP) and routing (e.g., OSPF and RIP). Control messaging and problem detection (e.g., ICMP) can also be attributed to management operations, while SNMP traffic is related to monitoring operations. The Management and Monitoring Traffic Ratio (MMTR) helps to unveil traffic overhead for network management and can be computed as follows:
MMTR=Management and Monitoring Traffic
Total Data Center Traffic .
(12) To obtain the energy spent on network management and not for transporting application-related traffic, we can use the CNEE metric (showing communication network energy efficiency) and compute Management and Monitoring Traffic Energy (MMTE) as follows:
MMTE=CNEE·Management and Monitoring Traffic. (13)
MMTE is measured in Joules and shows the amount of energy consumed by the communication equipment to keep the network operational. In an ideal case MMTE should assume values close to zero, when most of the consumed energy is attributed to application-related traffic delivered at the full effective network capacity.
Understanding data center traffic is very important. Network traffic analysis at the micro- and macroscopic levels can help in estimating the impact on network processes [44], design traffic engineering solutions [45], capture interdependencies between executed work-loads [46], and optimize communication between several geographically distributed data centers [47].
4
E
VALUATION ANDN
UMERICALE
XAM-PLES
This section presents evaluation and numerical com-parison of the proposed metrics in categories of power, performance, and network traffic of data center communication systems.
4.1 Evaluation Scenario
Several data center architectures have been proposed in the literature [48], [49]. For evaluation purposes, we consider the following four architectures: fat-tree three-tier [37], [38], [39], BCube [40], DCell [41] and Optically cross-braced Hypercube [50] (OH). For a fair comparison, all the architectures are configured to host 4096 computing servers.
In the fat-tree three-tier topology, these servers are arranged into 128 racks and served by 8 core and 16 aggregation switches. The core and aggregation switches as well as the aggregation and access switches are interconnected using 10 Gb/s,0.24µs optical links. The links connecting computing servers and access
network ToR switches are 1 Gb/s,0.01µs twisted pair
links.
In the BCube and DCell topologies, the 4096
com-puting servers are arranged in groups of n= 8. This
entails a BCube architecture of level k = 4 with 3
layers of commodity switches per group of servers
and a level k = 2 DCell. 1 Gb/s links are used to
interconnect computing servers with the commodity switches. In the lowest layer these links are 2 meters long, while in the upper layers they are 10 and 50 meters long, respectively. The gateway router is con-nected to the data center network through a number of load balancers using 50 m long, 40 Gb/s optical fibers.
In OH, 12 hypercube dimensions are needed to
support 4096 servers. This requires12·212/4 = 12228
2-by-2 optical switches for interconnection.
In all architectures, optical fibers are assumed to support single-mode light propagation for a 1550 nm operating wavelength.
This article has been accepted for publication in a future issue of this journal, but has not been fully edited. Content may change prior to final publication. Citation information: DOI 10.1109/TCC.2015.2424892, IEEE Transactions on Cloud Computing
IEEE TRANSACTIONS ON CLOUD COMPUTING, 2015 9
Load= 0 Servers Access Layer Aggregation Layer Core Layer → → Increasing Load → → Load= 1
Idle link; Active link; Idle device; Active device;
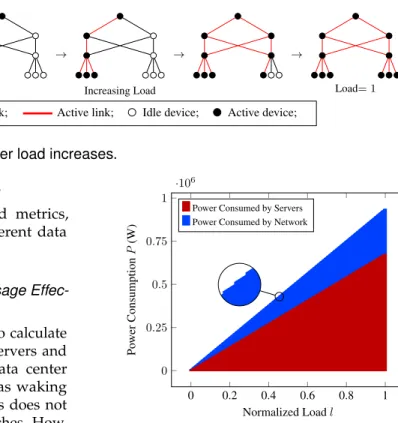
Fig. 4. Powering up equipment as data center load increases. 4.2 Evaluation of Power-Related Metrics
In this section we evaluate power-related metrics, including CNEE, NPUE and EPC, for different data center architectures.
Evaluation of Network Energy and Power Usage Effec-tiveness
To obtain CNEE and NPUE it is necessary to calculate the power consumption of the computing servers and network equipment as the load of the data center increases. This increase can be non-linear as waking up new servers in already operational racks does not require waking up additional network switches. How-ever, starting up a new rack would require powering on the top-of-rack switch and possibly aggregation and core switches. Figure 4 illustrates this concept using a three-tier topology.
To estimate the power consumption of a single server we selected the most widely used hardware models from different vendors, Dell PowerEdge R720 [51], Huawei Tecal RH2288H V2 [52], and IBM System x3500 M4 [53], and computed their average peak and idle power consumptions. Assuming the servers imple-ment Dynamic Voltage and Frequency Scaling (DVFS),
their power consumption P(l) can be estimated as
follows [54]: P(l) =Pidle+ Ppeak−Pidle 2 ·(1 +l−e −(l τ)), (14)
where l is the load of the server andτ is the
utiliza-tion level at which servers attain asymptotic power consumption, which is typically in the range[0.5,0.8].
For network equipment we considered HP Flex-Fabric 11908 [55] to be used in the aggregation and core layers of the fat tree three-tier architecture, and HP 5900 AF [56] for the ToR and the commodity switches in BCube and DCell architectures. Finally, PRISMA II optical switches are considered for OH architecture [57].
Figure 5 shows normalized power consumption of the data center IT equipment for a fat-tree three-tier architecture. The power consumed by the servers excludes network interface card power consumption, which is included in network power consumption. The leaps highlighted in the zoomed part correspond to a server wake up in a previously idle rack. It causes a wake up of the access, aggregation and core layer
0 0.2 0.4 0.6 0.8 1 0 0.25 0.5 0.75 1 ·106 Normalized Loadl Po wer Consumption P (W)
Power Consumed by Servers Power Consumed by Network
0
0.2
0.4
0.6
0.8
1
0
0
.
25
0
.
5
0
.
75
1
·
10
Normalized Load
l
Po
wer
Consumption
P
(W)
Power Consumed by Servers
Power Consumed by Network
Fig. 5. IT power consumption in fat tree three-tier data center.
TABLE 2
Evaluation of Power-related Metrics.
METRICS ARCHITECTURES
Three-tier BCube DCell OH CNEE 0.203 µJ/bit 0.109 µJ/bit 0.027 µJ/bit 0.033 µJ/bit NPUE 3.58 2.50 6.86 5.99
switches and leads to non-proportionality in network power consumption.
The CNEE computed for all four data center ar-chitectures considered is reported in the first row of Table 2. The CNEE is the highest for the fat-tree three-tier topology, which is mainly caused by high bandwidth oversubscriptions performed at several layers. As a result, the energy is spent to support higher bitrates, but they cannot be fully utilized by the servers. In contrast, the throughput in BCube and DCell architectures can achieve 100 % of the network capacity. CNEE, besides being sensitive to bandwidth oversubscription, also depends on the overall network power consumption. This is the reason why CNEE is higher for BCube than for DCell. BCube hosts a
large number of commodity switches(k+ 1)·nk(2048),
while DCell has only one commodity switch per group
of n servers (512). OH architecture hosts 12228
2-by-2 optical switches whose power consumption is significantly lower than commodity switches used for BCube and DCell. As a result, the CNEE value computed for OH topology is more similar to the DCell value rather than that of BCube.
0 0.2 0.4 0.6 0.8 1 0 0.2 0.4 0.6 0.8 1 Normalized Loadl Normalized Po wer Consumption Switch 1 EPC= 0.69; Switch 2 EPC= 0.2; Switch 3 EPC= 0; Switch 4 EPC=−0.89;
Fig. 6. Power consumption profiles of different network switches.
Having evaluated energy spent to deliver a single bit of information, it is possible to assess the overall power effectiveness of data center networks with NPUE. With the lowest NPUE, BCube appears to be the most power-hungry topology. As already mentioned, it is due to the fact that BCube hosts a high number of switches. In addition to the number of network devices, their power efficiency plays an important role in NPUE. For example, DCell has a higher number of switches when compared with the three-tier topology. However, these are commodity switches whose power consumption is several magnitudes lower that the consumption of core and aggregation level switches. Despite low power consumption of individual optical switches, OH architecture has lower NPUE than DCell. In OH, transceivers and the high number of active ports per servers are the two main components contributing to network power consumption.
Evaluation of Energy Proportionality
Figure 6 shows normalized power consumption along with the computed EPC values for several network switches with different profiles. The dashed line rep-resents an ideal case with EPC equal to 1.
Switch 1 shows a curvilinear behavior. For
in-termediate loads in the range (0.2,0.8), the power
consumption increases at a smaller rate than the workload, while for the low (<0.2) and high(>0.8)
load levels it increases more rapidly than the incoming workload. As a result, the obtained EPC is equal to 0.69. With EPC equal to 0.2, switch 2 shows a realistic energy consumption profile with a large idle part and a stepwise power consumption attributed to communication ports. This is very close to the case represented by Switch 3. Being completely insensitive to the workload, EPC value of Switch 3 is equal to 0.
Switch 4 has negative EPC equal to −0.89. It signals
that the device starts consuming less energy as the workload increases.
4.3 Evaluation of Performance-Related Metrics
This subsection presents evaluation results of the proposed metrics for network latency (UDCL, UDHD, ISCL, ISHD, DAL), network losses (UDER, ISER) and connectivity (ASDC) with the exception of BOR and ALUR. Server-centric architectures typically do not introduce points of bandwidth multiplexing and oversubscription, which makes their BOR metric to be equal to 1. Computing ALUR metric requires having per-link traffic statistics, which can be obtained either from detailed traces or, more realistically, directly measured in real data centers during runtime.
Network Latency, Network Losses and Server Degree Connectivity
To evaluate UDCL, ISCL, DAL, UDER and ISER we considered transmission of two test packets of 40 Bytes and 1500 Bytes, corresponding to a TCP acknowl-edgement and a maximum Ethernet transmission unit respectively. A one-way transmission delay is measured for UDCL and ISCL, and a round-trip delay for DAL. For signal losses, a BER of10−12is considered
for copper cables and10−14 for optical fibers. As no
other traffic is present in the data center network, Ethernet inter-frame gap and thus queuing delays can be neglected.
The network delay of a single packet is composed of
the transmission delayDt and link propagation delay
Dp.Dt is expressed as a ratio between packet sizeS
and link rateR, whileDp is defined as the link length
Lover the signal propagation speedP:
Dt= S
R, Dp= L
P. (15)
P defines the physical characteristic of the medium.
In copper it is two thirds of the light speedc, while
in optical fiber the speed of light is scaled with the
refractive index, taken to be equal to1.468 for glass
fiber [58].
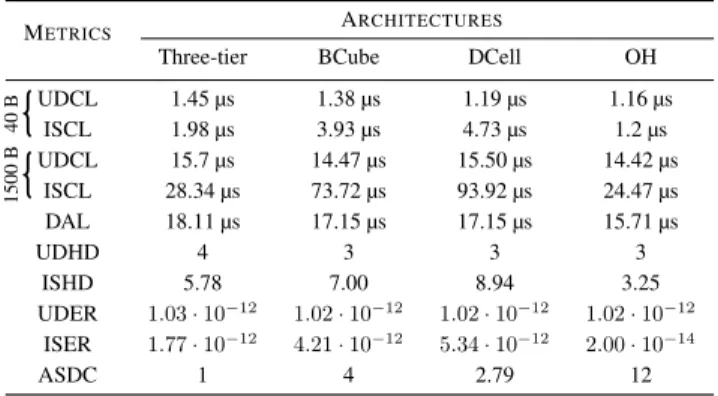
Table 3 presents the results for network latency, losses and connectivity related metrics. The results show that the OH architecture can provide better support to internal communications with ISCL, ISHD and ISER all being lower in comparison to the other architectures. The result is expected as OH is the architecture with the highest ASDC value, which guarantees having short paths even between distant servers. With respect to BCube and DCell, the three-tier topology supports internal communications better. This might be surprising as the three-tier connectivity degree measured with ASDC is the lowest among all architectures. However, both BCube and DCell, while being much better interconnected, need to traverse a large number of hops to communicate between distant servers.
The error rate between servers, measured by ISER, is the highest for BCube and DCell due to their heavy reliance on copper links. The error rate between
TABLE 3
Evaluation of Network Latency, Network Losses and Server Degree Connectivity.
METRICS ARCHITECTURES
Three-tier BCube DCell OH
UDCL 1.45 µs 1.38 µs 1.19 µs 1.16 µs ISCL 1.98 µs 3.93 µs 4.73 µs 1.2 µs UDCL 15.7 µs 14.47 µs 15.50 µs 14.42 µs ISCL 28.34 µs 73.72 µs 93.92 µs 24.47 µs 40 B 1500 B DAL 18.11 µs 17.15 µs 17.15 µs 15.71 µs UDHD 4 3 3 3 ISHD 5.78 7.00 8.94 3.25 UDER 1.03·10−12 1.02·10−12 1.02·10−12 1.02·10−12 ISER 1.77·10−12 4.21·10−12 5.34·10−12 2.00·10−14 ASDC 1 4 2.79 12
servers and the gateway, measured with UDER, on the contrary, is lower in BCube and DCell as packets sent by the servers traverse fewer number of hops to reach the gateway.
4.4 Evaluation of Network Traffic-Related Metrics
To evaluate network traffic related metrics MMTR and MMTE we used packet traces collected in real data centers, UNIV1 and UNIV2 [59]. Along with the user application data these traces also include ARP, ICMP, OSPF and RIP flows. Both data centers follow a two-tier architecture design. The traces contain one and a half hours of traffic for UNIV1 and two and a half hours for UNIV2 data centers.
To analyze the fraction of network management and monitoring traffic we computed MMTR, which is 0.79% for UNIV1 and 0.025% for UNIV2 data centers. The results show that although UNVI1 has a smaller number of network devices, its network is managed less efficiently.
Table 4 shows energy consumed by the data center network to process and deliver management and monitoring traffic. The MMTE metric is computed taking into account data center topologies presented in Section 4.1. As expected, the energy consumption of UNIV2 management and monitoring traffic is lower than in UNIV1 for all the architectures. DCell always outperforms other architectures as it spends the lowest energy to transfer a single bit of information (see CNEE values reported in Table 2), while the fat-tree three-tier architecture is the most energy consuming topology.
The choice of the employed resource allocation strategy would certainly impact most of the presented metrics. Workload (or VM) migration would increase the radio of monitoring and management traffic in MMTR and MMTE metrics, increase a portion of the internal traffic in ITR and ETR metrics, and even change average link utilization ratio (ALUR). This again confirms that a set of presented metrics could become an essential tool in developing and refining
TABLE 4
Evaluation of Management and Monitoring Traffic Energy.
MMTE ARCHITECTURES
Three-tier BCube DCell OH UNIV1 169.19J 90.62J 22.23J 27.31J UNIV2 30.98J 16.59J 4.09J 5.00J
resource allocation in cloud computing data centers and can lead to novel network-aware scheduling solutions [60], [61].
5
D
ISCUSSIONEnergy efficiency and infrastructure monitoring are two of the main parameters for successful data center operation. The proposed framework of metrics is positioned to become an essential tool for monitoring, comparing and assessing performance of data center communication systems.
The power-related metrics (see Section 3.1), such as NPUE, assess with a fine granularity energy efficiency of the network and allow data center operators to opti-mize their investments in networking equipment and interconnects. The performance-related metrics (see Section 3.2), such as ALUR, enable detailed monitoring and assessment of network throughput, delay and error rate performance. They are especially relevant for the largest class of SaaS cloud applications which often communicate intensively with the end users and also internally. The analysis of these metrics helps to ensure and guarantee QoS and SLA to the customers. Finally, network traffic-related metrics (see Section 3.3) permit the development of proper traffic management and infrastructure-aware resource allocation policies. The proposed framework of metrics for networks of cloud computing data centers is essential for optimization of operation and to plan capacity extensions of existing facilities as well as the design of future data centers.
In addition, the proposed metrics are easy-to-integrate metrics into existing data center monitoring systems, such as VMware vCenter Log Insight [62] or Cisco Prime Data Center Network Manager [63]. Most data center monitoring systems already provide infor-mation that is required for computing these metrics, including runtime power consumption, link utilization levels or error rates. For example, simple analysis of destination addresses can help to differentiate between the internal and outgoing data center traffic. Data center monitoring software maintains statistics for each server, for example the status of the links. Con-sequently, a simple query on the average number of active links for each server will allow the computation of the ASDC metric. The availability of up-to-date link- and traffic-related statistical information enables the design of network-aware resource allocation and scheduling solutions.
TABLE 5
Performance comparison of evaluated architectures. Values are categorized as (H) High, (M) Medium and (L) Low.
ARCHITECTURES METRICS
CNEE NPUE UDCL UDHD ISCL ISHD DAL UDER ISER ASDC MMTE Three-tier H M M M L M H L H L H
BCube M L M L H H M L H M M DCell L H M L H H M L H M L
OH L M M L L L L L L H L
Table 5 provides a top-level comparison of the evaluated data center architectures. For the purpose of simplicity, the values are reported as high (H), medium (M) and low (L), while the precise mea-surement values and evaluation details are reported in Section 4. High bandwidth oversubscription of the three-tier architecture prevents computing servers from exploiting full available network capacity and, as a consequence, leads to the highest energy-per-bit consumption. DCell appears as the most “green” architecture with the lowest energy-per-bit ratio and high power usage effectiveness. BCube is less effective in terms of the power usage effectives because it hosts the highest number of switches. The analysis of communication latency shows that hierarchical architectures, such as three-tier fat tree, favor internal server-to-server communications, while distributed data center architectures, including BCube and DCell have shorter paths for the traffic directed out of the data center. On the other hand, server-centric architectures, such as OH, can reduce the number of hops between distant servers significantly. As a consequence, they provide better support to internal communications than hierarchical architectures.
6
C
ONCLUSIONThis paper proposed a framework of new metrics for assessing efficiency of communication networks in cloud computing data centers. These metrics inves-tigate the efficiency from energy, performance and traffic related perspectives. Power-related metrics can measure the efficiency of the process of turning electric-ity into the job of information delivery. Performance-related metrics analyze traditional characteristics of communication systems like network latency, available bandwidth and error rates. Finally, network traffic related metrics provide insights about the nature of the traffic and energy spent to transport different traffic categories.
The evaluation and validation of the framework has been performed for hierarchical (three-tier) and distributed (BCube, DCell and Hypercube) data center architectures. The results helped to unveil a number of properties of these architectures.
The proposed framework of metrics is positioned to become an essential tool for academy researchers
and industry specialists in the field of communication systems and cloud computing data centers. The future work will be related to the proposal of the presented set of metrics for standardization and performing evaluation in operational data centers.
A
CKNOWLEDGMENTSThe authors would like to acknowledge the funding from National Research Fund, Luxembourg in the framework of ECO-CLOUD project (C12/IS/3977641).
R
EFERENCES[1] G. Sauls, “Measurement of data centre power consumption,” Falcon Electronics Pty LTD, White Paper.
[2] M. Uddin, A. A. Rahman, and A. Shah, “Criteria to select energy efficiency metrics to measure performance of data centre,”International Journal of Energy Technology and Policy, vol. 8, no. 3, pp. 224–237, 2012.
[3] P. A. Mathew, S. E. Greenberg, S. Ganguly, D. A. Sartor, and W. F. Tschudi, “How does your data center measure up? Energy efficiency metrics and benchmarks for data center infrastructure systems,”HPAC Journal, 2009.
[4] L. Wang and S. U. Khan, “Review of performance metrics for green data centers: a taxonomy study,” The Journal of Supercomputing, vol. 63, no. 3, pp. 639–656, 2013.
[5] The Green Grid, “Harmonizing global metrics for data center energy efficiency,” 2014, White Paper.
[6] M. K. Herrlin, “Airflow and cooling performance of data centers: Two performance metrics.”ASHRAE Transactions, vol. 114, no. 2, pp. 182 – 187, 2008.
[7] R. Tozer and M. Salim, “Data center air management metrics-practical approach,” in12th IEEE Intersociety Conference on Thermal and Thermomechanical Phenomena in Electronic Systems (ITherm), 2010, pp. 1–8.
[8] S. Flucker and R. Tozer, “Data centre cooling air performance metrics,” inCIBSE Technical Symposium, Leicester, CIBSE, 2011. [9] E. Volk, A. Tenschert, M. Gienger, A. Oleksiak, L. Siso, and J. Salom, “Improving energy efficiency in data centers and federated cloud environments: comparison of CoolEmAll and Eco2Clouds approaches and metrics,” in2013 Third International Conference on Cloud and Green Computing (CGC), Sept 2013, pp. 443–450.
[10] D. Cole, “Data center energy efficiency - looking beyond the PUE,” http://www.missioncriticalmagazine.com/ ext/resources/MC/Home/Files/PDFs/WP LinkedIN% 20DataCenterEnergy.pdf, 2011, White Paper.
[11] D. Kliazovich, P. Bouvry, F. Granelli, and N. Fonseca, “Energy consumption optimization in cloud data centers,” inCloud Services, Networking, and Management, edited by N. Fonseca and R. Boutaba, Eds. Wiley-IEEE Press, May 2015.
[12] B. Heller, S. Seetharaman, P. Mahadevan, Y. Yiakoumis, P. Sharma, S. Banerjee, and N. McKeown, “Elastictree: Saving energy in data center networks.” inNSDI, vol. 3, 2010, pp. 19–21.
[13] D. Abts, M. R. Marty, P. M. Wells, P. Klausler, and H. Liu, “Energy proportional datacenter networks,” inACM SIGARCH Computer Architecture News, vol. 38, no. 3. ACM, 2010, pp. 338–347.
[14] “Cloud computing market,” http://www.zdnet.com/blog/btl/ cloud-computing-market-241-billion-in-2020/47702, 2011. [15] D. Kliazovich, J. E. Pecero, A. Tchernykh, P. Bouvry, S. U.
Khan, and A. Y. Zomaya, “CA-DAG: Modeling Communication-Aware Applications for Scheduling in Cloud Computing,”
Journal of Grid Computing, 2015.
[16] Cisco, “Cisco Global Cloud Index: Forecast and Methodology, 2012-2017,” 2013, White paper.
[17] The Green Grid, “Data center power efficiency metrics: PUE and DCiE,” 2008, White Paper.
[18] J. Yuventi and R. Mehdizadeh, “A critical analysis of power usage effectiveness and its use as data center energy sustain-ability metrics,” http://cife.stanford.edu/sites/default/files/ WP131 0.pdf, 2013.
[19] The Green Grid, “A metric for measuring the benefit of reuse energy from a data center,” 2010, White Paper.
[20] “UPS load factor,” http://hightech.lbl.gov/benchmarking-guides/data-p1.html, 2009.
[21] The Green Grid, “A framework for data center energy produc-tivity,” 2008, White Paper.
[22] “Data center efficiency - beyond PUE and DCiE,” http://blogs.gartner.com/david cappuccio/2009/02/15/ data-center-efficiency-beyond-pue-and-dcie/, 2009.
[23] J. W. Vangilder and S. K. Shrivastava, “Real-time prediction of rack-cooling performance,”ASHRAE Transactions, pp. 151–162, 2006.
[24] J. W. Vangilder and S. Shrivastava, “Capture index: An airflow-based rack cooling performance metric,”ASHRAE Transactions, vol. 113, no. 1, pp. 126–136, 2007.
[25] P. Mathew, “Self-benchmarking guide for data centers: Metrics, benchmarks, actions,” 2010.
[26] F. Michaut and F. Lepage, “Application-oriented network metrology: Metrics and active measurement tools,” IEEE Communications Surveys & Tutorials, vol. 7, no. 2, 2005. [27] A. Hanemann, A. Liakopoulos, M. Molina, and D. M. Swany, “A
study on network performance metrics and their composition,”
Campus-Wide Information Systems, vol. 23, no. 4, pp. 268–282, 2006.
[28] R. Baumann, S. Heimlicher, M. Strasser, and A. Weibel, “A survey on routing metrics,”TIK Report, vol. 262, 2007. [29] H. Khandelwal, R. R. Kompella, and R. Ramasubramanian,
“Cloud monitoring framework,” 2010, white Paper.
[30] L. Popa, S. Ratnasamy, G. Iannaccone, A. Krishnamurthy, and I. Stoica, “A cost comparison of datacenter network architectures,” inProceedings of the 6th International Conference, ser. Co-NEXT. New York, NY, USA: ACM, 2010, pp. 16:1–16:12. [Online]. Available: http://doi.acm.org/10.1145/ 1921168.1921189
[31] G. Chen, W. He, J. Liu, S. Nath, L. Rigas, L. Xiao, and F. Zhao, “Energy-Aware Server Provisioning and Load Dispatching for Connection-Intensive Internet Services.” inNSDI, vol. 8, 2008, pp. 337–350.
[32] P. Mahadevan, P. Sharma, S. Banerjee, and P. Ranganathan, “A power benchmarking framework for network devices,” in
NETWORKING 2009. Springer, 2009, pp. 795–808.
[33] L. Barroso and U. Holzle, “The Case for Energy-Proportional Computing,”Computer, vol. 40, no. 12, pp. 33–37, 2007. [34] Y. Shang, D. Li, and M. Xu, “A Comparison Study of Energy
Proportionality of Data Center Network Architectures,” in
32nd International Conference on Distributed Computing Systems Workshops (ICDCSW), 2012, pp. 1–7.
[35] G. Varsamopoulos and S. K. S. Gupta, “Energy Proportionality and the Future: Metrics and Directions,” in39th International Conference on Parallel Processing Workshops (ICPPW), 2010, pp. 461–467.
[36] P. Fan, J. Wang, Z. Zheng, and M. Lyu, “Toward Optimal Deployment of Communication-Intensive Cloud Applications,” inIEEE International Conference on Cloud Computing (CLOUD), 2011, pp. 460–467.
[37] M. Al-Fares, A. Loukissas, and A. Vahdat, “A scalable, commodity data center network architecture,” inProceedings of the ACM SIGCOMM 2008 Conference on Data Communication, ser. SIGCOMM ’08. New York, NY, USA: ACM, 2008,
pp. 63–74. [Online]. Available: http://doi.acm.org/10.1145/ 1402958.1402967
[38] R. Niranjan Mysore, A. Pamboris, N. Farrington, N. Huang, P. Miri, S. Radhakrishnan, V. Subramanya, and A. Vahdat, “PortLand: a scalable fault-tolerant layer 2 data center network fabric,” inACM SIGCOMM Computer Communication Review, vol. 39, no. 4. ACM, 2009, pp. 39–50.
[39] A. Greenberg, J. R. Hamilton, N. Jain, S. Kandula, C. Kim, P. Lahiri, D. A. Maltz, P. Patel, and S. Sengupta, “VL2: a scalable and flexible data center network,” inACM SIGCOMM Computer Communication Review, vol. 39, no. 4. ACM, 2009, pp. 51–62. [40] C. Guo, G. Lu, D. Li, H. Wu, X. Zhang, Y. Shi, C. Tian, Y. Zhang, and S. Lu, “BCube: a high performance, server-centric network architecture for modular data centers,”ACM SIGCOMM Computer Communication Review, vol. 39, no. 4, pp. 63–74, 2009.
[41] C. Guo, H. Wu, K. Tan, L. Shi, Y. Zhang, and S. Lu, “DCell: a scalable and fault-tolerant network structure for data centers,” inACM SIGCOMM Computer Communication Review, vol. 38, no. 4. ACM, 2008, pp. 75–86.
[42] D. Boru, D. Kliazovich, F. Granelli, P. Bouvry, and A. Y. Zomaya, “Energy-Efficient Data Replication in Cloud Computing Data-centers,”Springer Cluster Computing, vol. 18, no. 1, pp. 385–402, 2015.
[43] “Cisco Data Center Infrastructure 2.5 Design Guide,” https://www.cisco.com/application/pdf/en/us/guest/ netsol/ns107/c649/ccmigration 09186a008073377d.pdf, 2007. [44] T. Benson, A. Akella, and D. A. Maltz, “Network traffic
characteristics of data centers in the wild,” inProceedings of the 10th ACM SIGCOMM Conference on Internet measurement. ACM, 2010, pp. 267–280.
[45] T. Benson, A. Anand, A. Akella, and M. Zhang, “Understanding data center traffic characteristics,”ACM SIGCOMM Computer Communication Review, vol. 40, no. 1, pp. 92–99, 2010. [46] S. Kandula, S. Sengupta, A. Greenberg, P. Patel, and R. Chaiken,
“The nature of data center traffic: measurements & analysis,” inProceedings of the 9th ACM SIGCOMM Conference on Internet measurement. ACM, 2009, pp. 202–208.
[47] Y. Chen, S. Jain, V. K. Adhikari, Z.-L. Zhang, and K. Xu, “A first look at inter-data center traffic characteristics via Yahoo! datasets,” inINFOCOM, 2011 Proceedings IEEE. IEEE, 2011, pp. 1620–1628.
[48] M. Bari, R. Boutaba, R. Esteves, L. Granville, M. Podlesny, M. Rabbani, Q. Zhang, and M. Zhani, “Data center network virtualization: A survey,” Communications Surveys Tutorials, IEEE, vol. 15, no. 2, pp. 909–928, Second 2013.
[49] A. Hammadi and L. Mhamdi, “A survey on architectures and energy efficiency in data center networks,” Computer Communications, vol. 40, no. 0, pp. 1 – 21, 2014. [Online]. Available: http://www.sciencedirect.com/science/article/pii/ S0140366413002727
[50] H. Cui, D. Rasooly, M. R. N. Ribeiro, and L. Kazovsky, “Opti-cally cross-braced hypercube: A reconfigurable physical layer for interconnects and server-centric datacenters,” inOptical Fiber Communication Conference and Exposition (OFC/NFOEC), 2012 and the National Fiber Optic Engineers Conference, March 2012, pp. 1–3.
[51] “Dell PowerEdge R720 Specification Sheet,” http: //www.dell.com/downloads/global/products/pedge/dell-poweredge-r720-spec-sheet.pdf, 2012.
[52] “Huawei Tecal RH2288H V2,” http://enterprise.huawei. com/en/products/itapp/server/rh-series-rack-servers/hw-261421.htm, 2013.
[53] “IBM System x3500 M4,” http://www-03.ibm.com/systems/ x/hardware/tower/x3500m4/specs.html, 2013.
[54] “Server power and performance characteristics,” http://www. spec.org/power ssj2008/.
[55] “HP FlexFabric 11900 switch series quickspecs,” http://h18000.www1.hp.com/products/quickspecs/14585 div/14585 div.pdf, 2013.
[56] “HP 5900 switch series quickspecs,” http://h18004.www1.hp. com/products/quickspecs/14252 div/14252 div.pdf, 2013. [57] “Scientific Atlanta - Cisco company - PRISMA II
Ancillary Modules,” http://www.cisco.com/c/dam/en/ us/products/collateral/video/prisma-ii/product data sheet0900aecd806c4b0e.pdf, 2008.
[58] “Calculating optical fiber latency,” http://www.m2optics.com/ blog/?Tag=refractive%20index, 2012.
[59] “Data Set for IMC 2010 Data Center Measurement,” http:// pages.cs.wisc.edu/∼tbenson/IMC10 Data.html, 2010.
[60] D. Kliazovich, S. Arzo, F. Granelli, P. Bouvry, and S. Khan, “e-STAB: Energy-efficient scheduling for cloud computing applications with traffic load balancing,” inIEEE International Conference on Green Computing and Communications (GreenCom), Aug 2013, pp. 7–13.
[61] D. Kliazovich, P. Bouvry, and S. Khan, “DENS: data center energy-efficient network-aware scheduling,”Cluster Computing, Special Issue on Green Networks, vol. 16, pp. 69–75, 2013. [62] “VMware vCenter Log Insight,” https://my.vmware.com/
web/vmware/evalcenter?p=log-insight, 2014.
[63] “Cisco Prime Data Center Network Manager,”
http://www.cisco.com/c/en/us/products/cloud- systems-management/prime-data-center-network-manager/index.html, 2014.
Claudio Fiandrinois currently working to-ward his PhD degree at the University of Luxembourg. He received the Bachelor De-gree in Ingegneria Telematica in 2010 and the Master Degree in Computer and Communica-tion Networks Engineering in 2012 both from Politecnico di Torino. His primary research interests include mobile cloud computing, data center communication systems and next generation networks.
Dzmitry Kliazovich (M03-SM12) is a Re-search Fellow at the Faculty of Science, Tech-nology, and Communication of the University of Luxembourg. He holds an award-winning Ph.D. in Information and Telecommunication Technologies from the University of Trento (Italy). Dr. Kliazovich is a holder of a large number of scientific awards, mainly from the IEEE Communications Society, European Research Consortium for Informatics and Mathematics (ERCIM) and Italian Ministry of Education. His work on energy-efficient scheduling in cloud computing environments received Best Paper Award at the IEEE/ACM International Conference on Green Computing and Communications (GreenCom) in 2010. He served as general and TPC chair in a number of high-ranked international conferences, including the IEEE International Conference on Cloud Networking (CLOUDNET 2014). Dr. Kliazovich is the author of more than 100 research papers and Editorial Board Member of the IEEE Communications Surveys and Tutorials. His main research activities are in the field of energy efficient communications, cloud computing, and next-generation networking.
Pascal Bouvry earned his Master degree in Computer Science with distinction (’91) from the University of Namur, Belgium. He went on to obtain his Ph.D. degree (’94) in Computer Science with great distinction at the University of Grenoble (INPG), France. His research at the IMAG laboratory focused on Mapping and scheduling task graphs onto Distributed Memory Parallel Computers. Next, he performed post-doctoral research on coordination languages and multi-agent evolutionary computing at CWI in Amsterdam and gained industrial experience (banking, telecom, space, semi-conductor manufacturers) in different companies on 3 continents (FICS, Spacebel, SDC, Metasolv). Professor Bouvry is currently holding a full professor position at the University of Luxembourg in computer science. His current interests encompass optimization, parallel/cloud computing, ad hoc networks and bioinformatics.
Albert Y. Zomaya (S’88-M’91-SM’97-F’04)
is currently the Chair Professor of High Per-formance Computing & Networking and Aus-tralian Research Council Professorial Fellow in the School of Information Technologies, The University of Sydney. He is also the Director of the Centre for Distributed and High Performance Computing which was estab-lished in late 2009. He is the author/co-author of seven books, more than 400 publications in technical journals and conferences, and the editor of 14 books and 17 conference volumes. He is currently the Editor in Chief of the IEEE Trans. on Computers and serves as an associate editor for 19 journals including some of the leading journals in the field. Professor Zomaya was the Chair the IEEE Technical Committee on Parallel Processing (1999-2003) and currently serves on its executive committee. He also serves on the advisory board of the IEEE Technical Committee on Scalable Computing, the advisory board of the Machine Intelligence Research Labs. Professor Zomaya served as General and Program Chair for more than 60 events and served on the committees of more than 600 ACM and IEEE conferences. He delivered more than 130 keynote addresses, invited seminars and media briefings. Professor Zomaya is a Fellow of the IEEE, AAAS, the Institution of Engineering and Technology (U.K.), a Distinguished Engineer of the ACM and a Chartered Engineer (CEng). He received the 1997 Edgeworth David Medal from the Royal Society of New South Wales for outstanding contributions to Australian Science. He is also the recipient of the IEEE Computer Society’s Meritorious Service Award and Golden Core Recognition in 2000 and 2006, respectively. Also, he received the IEEE TCPP Outstanding Service Award and the IEEE TCSC Medal for Excellence in Scalable Computing, both in 2011. His research interests are in the areas of parallel and distributed computing and complex systems.