Zurich Open Repository and Archive University of Zurich Main Library Strickhofstrasse 39 CH-8057 Zurich www.zora.uzh.ch Year: 2013
Do financial incentives affect firms’ demand for disabled workers? Lalive, Rafael ; Wuellrich, Jean-Philippe ; Zweimüller, Josef
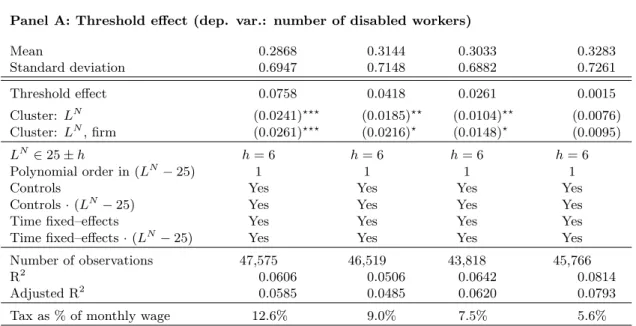
Abstract: A number of OECD countries aim to encourage work integration of disabled persons using quota policies. For instance, Austrian firms must provide at least one job to a disabled worker per 25 nondisabled workers and are subject to a tax if they do not. This “threshold design” provides causal estimates of the noncompliance tax on disabled employment if firms do not manipulate nondisabled employment; a lower and upper bound on the causal effect can be constructed if they do. Results indicate that firms with 25 nondisabled workers employ about 0.04 (or 12%) more disabled workers than without the tax; firms do manipulate employment of nondisabled workers but the lower bound on the employment effect of the quota remains positive; employment effects are stronger in low-wage firms than in high-wage firms; and firms subject to the quota of two disabled workers or more hire 0.08 more disabled workers per additional quota job. Moreover, increasing the noncompliance tax increases excess disabled employment, whereas paying a bonus to overcomplying firms slightly dampens the employment effects of the tax.
DOI: https://doi.org/10.1111/j.1542-4774.2012.01109.x
Posted at the Zurich Open Repository and Archive, University of Zurich ZORA URL: https://doi.org/10.5167/uzh-74787
Journal Article Accepted Version
Originally published at:
Lalive, Rafael; Wuellrich, Jean-Philippe; Zweimüller, Josef (2013). Do financial incentives affect firms’ demand for disabled workers? Journal of the European Economic Association, 11(1):25-58.
Do Financial Incentives Affect Firms’ Demand
For Disabled Workers?
Rafael Lalive, University of Lausanne∗
Jean-Philippe Wuellrich, University of Zurich Josef Zweim¨uller, University of Zurich
March 8, 2011
Abstract
A number of OECD countries aim to encourage work integration of disabled persons using quota policies. For instance, Austrian firms must provide at least one job to a disabled worker per 25 non-disabled workers. Non-complying firms pay a tax for each job-month missed. We study the role of this employment quota on firms’ demand for disabled workers. Specifically, we compare firms that employ 25 non-disabled workers and are subject to the non-compliance tax to firms that employ 24 non-disabled workers and are not subject to the tax. Our results indicate that firms with 25 non-disabled workers employ about 0.04 (or 12 percent) more disabled workers than would be expected from smaller firms, employment effects are stronger in low-wage firms than in in high-wage firms, and the quota generates excess disabled employment on the order of 0.07 among firms located at non-disabled firm size 50 and higher. Two reforms of the system also suggest that increasing the non-compliance tax increases excess disabled employment, whereas paying a bonus to over-complying firms slightly dampens the employment effects of the non-compliance tax. These results are only valid if we rule out strategic behavior in firms’ choice of non-disabled employment that is related to the tax. We show in a simple behavioral framework that firms may indeed manipulate non-disabled employment and that this manipulation can lead to either upward or downward biases. Based on empirical estimates for manipulation we provide a lower and upper bound for the causal effect of the quota on firms’ demand for disabled employment.
JEL classification: J15, J20, J71, J78
Keywords: disabled workers, employment quota, financial incentives
∗We would like to thank the editor, Stefano Della Vigna, and three anonymous referees for comments that helped substantially improve an earlier version of this paper circulated with the title ”Do Financial Incentives for Firms Promote Employment of Disabled Workers? A Regression Discontinuity Approach”. Josh Angrist, David Autor, Dan Hamermesh, Bo Honor´e, Andrea Ichino, Andreas Kuhn, Michael Lechner, Enrico Moretti, Oliver Ruf, Ian Walker, Rudolf Winter-Ebmer, Fabrizio Zilibotti, and seminar participants at the labor seminar in Engelberg (organized by the University of Zurich), at the University of Basel, at the University of St. Gallen, at the Royal Holloway University of London, at the University of Lausanne, at the University of Zurich, and at the EALE 2007 in Oslo provided helpful comments and suggestions on earlier versions of this paper. We thank Dr. Hofer, Ministry of Social Affairs, Vienna, and Dr. Konrad, Bundesrechenamt Vienna, for giving us access to the data. This paper was funded by the Austrian National Bank (“Jubil¨aumsfonds”, grant no. 12327). Financial support from the Swiss National Science Foundation (grant no. PBZHP1-133428) and the “Forschungskredit” of the University of Zurich is also gratefully acknowledged. Rafael Lalive, University of Lausanne, Department of Economics, CH–1015 Dorigny, [email protected]; Jean-Philippe Wuellrich, University of Zurich, Department of Economics, M¨uhlebachstrasse 86, CH–8008 Zurich, [email protected]; Josef Zweim¨uller, University of Zurich, Department of Economics, M¨uhlebachstrasse 86, CH–8008 Zurich, [email protected].
1
Introduction
Integrating disabled workers is a key challenge of employment policy. One out of seven individu-als who live in OECD countries report a health problem that limits activities of daily life (OECD, 2003). Employment matters tremendously for disabled individuals’ economic well-being. The work incomes of disabled individuals with a job are nearly as high as those of individuals with-out a disability. In contrast, the financial resources available to a disabled individual withwith-out a job are 46 % lower than the disposable income of an employed disabled individual. Even though work is of crucial importance for disabled individuals’ material standard of living, their employment rates are substantially below those of the non-disabled.
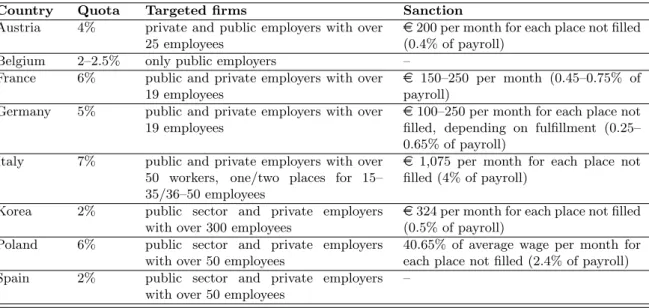
This paper studies whether an employment quota for firms can help to increase the demand for disabled workers. Understanding the effects of quota is important for several reasons. First, the two most important policies for encouraging employment of disabled workers among OECD member countries are anti-discrimination legislation and employment quotas. While the effects of anti-discrimination policies are quite well understood, the effects of employment quotas on firms’ employment decisions have been explored much less. Second, labor economists have long attempted to understand the importance of financial incentives in labor demand (Hamermesh, 1993). The employment quota policy allows studying firms’ reaction to a sharp change in the relative cost of employing disabled and non-disabled workers. Third, legislation very similar to that in Austria is in force in many other OECD countries (or has been so until very recently, as in the U.K.; see table 1 for an overview). While these regulations have a core component in the form of a mandatory employment quota in common, they differ in terms of the quota amount (ranging from 7% in Italy to 2% in Korea and Spain), in terms of the target firms, and in terms of the salience of non–compliance sanctions (ranging from 0.25% of the monthly pay-roll for firms in Germany to 4% in Italy).
We study the case of Austria, where the Disabled Persons Employment Act (DPEA) defines specific employment targets, coupled with financial incentives for meeting these targets. Austrian firms have to hire at least one disabled individual per 25 non-disabled employees leading to quota thresholds at firm size 25, 50, etc. Firms that fail to comply are subject to a tax of currently 223 e per month. The tax revenues are used to subsidize firms that provide employment to
disabled workers (regardless of whether they are subject to the employment quota or not). As similar quota rules are in place in many other OECD countries, it is important to investigate how the quota rule impacts employment.
In order to comprehensively capture the employment effects of the quota rule, it is crucial to understand how quota affect firms’ employment decisions of both disabled and non-disabled workers. Our empirical strategy exploits the discontinuous change in the relative cost of
employ-Table 1: OECD Countries with Employment Quotas
Country Quota Targeted firms Sanction
Austria 4% private and public employers with over 25 employees
e200 per month for each place not filled
(0.4% of payroll) Belgium 2–2.5% only public employers –
France 6% public and private employers with over 19 employees
e 150–250 per month (0.45–0.75% of payroll)
Germany 5% public and private employers with over 19 employees
e100–250 per month for each place not
filled, depending on fulfillment (0.25– 0.65% of payroll)
Italy 7% public and private employers with over 50 workers, one/two places for 15– 35/36–50 employees
e 1,075 per month for each place not
filled (4% of payroll) Korea 2% public sector and private employers
with over 300 employees
e324 per month for each place not filled (0.5% of payroll)
Poland 6% public sector and private employers with over 50 employees
40.65% of average wage per month for each place not filled (2.4% of payroll) Spain 2% public sector and private employers
with over 50 employees
–
Source: OECD (2003)
ing disabled and non-disabled workers and provides us with a “threshold design”. We compare (i) the number ofdisabledworkers in firms just below and just above the quota threshold; and (ii) the density of the firms size distribution – measured by non-disabled employment – just below and just above the threshold. The basic idea is that when firms’ demand for disabled workers is affected by these sharp changes in financial incentives at the quota thresholds, we should see a discontinuity in disabled employment at the threshold. In this respect our threshold design is closely related to the regression discontinuity design (RDD).1
However, the employment quota may also affect employment of non-disabled workers since firms may manipulate employment to avoid the non-compliance tax. This latter issue is key for the interpretation of our threshold discontinuity results for disabled workers.
We explicitly address the question how manipulating employment of non-disabled workers may bias the estimated quota effect on non-disabled employment (see McCrary, 2008). We develop a simple behavioral framework that shows that manipulation can lead either to an upward or a downward bias of the estimated threshold effect for disabled workers. The sign of the bias depends on whether or not the productivity of disabled workers exceeds their wage.
The model is helpful as it lets us estimate bounds for the estimated quota effect. We first check for employment manipulation. We show that, while the two populations of firms below and above thresholds are very similar in terms of a range of observable characteristics, there is, in fact, a significant (albeit small) discontinuity in the firm size distribution at the threshold. Based on our model we use the estimated of firm-size discontinuity effect to provide a lower and upper bound for the causal effect of the quota on firms’ demand for disabled employment. We
1
The RDD has been used in a number of studies to measure causal effects. See Angrist and Lavy (1999), DiNardo and Lee (2004), Imbens and Lemieux (2008), and Lalive (2008), for studies assessing the causal effects of unions, social assistance, or unemployment benefits on labor market outcomes.
conclude that, while manipulation bias cannot be ignored, even the lower bound of the quota effect remains positive.
The empirical analysis documents four important results. First, firms facing the obligation to employ disabled workers do in fact employ more disabled workers than similar firms without this obligation. A comparison of firms just above the quota threshold to those just below the threshold shows that roughly 4 in 100 firms around the first threshold (25 non-disabled workers) have a disabled worker on the payroll whom they would have not hired in the absence of employment quota. The average effect at higher order thresholds (50, 75, ...) is roughly twice as large but imprecisely estimated. Both estimates suggest that firms are quite responsive to the tax (the elasticity of substitution is around 1.60 for firms employing 25 non-disabled workers and around 1.58 for firms hiring 100 non-disabled workers). These results allow us to assess the extent to which firms incur losses from hiring a disabled worker. We find that about 35 % of all threshold firms incur no or only small losses from hiring disabled workers – with 31 % being indifferent between hiring an extra disabled worker or an extra non-disabled worker and 4 % incurring losses that are smaller than the non-compliance tax. The remaining 65 % of all firms do not comply with the regulation because the losses from doing so exceed the
tax. Second, we document important heterogeneity of the effects of employment quota with
respect to wages. We find that firms’ response to the per-head non-compliance tax decreases monotonically with a firm’s position in the wage distribution. Third, we explore the extent to which firms’ employment decisions merely reflect poaching from other firms rather than creating or maintaining employment. We find that roughly 64 % of the employment effect can be attributed to workers already employed by the firm on the date of acquiring formal disability status. About 34 % of excess employment can be attributed to workers who were employed by other firms at the time of acquiring disability status. The remaining 2 % of excess employment goes to individuals who were not employed at the time of acquiring disability status. Fourth, two reforms of the system suggest that increasing the non-compliance tax increases excess disabled employment, whereas paying a bonus to over-complying firms slightly dampens the employment effects of the non-compliance tax.
The existing literature has extensively studied the effects of anti-discrimination legislation for disabled individuals. DeLeire (2000), Acemoglu and Angrist (2001), and Beegle and Stock (2003) find that the Americans with Disabilities Act has not improved employment of disabled individuals in the U.S.. Kruse and Schur (2003) challenge this finding, pointing to imprecise information on disability status. Jolls and Prescott (2004) and Jolls (2004) argue that the Act increased education participation. Bell and Heitmueller (2009) find that the U.K. Disability Discrimination Act did not have a significant impact on employment prospects for disabled individuals. Wagner et al. (2001) find that employment quota did not generate a quota effect
for disabled workers nor an impact on job dynamics in Germany.2
Wuellrich (2010) finds that an increase in the non-compliance tax in Austria generated positive employment effects for disabled workers.3
This paper contributes to the literature in several ways. First, it adds to the literature by studying the impact of quota rules. While a large number of studies have looked at the effects of anti-discrimination legislation with respect to disabled workers, we are not aware of previous studies that evaluate the effect of quota on employment of disabled workers. Second,we provide a simple theoretical framework that is helpful in interpreting the estimated quota threshold effect in the presence of employment manipulation (”bunching”) by firms. Third, our evaluation is based on high-quality data from Austrian private firms and their (disabled and non-disabled) workers. We use the same data base that Austrian social welfare authorities use to determine compliance with employment quota: the Austrian Social Security Data (ASSD) linked with data from the Austrian Federal Welfare Office (FWO). The former data set contains the universe of Austrian firms and workers. The latter data set allows us to assess the formal disability status of each worker. The data cover all of 46,467 Austrian private sector firms with employment close to the quota threshold during 1996–2003(see Zweim¨ulleret al., 2009, for a description of the ASSD).
The paper is organized as follows. Section 2 provides a detailed description of the institutional environment in Austria. Section 3 presents the behavioral framework. Section 4 describes the data and the empirical strategy. Our main results are presented in section 5. Section 6 concludes.
2
Institutional Background
The Austrian Disabled Persons Employment Act (DPEA), implemented in 1970, forms the legal basis of the Austrian employment quota system. It defines the process by which individuals acquire the formal status “severely disabled”. It regulates the employment obligations for firms and the financial sanctions associated with non-compliance; specifies subsidies to firms employing disabled workers; and grants employment protection for disabled workers. Here we briefly discuss the legal background that was in effect during January 1999 to June 2001 and we also discuss two important reforms to this system that took place before and after this period.4
2
See also Lechner and Vazquez-Alvarez (2009) and Verick (2004) who study the effects of German anti-discrimination legislation. Moreover, two strands of the literature study (i) the role of employment protection for worker effort (Ichino and Riphahn, 2005), and (ii) the role of general employment protection provisions on firm dynamics and firm size (Bertrand and Kramarz, 2002; Borgarelloet al., 2004). See also Welch (1976) for an early theoretical attempt to characterize the effects of quota on the labor market.
3
See also Humer et al. (2007) for an overview of the Austrian system and a descriptive account of disabled workers’ career patterns.
4
The DPEA regulates employment of severely disabled workers. Another important program in Austria that targets disabled individuals is the disability insurance program (DI) which grants income transfers for disabled individuals who have dropped out of the labor force permanently (see e.g. Staubli, 2010, for an investigation of the impact of tightening the eligibility criteria for DI on labor force participation). Only 12 % of individuals who
Employment quota The quota rule obliges firms to hire one disabled worker per 25 non-disabled workers. Firms that do not comply with this obligation have to pay a non-compliance tax of currently e 223 (2010) and stood at 150 e in 1999, roughly 8 % of a worker’s average
monthly salary. Enforcement of non-compliance is close to 100 %. The FWO checks firms’ em-ployment obligation every month taking into account particular disabilities. (Blind individuals, disabled individuals below age 19, above age 50 with a degree of disability of at least 70 percent and above age 55 and individuals in a wheelchair are double-counted.) Disabled workers have to be hired on the same type of contracts offered to non-disabled workers. The non-compliance tax for disabled worker is the only labor market regulation that kicks in at a firm size of 25 non-disabled workers (and multiples thereof). This means that contrasting firms with 25 employees to firms with fewer than 25 workers really informs on the non-compliance tax rather than on other labor market regulations.5
Acquisition of disability status To acquire the formal status of a ”severely disabled”
in-dividual a worker has to file an application with the FWO. The application is approved once a medical expert assesses a physical, mental, intellectual, or sensory disorder which reduces the individual’s work capacity by at least 50 percent. This procedure aims to rule out that the for-mal status of a disabled individual can be obtained by fraud. While it cannot be ruled out that the procedure is only triggered after a firm has crossed the threshold, pure relabeling of existing workers is unlikely given the joint incentives of workers and firms. Workers gain in terms of increased job protection. Firms gain in getting access to refunds for workplace accommodation and wage subsidies (see below). In 2009, almost 95,000 individuals or 2.2 % of total employment were registered as disabled according to the law.
Workplace accommodation and (wage) subsidies The DPEA also defines how
non-compliance tax revenues are to be spent. In 2009, these revenues amounted to e 88.2 millions.
Beneficiaries are both the firms employing disabled workers and the disabled workers themselves. Firms employing disabled workers can get allowances for: (i) workplace accommodation (up to e 25,000 and at most 50% of total costs involved, only firms with 50 or less non-disabled
employees are eligible); (ii) wage subsidies (at most e 700 a month for new entrants and up
to two years; at most e 650 or 50 percent of the wage for long-term employees with a major
reduction in work capacity; at most e 400 a month for apprentices; at most e 1,000 or 50%
of the wage for employees when the firm can credibly show that it needs to layoff the worker
are eligible for DPEA also receive a DI pension. Yet even though few individuals are covered by both programs, the mere existence of DI might affect the employment effects of DPEA via its effect on reservation wages. Notice, however, that DI in Austria is predominantly an early retirement program. (See Staubli, 2010, for an analysis of DI incentives on employment of older workers.) DI take-up among younger individuals is comparably low.
5
There is a discontinuity in labor regulations at firm size of 15 employees. Firms above this employment threshold have to establish a works council.
without the subsidy); and (iii) work assistance (such as counseling the firm regarding the efficient integration of disabled workers, a service provided free of charge by the FWO). These allowances represent a reallocation of resources from firms that fail to comply with the quota rule to those firms that employ at least one disabled worker. The reallocation is used to compensate the latter for their effort in employing disabled workers. Allowances are available to all firms, including small firms not subject to the quota rule.6
Disabled workers are eligible to allowances for the following purposes: vocational (re)training, professional development, work assistance (counseling service), mobility enhancing measures (e.g. provision of a guide dog), and formation of a subsistence securing self-employment (up to
e 60,000).
Employment protection The DPEA provides increased employment protection for disabled
workers, i.e. protection from dismissal and protection from wage cuts due to disability. The increased protection against dismissal is twofold. First, it stipulates that a contract may only be terminated after a notice period of at least four weeks. Second, dismissal is only valid if a special FWO committee agrees to it. Dismissals without the consent of this committee are unlawful. However, the increased dismissal protection comes into effect only after a probationary period of three months has elapsed.
Policy Changes Two important reforms to the DPEA took place since the late 1990s. First,
on July 1, 2001 the non-compliance tax was increased frome150 toe196. Second, on January
1, 1999 a bonus for over-compliance was abolished. Before 1999, firms employing more disabled workers than required by the quota rule were granted a bonus of e150 for each excess disabled
worker. The 1999 reform and the 2001 reform also changed the probation period for disabled workers, from 1 to 3 months in the first reform and from 3 to 6 month in the second reform. Our empirical analysis (see section 5) will focus on the period January 1999 to June 2001. However, we will provide additional results also for the preceding and subsequent periods to check the robustness of our results.
3
A Simple Behavioral Framework
This section studies a simple model in which a quota threshold affects a firm’s decision to employ disabled and non-disabled workers. We want to shed light on the issue of bunching and look at firmsaround the threshold. Firms have to solve two discrete choice problems: (i) whether to
6
Dyket al.(2002) investigate take-up of allowances by firms. Almost 40% of firms employing disabled workers receive an allowance with wage subsidies being the most important allowance. 86% of firms with an allowance obtain a wage subsidy and about 6% obtain an allowance for providing adequate access to the premises and workplace accommodation. 60% of all firms assess the existence of allowances as essential for hiring disabled workers.
hire non-disabled workers below or at (or above) the threshold; and (ii) whether or not to hire a disabled worker.7
We assume that non-disabled workers have productivity P and disabled workers have productivity p < P. Anti-discrimination legislation ensures the same wage w for both types of workers.8
We assumeP > w for all firms but allow for w < p in some firms and
w > p in others (i.e. firms differ in p). The quota threshold is defined on a discrete number of employees, so it is reasonable to assume that labor is indivisible. However, product demand
Z iscontinuous (so firms either hire too few workers and ration Z; or they hire more effective
labor units than needed to produce Z).
No quota rule. We first look at employment decisions in the absence of a quota rule. A firm
that hires LN
non-disabled andLD
disabled workers makes profit
π0(LN , LD ) = min(P LN +pLD , Z)−w(LN +LD ).
Consider first optimal employment of non-disabled workers of the firm with product demandZ
(assuming firms do not hire disabled workers). Define “residual demand” as product demand
Z minus output produced by LN
non-disabled workers, so R(Z, LN
) =Z−LN
P. A firm with 0< R(Z, LN
)< P will hire at least LN
non-disabled workers and at mostLN
+ 1 non-disabled workers. Optimal non-disabled employment is characterized by a threshold rule: hire LN
+ 1 non-disabled workers if residual demand exceeds the wage rateR(Z, LN
)> w.
Now consider optimal hiring of a disabled worker. Whenp < wproductivity falls short of the wage rate and the firm is not willing to hire a disabled worker. However, when p > w some firms are willing to hire. When residual demand is in the range R(Z, LN
) ∈ (w, p) the firm is indifferent between hiring a disabled or a non-disabled worker. Both types of workers are sufficiently productive to satisfy residual demand R(Z, LN
). No disabled worker will be hired when residual demand is outside the rangeR(Z, LN
)∈(w, p). A firm with low residual demand, 0 < R(Z, LN
) < w would make a loss. A firm with high residual demand, p < R(Z, LN ) < P
would sacrifice profit since hiring a disabled worker generates less additional revenue than hiring a non-disabled worker.
Employment quota with non-compliance taxes. Now assume a system in which firms
with non-disabled employment LN
≥ T need to hire one disabled worker whereas firms with
LN
< T do not face such an obligation. Non-compliance with the quota rule leads to a tax
7
The discussion focuses on the first threshold, i.e whether to hire 25 workers (or more) or 24 workers (or less). However, the general logic generalizes to higher thresholds. For instance, at the second thresholds the firm has to decide whether or not to hire 50 workers or more or 49 workers or less and whether to hire 0,1, or 2 disabled workers, etc.
8
Note that the assumption of fixed wages does not preclude substitution between disabled and non-disabled workers since the non-compliance tax acts like an increase in the cost of non-disabled workers compared to disabled workers.
τ. Throughout we assume τ < w and τ < P −p.9
A firm that hires LN
non-disabled and
LD
∈ {0,1}disabled workers makes profit
π1(L N , LD) = min P LN+pLD, Z −w(LN+LD) + min LD−1(LN ≥T),0 ·τ where 1(LN
≥T) is an indicator taking value 1 if LN
≥T and zero otherwise.
How does the quota rule affect employment decisions? It turns out that the answer depends crucially on whether a disabled worker’s productivitypis larger or smaller that the wagew. We discuss the two cases in turn.
Case 1: p < w. Such a firm is not willing to hire a disabled worker even under a quota
system. However, the quota system will affect employment of non-disabled workers. Consider the decision of a firm whether to hire T or T −1 workers of firms with residual demand 0 < R(Z, T −1)< P. In the absence of quota this firm will hireT workers when R(Z, T −1)> w. With employment quota a firm with residual demand R(Z, T −1) ∈ {w, w+τ} employs only
T−1 non-disabled workers. This ”bunching” occurs because the marginal cost of theTth non-disabled workers equals the wagewplus the cost of crossing the quota thresholdτ; and because residual demand R(Z, T −1)∈ {w, w+τ} is lower than this marginal cost. The firm is better off setting employment at T −1 and avoid the tax. Notice also that the quota system affects only firms that would hire exactlyT workers (or multiples ofT) while the employment decisions of all other firms remain unaffected (though profits of firms with LN
≥T are lower because of the tax).
Case 2: p > w. When disabled workers’ productivity exceeds the wage, p > w, it depends
on residual demand whether or not the firm is willing to hire a disabled worker. Consider again the decision of a firm whether to hireT orT−1 non-disabled workers. Firms with low residual demand 0< R(Z, T −1)< ware not affected by the quota rule. Hiring an additional (disabled or non-disabled) worker does not generate the necessary revenue. Firms with residual demand in the rangew < R(Z, T−1)< p,strictly prefer to hire one disabled worker andT−1 non-disabled workers as hiring T non-disabled worker and no disabled worker would make them subject to the tax. (Without a quota system, firms in this range are indifferent whether theTth worker is disabled or non-disabled.) Firms with residual demand p < R(Z) < p+τ are also affected by the quota system. They hire one disabled andT−1 non-disabled workers (and would have hired no disabled and T non-disabled workers without a quota). Finally, firms with residual demand
p+τ < R(Z, T−1)< P always hireT non-disabled workers. While a quota system forces them
9
Both assumptions are well in line with the Austrian system where the tax is on the order of 8 % of monthly earnings. Moreover, productivity of a disabled worker is likely to be substantially lower than productivity of a non-disabled worker since disabled individuals have lost at least 50 % of work capacity.
to pay the tax a non-disabled workers generates higher profits.
Finally, let us look at the decision of firms whether to hireT orT + 1 workers.10
Firms with low residual demand 0< R(Z, T)< w−τ are unaffected by the quota and hire T non-disabled and no disabled worker. Firms with residual demand w−τ < R(Z, T)< w hireT non-disabled workers but are now incentivized to hire one disabled worker. As the quota rule applies, the marginal cost of hiring a disabled worker is w−τ, smaller than residual demand. (Notice that this incentive does not exist when choosing between T −1 and T). For residual demand
R(Z, T)> w the choice betweenT and T+ 1 is similar to the one between T−1 andT.
Figures 1a and 1b summarize how firms adjust employment of disabled and non-disabled workers in the presence of the quota rule. When p < w (see Figure 1a) firms do no hire a disabled worker despite the quota. Whenp > w(see Figure 1b) and residual demand is in range
E firms will not hire a disabled worker in the absence of a quota rule. In the presence of quota, however, they will hire one disabled worker, provided their optimal employment of non-disabled workers is at or above the threshold (LN
≥T). Similarly, firms with residual demand in range
G do not have an incentive to hire a disabled worker without a quota rule, but will hire one disabled worker with a quota – provided their optimal employment of non-disabled workers is just below the threshold or larger (LN
≥T −1). Finally, firms with residual demand in range
F and optimal non-disabled employment LN
≥ T −1 strictly prefer hiring a disabled worker under a quota system while they are indifferent between a disabled and a non-disabled worker in the absence of a quota system.
The figures also show which firms will manipulate employment of non-disabled workers in reaction to the quota rule. Manipulators – firms that locate below the threshold under a quota system but above in the absence of such a system – include firms with residual demand in ranges
B and G. Firms in rangeB set non-disabled employment below the threshold to avoid the tax and do not hire a disabled worker. Firms in range G also set non-disabled employment below the threshold but they are better off employing a disabled worker as this worker adds to profits. All other firms do not manipulate.
Consequences of employment manipulation. We have seen that the presence of a quota
rule induces some employers to choose a firm size just below the quota threshold. The key ques-tion is whether and to what extent such manipulaques-tion biases the contrast of mean employment of disabled workers between threshold firms and firms just below the threshold.
Consider firms hiring at the threshold with observed firm size LN
=T under a quota system
10
The same logic that applies the decision to employT orT+ 1 non-disabled workers, applies for the decision to employT+ 1 orT+ 2 non-disabled workers,T+ 2 or T+ 3 non-disabled workers, and so on. This is because all involved employment level are subject to the same quota rule. Notice further that the choice of firms to hire
T−1 versusT−2 non-disabled workers is identical to the in the absence of the quote system, see the discussion above.
Figure 1: Employment choices derived from the model
A
do not hire (τ≥ 0)
B
τ = 0: hire non−disabled
τ > 0: do not hire non−disabled
C
hire non−disabled (τ≥ 0)
Probability density function of R(Z,L
N) 0 p w w + τ P Residual demand R(Z,LN ) (a) Case 1: p < w D do not hire (τ≥ 0) E τ = 0: do not hire τ > 0: hire disabled F hire disabled (τ≥ 0) G τ = 0: hire non−disabled
τ > 0: substitute non−disabled by a disabled
H hire non−
disabled
(τ≥ 0)
Probability density function of R(Z,L
N)
0 w − τ w p p + τ P
Residual demand R(Z,LN)
(b) Case 2: p > w
in place. Among those firms are manipulators (with residual demand in ranges B and G) and non-manipulators (all other firms). It is important to note that manipulation due to a quota system leaves composition of firms at LN
=T with respect to employment of disabled workers essentially unchanged. While there are firms that would have optimally chosen T in the absence of a quota system, now chose T −1 as a result of the quota system, there are also firms that would have optimally chosenT+ 1 in the absence of quota system now chose T in the presence of the system. This means that the composition of threshold remains essentially unchanged. A substantial bias in the average number of disabled workers hired by threshold firms can be ruled out.
Now consider firms hiring just below the threshold with observed firm sizeLN
=T−1. These firms serve to identify the counterfactual disabled employment decisions without a quota rule. This set of firms also consists of manipulators and non-manipulators. The composition of firms just below the threshold changes as a result of the quota rule. Firms in range B and in range
quota. How does bunching affect average employment of disabled workers for firms observed at LN
=T −1? Notice that B-firms are not willing to hire disabled workers, whereas G-firms are actually hiring disabled workers. Hence two types of bunching create biases in opposite directions that tend to offset each other. A bias arises when the number of bunching firms is very large and when the percentage G-firms in all bunching firms (B- plus G-firms) deviates substantially from the average number of disabled workers below the threshold in the absence of quota. If the total number of bunching firms is small – or if theB/(B+D)-ratio is similar to the percentage of (T −1)-firms hiring disabled workers in the absence of a quota, the contrast of firms observed at the threshold to firms just below the threshold will not be strongly biased and will be informative on the impact of the quota rule on employment of disabled workers.
In our empirical analysis below we will estimate the fraction of bunching firms. Using this estimate, we will be able to bound the estimated threshold-effect for disabled workers assuming that bunching arises either entirely fromB-firms (which would lead to an upward bias) or entirely from G-firms (which would lead to a downward bias).
4
Empirical Strategy
The first part of this section provides the essential background regarding the data for the em-pirical analysis. The second part of this section discusses identification and estimation of the causal effect of the non-compliance tax on disabled employment.
4.1 Data
To assess the impact of the employment quota on firms’ hiring decisions with respect to dis-abled workers, we use register data from two different sources: (i) the Austrian Social security database (ASSD), which contains detailed information on the individuals’ employment history and characteristics from 1972–2003 on a daily basis together with an unambiguous firm iden-tifier, as well as firms’ industry affiliation and location (see Zweim¨uller et al., 2009) and (ii) personal data from the Austrian Federal Welfare Office (FWO) from 1970–2003, which reports disability status, disability type, and disability degree for all individuals who are disabled in the context of the DPEA. One advantage of this type of information is that a medical procedure (rather than self-reported by firms or workers) objectively assesses the disability status. The ASSD and FWO data can be linked on the basis of an anonymized person identifier. This allows us to calculate accurately (i) the number of the non-disabled workers and (ii) the number of disabled workers employed by each firm. The former variables determines whether a firm is subject to the quota rule and the latter variable shows whether the firm complies. The FWO checks firms’ compliance with the employment quota on the first day each month. We account
for this administrative modus operandi by creating a data set with monthly reference dates, all of which correspond to the first day of each month.11
Our main empirical analysis focuses on the period January 1999 to June 2001. The FWO data set includes all individuals who acquired the disability status in 1970 or later. This means that the stock of disabled workers might be incompletely captured in the early years but does not cause a major problem here as our analysis focuses on the above period. To check the robustness of our results we use also data for the periods July 1996 to December 1998 and July 2001 to December 2003 when slightly different rules were in place (see section 2). We further restrict the analysis to firms in the private sector – those who are likely to pursue a profit-maximizing objective. In particular, we look at firms operating in the services, manufacturing, construction, and tourism industries.
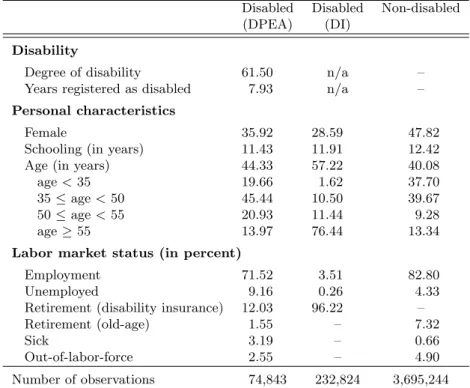
Table 2 characterizes disabled individuals in terms of the DPEA (column 1) and contrasts them to their disabled counterparts in terms of the disability insurance program (DI) (column 2) and to non-disabled individuals (column 3). The sample consists of the universe of working-age (working-age 20–65) individuals in Austria (August 2000). Table 2 reveals that the mean degree of disability (i.e. the reduction in work capacity) for DPEA-disabled amounts to 61.50 % and that the average duration of the disability is 7.93 years. DPEA-disabled are somewhat more female than the DI-disabled but have roughly the same years of schooling. DPEA-disabled are substantially younger than DI-disabled (44.33 vs 57.22 years). The main reason is that DI is mainly an early retirement program, whereas DPEA tries to integrate severely disabled into the labor market. Among those who work DPEA-disabled earn substantially more than DI-disabled (e66.89 vse 45.45) and are almost twice as likely white collar.12
4.2 Identification
Our empirical strategy is based on the discontinuously changes in financial incentives for firms to employ disabled workers. The DPEA requires firms to hire a disabled worker if employment of non-disabled workersLN
i is greater than or equal to the quota threshold T ∈ {25,50,75, ...}. Our aim is to identify the causal effect of the non-compliance quota tax on threshold firms’ disabled employment. In order to understand whether the quota rule has an impact, it is crucial to understand how firms’ employment decisions of both disabled and non-disabled workers are affected.
The quota rules provide us with a “threshold design”.13
Our threshold design contrasts
em-11
Firms cannot simply hire disabled workers for one day in order to fulfill the quota. In fact, disabled workers have, on average, a substantially higher tenure than non-disabled workers. Mean (std. dev.) tenure amounts to 10.3 (8.7) years for disabled and to 6.1 (6.9) years for non-disabled workers, the difference being statistically highly significant.
12
Public sector workers and the self-employed are excluded since we do not observe their wages nor the color of their collar.
13
Table 2: Characterization of disabled (DPEA), disabled (DI), and non-disabled workers
Disabled Disabled Non-disabled (DPEA) (DI)
Disability
Degree of disability 61.50 n/a – Years registered as disabled 7.93 n/a –
Personal characteristics
Female 35.92 28.59 47.82 Schooling (in years) 11.43 11.91 12.42 Age (in years) 44.33 57.22 40.08 age<35 19.66 1.62 37.70 35≤age<50 45.44 10.50 39.67 50≤age<55 20.93 11.44 9.28 age≥55 13.97 76.44 13.34
Labor market status (in percent)
Employment 71.52 3.51 82.80 Unemployed 9.16 0.26 4.33 Retirement (disability insurance) 12.03 96.22 – Retirement (old-age) 1.55 – 7.32
Sick 3.19 – 0.66
Out-of-labor-force 2.55 – 4.90 Number of observations 74,843 232,824 3,695,244
Job-related characteristics
(excluding public sector workers and self-employed)
Daily wage (in Euro) 66.89 42.45 65.45 White-collar 52.40 28.20 54.32 Number of observations 45,187 1,493 2,468,399 Notes: The sample consists of the universe of working-age (age 20–65) individuals in Austria (August 2000). Source: Own Calculations, based on ASSD
ployment of disabled workers just below and just above quota thresholds. The identification strategy builds on the key behavioral assumption that both disabled labor demand and supply are continuous in non-disabled employment at the threshold. Labor supply of disabled workers is clearly continuous in firm size because none of the DPEA provisions – except the quota rule – is conditional on firm size. Moreover, we assume that labor demand would be continuous in the absence of a quota rule. Since there are no rules – other than the disability quota – that kick in when firms change employment around thresholds, this is a reasonable assumption. However, the behavioral framework we develop in section 3 suggests that, in the presence of disability quota, firms may indeed manipulate employment of non-disabled workers and that manipulation can lead to either a downward or upward bias in the estimated threshold effect. Our empirical analysis will therefore report estimates of both the ”threshold effect” (effect of the quota rule on disabled employment) and the ”bunching effect” (effect of the quota rule on the density of non-disabled employment across firms). The bunching effect indicates the maximum number of firms that manipulate their non-disabled employment. Using this estimate, we will
be able to bound the threshold effect.
4.3 Estimation
The basic econometric model for the identification of the threshold effect at threshold T = 25 is as follows:
LDit =α0+α1·Dit+β0·L˜Nit +β1·Dit·L˜Nit +ǫit, where LD
it denotes the number of disabled workers,Dit = 1(L N
it ≥T) indicates whether a firm is treated or not, and ˜LN
it = L N
it −T ∈ [−12,12] denotes the difference between current non-disabled employment LN
it and threshold T = 25 of firm i at date t. Including ˜L N
it is important since non-disabled employment will turn out to be strongly correlated with disabled employment. The key parameter is α1. This parameter measures the average causal effect of DPEA on the number of disabled workers for firms at the quota threshold T. The parameterα0 measures the average number of disabled workers for firms just below the thresholdT and parametersβ0 and
β1capture the correlation between firm sizeL N
it and the average number of disabled workers per firm. We will also use a ‘long’ version of our basic model that includes a vector of covariates measuring (i) firm size dynamics, (ii) characteristics of firms’ workforce, (iii) firms’ industry affiliation, (iv) firms’ geographical location (at the state–level), and (v) time fixed effects (see table 3 for a detailed list of covariates). In addition, we interact (i)–(v) with ˜LN
it in order to allow for different effects of the forcing variable ˜LN
it for different types of firms. Inclusion of these covariates should not affect the estimated discontinuity, if manipulation of LN
it is small. The discrete support of the assignment variable ˜LN
it implies that we need to extrapolate in order to predict the counterfactual for threshold firms, i.e. we need to extrapolate the number of disabled workers threshold firms employ in the absence of the non-compliance tax.14
The above econometric model assumes a linear functional form which could be mis-specified. The empirical analysis below will follow Lee and Lemieux (2010) who suggests two approaches to assess sensitivity to functional form: adding higher order polynomials to the basic model and local linear regression (i.e. keep the linear functional form but reduce the bandwidth).
For the investigation of the higher thresholds T >25, we pool all higher order thresholds and extend the basic model with a set of threshold dummies Git that indicate the threshold that is closest to firmiat datetto control for differences in non-disabled employment across normalized thresholds (note that, for pooled quota thresholds T >25, ˜LN
it denotes the difference between
14
Discrete support of the assignment variable also affects the variance-covariance matrix estimates. Lee and Card (2008) suggest using cluster-consistent standard errors (clustered on the distinct values ofLN
it) to account for the uncertainty related to the choice of the functional form. Furthermore, remember that we use pooled cross-section data for the econometric analysis. Observations of the same firm cannot be considered to be independent from each other. Thus, we not only need to cluster on LN
it but also on firms (note that this is non-nested). Milleret al.(2009) propose a new variance estimator for OLS that provides cluster-robust inference when there is two-way clustering that is non-nested. As a consequence, we report two types of robust standard errors in our regression outputs: standard errors that are (i) clustered onLN
current non-disabled employment Sit and threshold Tit that is closest to firmiat date t.). 15
In addition, to allow for effect heterogeneity across thresholds, we include interactions between the threshold dummies Git and (i) the treatment indicator Dit, (ii) the normalized firm size ˜LNit, and (iii) the interaction between Dit and ˜LNit. Thus, the treatment effect α1 in this model can be interpreted as an inverse variance weighted average of the threshold specific treatment effects (see Angrist, 1998).
4.4 Manipulation Checks
In this subsection we consider whether the quota rule induces firms to manipulate employment of non-disabled workers. Following Lee and Lemieux (2010) we undertake two manipulation checks at the quota threshold: (i) inspection of the firm size density and (ii) inspection of baseline covariates. The intuition behind the former test is that manipulation should be reflected in a discontinuity in the firm size distribution at the threshold. Our behavioral framework predicts two types of manipulation both of which lead to ”bunching” below the threshold. Thus we expect a negative discontinuity in the firm size density at the threshold and report the ”bunching effect” along with the ”threshold effect” when presenting our main results in section 5.
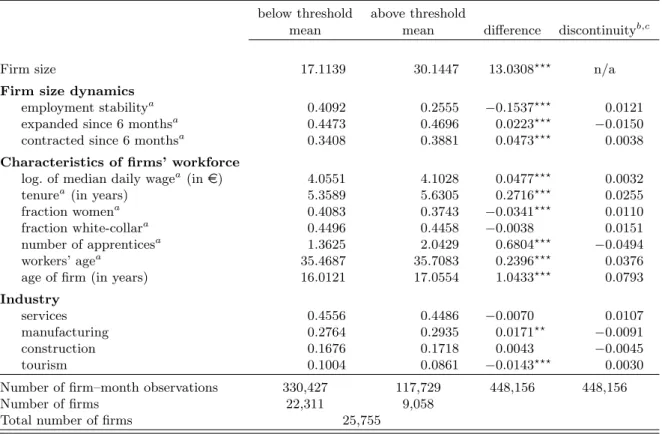
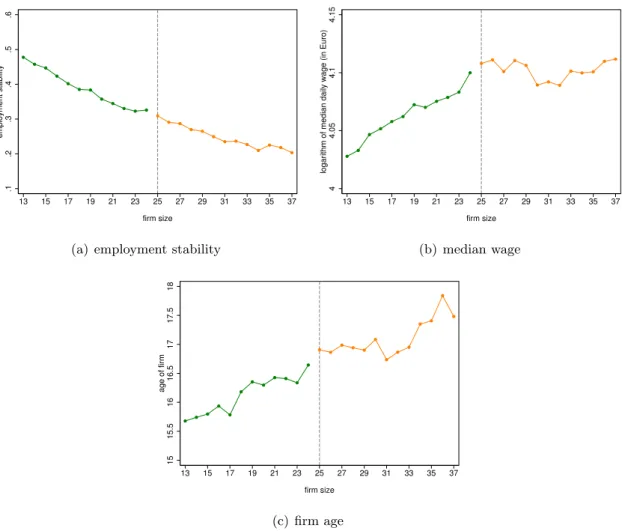
The intuition behind inspection of covariates is that manipulation should lead to local unbal-ancedness of baseline covariates around the threshold. Table 3 reports key background statistics on firms located around the threshold T = 25. The first line provides information on firm size – the number of jobs provided to non-disabled workers – for firms above (= treated firms) and below (= control firms) the threshold T = 25. Table 3 indicates that treated firms differ from control firms. Treated firms are, by construction, larger than control firms. Table 3 also displays information on firm size dynamics. The firm characteristic “employment stability” in-dicates whether the work force in month t was subject to any changes since month t−1. The characteristic “expanded (contracted) since 6 months” measures whether firm size in month tis strictly larger (smaller) than firm size in montht−6. It turns out that the workforce in treated firms is less stable than in control firms; both the fraction of firms that experienced employment growth and the fraction of firms that experienced a fall in employment are significantly larger among treated firms. Table 3 also reveals that there are slight differences in pay, tenure, and the percentage women, the number of employed apprentices, workers’ age and the age of the firm. There are only negligible differences in industry composition between treated and control firms. To shed more light on how treated and control firms differ, Figure 2 plots mean employment stability (a), mean wage (b), and mean firm age (c) as a function of firm size. Figure 2 clearly indicates that employment stability is a strongly decreasing monotone function of firm size.
Vi-15
Let Git =f loor((LNit + 12)/25) indicate a firm’s threshold group, i.e. Git = 1 for firms located around the
Table 3: Descriptive statistics around quota threshold T = 25 (time period: January 1999 -June 2001)
below threshold above threshold
mean mean difference discontinuityb,c Firm size 17.1139 30.1447 13.0308⋆⋆⋆ n/a
Firm size dynamics
employment stabilitya 0.4092 0.2555 −0.1537⋆⋆⋆ 0.0121 expanded since 6 monthsa 0.4473 0.4696 0.0223⋆⋆⋆ −0.0150 contracted since 6 monthsa 0.3408 0.3881 0.0473⋆⋆⋆ 0.0038
Characteristics of firms’ workforce
log. of median daily wagea(ine) 4.0551 4.1028 0.0477⋆⋆⋆ 0.0032 tenurea(in years) 5.3589 5.6305 0.2716⋆⋆⋆ 0.0255 fraction womena 0.4083 0.3743 −0.0341⋆⋆⋆ 0.0110 fraction white-collara 0.4496 0.4458 −0.0038 0.0151 number of apprenticesa 1.3625 2.0429 0.6804⋆⋆⋆ −0.0494 workers’ agea 35.4687 35.7083 0.2396⋆⋆⋆ 0.0376 age of firm (in years) 16.0121 17.0554 1.0433⋆⋆⋆ 0.0793
Industry
services 0.4556 0.4486 −0.0070 0.0107 manufacturing 0.2764 0.2935 0.0171⋆⋆ −0.0091 construction 0.1676 0.1718 0.0043 −0.0045 tourism 0.1004 0.0861 −0.0143⋆⋆⋆ 0.0030 Number of firm–month observations 330,427 117,729 448,156 448,156
Number of firms 22,311 9,058
Total number of firms 25,755
Notes: a denotes that variable bases on characteristics of non-disabled workers only. b The estimated discontinuity is based on the following model: xit =α0+α1·Dit+β0·L˜Nit+β1·Dit·L˜Nit+ǫit, where the coefficientα1detects discontinuities in the mean of characteristicsxit. cThe p-values for the estimated
discontinuities are adjusted for multiple testing according to Holm (1979). ⋆⋆⋆,⋆⋆,⋆denotes significance at the 1%, 5%, and 10% level respectively (standard errors are adjusted for clustering on firm size). Source: Own calculations, based on ASSD and FWO
sual inspection suggests that there is no discontinuity in employment stability at the threshold. Similar patterns are observed for wage and firm age. We formally test for discontinuities in baseline covariates implementing our basic econometric model for each of the background char-acteristics. Column (4) of Table 1 presents the estimate of parameter α1. Strikingly, results indicate that firms on either side of the T = 25 threshold are perfectly balanced with respect to observed covariates.
This means that all of the differences in baseline covariates shown in column (3) of table 3 are not due to purposeful self-selection of firms but rather due to underlying differences in firm size. Thus, the inspection of baseline covariates does not indicate any manipulation of the firm size suggesting that the key identifying assumption of our threshold design holds.
5
Econometric Results
In this section we discuss our main results. We start by analyzing the threshold and the bunch-ing effect at the first threshold (T = 25). We then check robustness on the basis of placebo
Figure 2: Selected controls (mean) vs firm size .1 .2 .3 .4 .5 .6 employment stability 13 15 17 19 21 23 25 27 29 31 33 35 37 firm size
(a) employment stability
4
4.05
4.1
4.15
logarithm of median daily wage (in Euro)
13 15 17 19 21 23 25 27 29 31 33 35 37 firm size (b) median wage 15 15.5 16 16.5 17 17.5 18 age of firm 13 15 17 19 21 23 25 27 29 31 33 35 37 firm size (c) firm age
Notes: Figure plots the mean of selected controls vs firm size. We selected three controls with means that vary strongly with firm size. The means of these selected controls but also of those we do not report are continuous in firm size at the threshold. The same result holds for pooled thresholds. Source: Own Calculations, based on ASSD and FWO
regressions; look for effect heterogeneity; look for the respective effects at higher thresholds (T = 50,75, ...); and provide robustness checks on the basis of earlier and later sample periods.
5.1 Results for Quota Threshold T = 25
This section presents the econometric estimates of the effects of quota rule for the first threshold
T = 25.16
Figure 3 reports the number of disabled workers per firm by firm size for sizes ranging from 13 to 37. The evidence is based on 448,156 firm-month observations, providing information on the employment decisions of 25,755 firms. The average number of disabled workers employed by firms increases with firm size. Firms that employ 13 non-disabled workers offer on average 0.14 workplaces to disabled workers whereas firms that employ 37 non-disabled workers provide
16
We put our main focus to this threshold for two reasons. First, firms at higher order thresholds are already subject to the quota system. Studying the first threshold allows analyzing the effects of being subject to or free of the quota system. Second, there are much fewer firms at higher order thresholds than at the first threshold. This means that the first threshold is the most relevant threshold in terms of the number of firms subject to the quota.
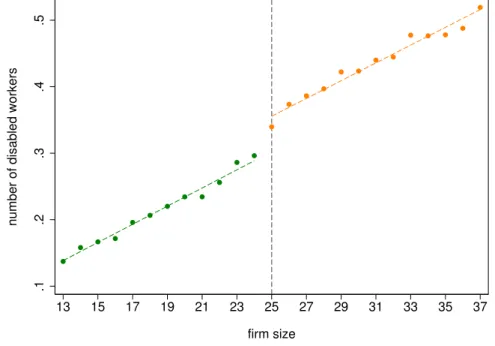
on average 0.50 jobs to disabled workers. Figure 3 also suggests an approximately linear rela-tionship. Strikingly, there is a jump in employment of disabled workers at the quota threshold. While firms with 24 non-disabled workers employ on average 0.31 disabled workers, firms with 25 non-disabled workers offer on average 0.34 jobs to disabled workers.
Figure 3: The effect of the DPEA on the number of disabled workers at quota threshold T = 25
.1
.2
.3
.4
.5
number of disabled workers
13 15 17 19 21 23 25 27 29 31 33 35 37
firm size
Notes: Discontinuity at threshold = 0.0533 with (i) standard error = 0.0075 (adjusted for cluster-ing on firm size) and (ii) standard error = 0.0133 (adjusted for clustercluster-ing on firm size and firm), based on the baseline model (number of observations = 448,156). Source: Own calculations, based on ASSD and FWO.
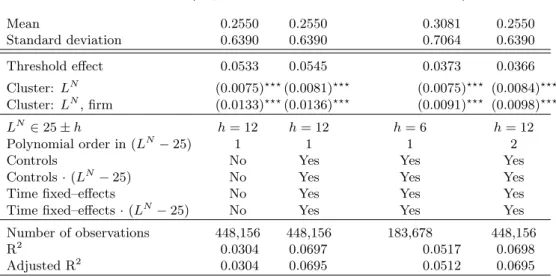
Table 4 presents the econometric results. Panel A shows our main results for the threshold effect, i.e. how employment quota affects jobs provided to disabled workers. Column (1) of table 4 shows results for the basic econometric model. The estimated discontinuity at the quota threshold T = 25 is 0.0533 (the standard error adjusted for clustering on firm size is 0.0075; the standard error adjusted for clustering on firm size and firm is 0.0133; see footnote 14 for the justification of the use of different standard errors). This discontinuity is statistically significant at the 1%-level. Note that the choice of clustering on the firm size, or on the firm sizeand firm, does not affect the statistical significance of our results in any of the four columns.
Column (2) of Panel A shows results for a model extended by the full set of controls, time fixed-effects, and their respective interaction with firm size. The threshold effect only slightly changes from 0.0533 to 0.0545. This is not surprising given the local balancedness of these covariates around threshold T = 25, which we assessed in section 4.4. Again, this is evidence against the presence of substantial manipulation of the firm size related to the employment quota. Column (3) narrows the bandwidth to ˜LN
amounting to 0.0373 with this smaller bandwidth. The inclusion of second order polynomials in ˜LN
it in column (4) to the specification in column (2) leads to the same effect as narrowing the bandwidth. The estimated discontinuity amounts to 0.0366 being almost identical to that of column (3). Thus, the basic model is sensitive to changes in functional form. The sensitivity analyzes in column (3) and (4) are, however, quite consistent regarding the causal effect of the non-compliance tax. We therefore adopt the model in column (3) as the baseline model for the remainder of the paper. Note that results are not sensitive to adopting the model in column (4). Table 4: The effect of the employment quota on the number of disabled workers per firm at quota threshold T = 25 (time period: January 1999 - June 2001)
Panel A: Threshold effect (dep. var.: number of disabled workers)
Mean 0.2550 0.2550 0.3081 0.2550 Standard deviation 0.6390 0.6390 0.7064 0.6390 Threshold effect 0.0533 0.0545 0.0373 0.0366 Cluster: LN (0.0075)⋆⋆⋆(0.0081)⋆⋆⋆ (0.0075)⋆⋆⋆ (0.0084)⋆⋆⋆ Cluster: LN, firm (0.0133)⋆⋆⋆(0.0136)⋆⋆⋆ (0.0091)⋆⋆⋆ (0.0098)⋆⋆⋆ LN∈25±h h= 12 h= 12 h= 6 h= 12 Polynomial order in (LN−25) 1 1 1 2
Controls No Yes Yes Yes
Controls·(LN−25) No Yes Yes Yes
Time fixed–effects No Yes Yes Yes
Time fixed–effects·(LN−25) No Yes Yes Yes Number of observations 448,156 448,156 183,678 448,156 R2
0.0304 0.0697 0.0517 0.0698 Adjusted R2
0.0304 0.0695 0.0512 0.0695
Panel B: Bunching effect (dep. var.: firm size density in percent)
Mean 4.0000 4.0000 7.6923 7.6923 Standard deviation 2.7926 2.7926 2.5369 2.5369 Bunching effect −0.4195⋆⋆ 0.1464 −0.4646⋆⋆⋆ −0.2178⋆⋆ (0.1577) (0.1264) (0.0644) (0.0820) LN∈25±h h= 12 h= 12 h= 6 h= 6 Polynomial order in (LN−25) 2 3 2 3 Number of observations 25 25 13 13 R2 0.9986 0.9997 0.9998 0.9999 Adjusted R2 0.9982 0.9995 0.9996 0.9998 Notes: ⋆⋆⋆,⋆⋆,⋆denotes significance at the 1%, 5%, and 10% level respectively. Robust standard errors in parentheses. Source: Own Calculations, based on ASSD and FWO
Is the threshold effect quantitatively large? A lower bound on the extent to which firms substitute disabled workers and non-disabled workers can be calculated as follows. The estimate of column (3) of the threshold effect suggests that the quota leads to 0.0373 more disabled workers holding a job in threshold firms – an increase of about 12 % of disabled workforce of 0.31 disabled workers in firms just below the quota threshold. This change in disabled worker employment is triggered by a compliance tax on the order of 8 % of the median non-disabled worker wage (e150 in fine per month relative to aboute 1,850 in wages per month).
The elasticity of substitution between disabled workers and non-disabled workers is therefore at least 1.60.17
As Acemoglu and Angrist (2001) conjecture, disabled and non-disabled workers are quite strong substitutes. Indeed, small changes in the price lead to large changes in demand suggesting that a quota policy would not be necessary if wages could be adjusted to account for differences in productivity. Yet anti-discrimination legislation does not permit firms to adjust wages for disability status.
We can use these result to interpret these results on the basis of our behavioral framework. Suppose we can disregard any bias induced by bunching. The fact that the average number of disabled workers hired even without the tax is 0.31 suggests that 31 % of all firms are indifferent between hiring a disabled worker and a non-disabled worker (firms populating area F). This is a sizable proportion of the overall population of firms which can employ disabled workers productively (i.e. their productivitypexceeds the wage ratew). Moreover, our findings indicate that roughly 4 out of 100 firms comply with the quota. This means that about 4 percent of all firms incur a loss from hiring a disabled worker that is no larger than the tax. Taken together, we find that about 35 % of all threshold firms incur small (or no) losses from hiring disabled workers. The remaining 65 % of all firms do not comply with the regulation presumably because the losses from doing so are substantial.
Let us now turn to the bunching effect. Figure 4 reveals no important discontinuity in the density of non-disabled employment around the quota thresholdT = 25. We test for the presence of a discontinuity in the firm size distribution formally (see McCrary, 2008). Panel B of table 4 shows the bunching effect in more detail and investigates its sensitivity with respect to the functional form in LN
and to the bandwidth h. Column (2) of Panel B uses polynomial order 3 and a bandwidth h = 12. This specification repeats the result already displayed in Figure 4. Column (1) reduces the polynomial order of 3 to 2 in LN
and detects a significant bunching effect of -0.42. Columns (3) and (4) reduce the bandwidth to h = 6. Again, a significant bunching effect is detected, amounting to -0.46 with a polynomial order inLN
of 2 and to -0.22 with a polynomial order in LN
of 3. Hence columns (1), (3) and (4) of Panel B of Table 4 suggest that firms indeed manipulate their non-disabled employment due to the tax, though this evidence is not completely robust to changes in the specification (see column (2)). We take column (3) as our benchmark specification. This is the largest statistically significant and thus most conservative estimate of the bunching effect.
17
Recall that the elasticity of substitution is the negative of the percentage change disabled to non-disabled employment caused by a percentage change in the relative disabled to non-disabled wage. Consider the first threshold. Disabled to non-disabled employment increases by 0.15 % (effect of 0.0373 divided by threshold firm size of 25) because the tax reduced the relative wage of a disabled worker by about 7.5 percent (regular monthly earnings aree 1,850; this means that the tax decreases disabled to non-disabled relative earnings from 1,850 / 1,850 to 1,850 / 2,000). The relative disabled and non-disabled wage is 1 whereas the disabled to non-disabled employment level stands at 0.31/25. Thus the elasticity of substitution of threshold firms stands at about 1.60 (=−(0.0373/25)/(1850/2000−1)·1/(0.31/25)).
Figure 4: Firm size distribution at quota threshold T = 25 2 4 6 8 10 12 density (in %) 13 15 17 19 21 23 25 27 29 31 33 35 37 firm size
Notes: Estimated discontinuity = 0.1464 with standard error = 0.1264 (adjusted for clustering on firm size), based our basic model with a cubic trend in ˜LN using the density of the firm size distribution (in %) as outcome variable (number of observations = 25). Source: Own calculations, based on ASSD and FWO.
What does the bunching effect of -0.46 imply for our estimated threshold effect? Clearly, the key identifying assumption of our threshold design does not hold in light of this strategic behavior of firms. The above behavioral framework suggests that employment manipulation may lead either to an upward or a downward bias of the threshold effect. Using the estimated bunching effect in Column (3) of Panel A of Table 4, we are able to provide bounds, assuming that bunching arises either entirely fromB-firms (p < w) or entirely fromG-firms (p > w). Note first that the bunching effect is informative on the absolute number of manipulators. It suggests that 0.46 percent of the 183,678 firms in the firm size bracket 19–31 manipulate employment. In other words, there are 427 (= (0.0046·183,678)/2) employment manipulators.18
To get anupper bound of the threshold effect assume that in all firms disabled workers have a productivity larger than their wage (p > w). In that case, manipulation of non-disabled employment arises because firms substitute a non-disabled worker with a disabled worker. This kind of manipulation leads to an upward bias in the mean number of disabled workers just below the threshold and thus to a downward bias in the estimated threshold effect. Moving all 427 potential manipulators just above the threshold thereby retaining their substituted disabled worker and recalculating the difference in mean disabled employment yields a threshold effect of 0.0861. The raw difference
18
Imagine that there are 50 firms on each side of the threshold. Assume now that five firms manipulate their firm size and thus sort below the threshold. There are now 55 firms to the left and 45 firms to the right of the threshold. The resulting discontinuity in the number of firms amounts to 10 firms - twice the number of manipulating firms. This is the reasoning for the division by two.
in the mean number of disabled workers between firms with non-disabled employment T = 24 and T = 25 is 0.0434, so the bias in the threshold effect amounts to 0.0434−0.0861 =−0.0427. To get a lower bound of the threshold effect we assume that manipulation arises only because the wage of all disabled workers exceeds their productivity (p < w). In that case bunching arises from firms that sort below the threshold to avoid the non-compliance tax. Reassigning all 427 potential manipulators from T = 24 to T = 25 (manipulators would still hire zero disabled workers) we recalculate the difference in mean disabled employment and obtain a value of 0.0235. Consequently, the bias in the threshold effect amounts to 0.0434−0.0235 = 0.0199.
In sum, our estimated threshold effect is potentially confounded by firm bunching, but the resulting bias is rather small. Our preferred estimate in Column (3) of Panel A of Table 3 amounts to 0.0373. Using our bounding exercise the upward bias is at most 0.0199 and the downward bias is at most 0.0427. Hence our simple thought experiment suggests that the threshold effect is bounded by [0.0138,0.0800]. We conclude that, taking into employment manipulation, still leads to a positive threshold effect. In other words, our estimates suggest that quota rules induce firms to increase employment of disabled workers. Evaluated at average disabled employed of firms just below the threshold 0.31 this increase is between 4.5 % (= 0.0138/0.31) and 25.8 % (= 0.08/0.31). While employment manipulation biases the threshold effect, even our most conservative estimate suggests a positive impact of quota on disabled employment.
5.2 Placebo Regressions
To further assess the validity of the threshold design, we estimate discontinuities in the number of disabled workers per firm at firm sizes where there should be no discontinuities. Figure 5 shows the estimated discontinuities (according to our baseline model) for firm sizes 7–35 (including the true threshold at firm size 25). The pattern is striking. There is a clear-cut peak at the true threshold, which already begins to grow at around firm size 21 and then flattens out beginning at firm size 26. Note that this is not surprising – given that there is a true discontinuity at firm size 25. The bandwidth of our baseline model is 6, thus the discontinuities calculated at ‘placebo’-thresholds 19–24 already consider treated firms.
The estimated discontinuities for the placebo thresholds at firm sizes 7–18 and 31–35, for which either only treated or only control firm are considered, are in all but five instances (at firm sizes 9, 10, 13, 14, and 34) statistically not different from zero at the 5%-level. Note, however, that we test a large number of coefficients at once. Therefore we need to adjust the p-values for the issue of multiple testing. It turns out that once we adjust the p-values for multiple testing according to Holm (1979), only the estimated discontinuity of the true threshold at firm size 25