Introduction to Soil Salinity
Robert Flynn, Associate Professor, Extension Agronomy and Soils
A saline soil is defined as a soil that hasenough soluble salts to impair plant productivity. There are many kinds of salts. Salts are not limited to table salt (sodium chloride). Salts found in the soil could be anything but sodium chloride. Soil salts include calcium, magnesium, potas-sium, bicarbonate, carbonate, chloride, sulfate, nitrate, and sodium. Many of these salts are plant nutrients. Too much of a good thing can become a problem. A soil with a white crust may not be affected by sodium but may be considered saline.
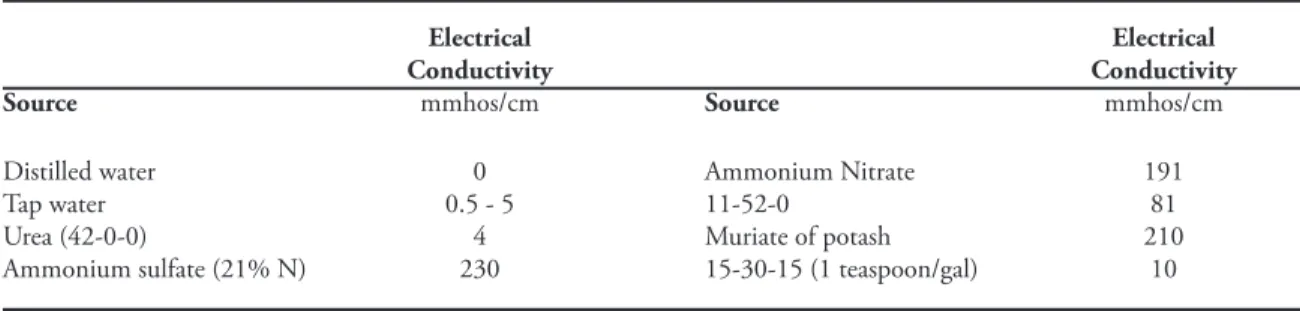
Soil Electrical Conductivity Electricity is used to measure salt content in a soil. Pure water does not conduct electricity. But if the tiniest bit of salt is present, electricity is conducted through the solution. A conductivity meter is used to measure how well electricity is conducted in a solution of water. This is referred to as EC, which is short for electrical conductivity. Units of measure are either mmhos per cm or decisiemens per meter. These are electrical units that describe how well electricity moves through solution. Electrical units of resistance are given in ohms. The opposite of resistance is con-ductance and is ohms spelled backwards. A reading of zero implies no conductance of electricity. The readings do not tell us what kind of salts are present in the soil but do give us an idea of how salty the soil is. Fertilizers are salts and when dissolved in water they conduct electricity. All salts do not affect electrical conductivity in the same way (table 1).
The Saturated Paste
The standard practice for determining how salty soils are is to make a saturated paste of the soil with water, and then extract the water from the soil paste after 24 hours. Some labs will use one part water to one part soil by volume to test for soil salts. This approach is accomplished in less time than the saturated paste method. However, the saturated paste method is best for evaluating crop response to soil salinity. Other methods are suitable for relative comparisons. The main reason why the saturated paste works so well has to do with the solubility in the soil. Too much water could increase the amount of salt that goes into solution or cause other salts to combine with elements that would make them a solid. The saturated paste is a compromise between having enough liquid to extract for analysis and yet reflect the soil conditions that a plant would experience after an irrigation.
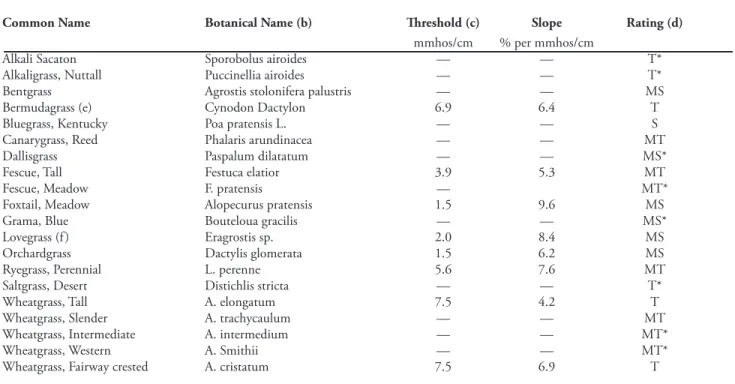
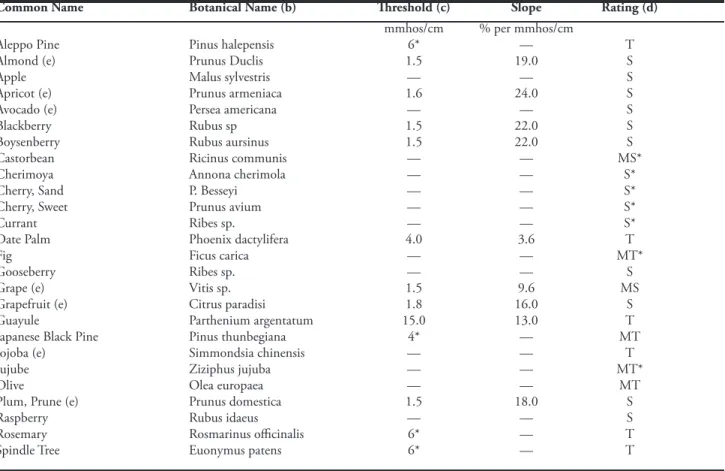
Keep in mind that conductivity numbers do not mean anything until they are “interpreted” or correlated to plant response. In general, a soil is saline if the conduc-tivity of the saturated paste extract is greater than 4 mmhos per cm. Saline soils do not necessarily mean there is the presence of sodium. Excess sodium causes its own set of problems and warrants special attention. Grasses (table 2), woody species (table 3), and vegeta-bles (table 4) vary in their response to salinity. To read the tables, find the plant of interest and move to the right. The third column of numbers tells us at what point the crop is first affected by soil salts. The higher the number the more tolerant the plant is of
Table 1. Salinity of common fertilizers using 1 tablespoon per quart of distilled water unless noted otherwise.
Electrical Electrical
Conductivity Conductivity
Source mmhos/cm Source mmhos/cm
Distilled water 0 Ammonium Nitrate 191
Tap water 0.5 - 5 11-52-0 81
Urea (42-0-0) 4 Muriate of potash 210
I.E.2
soil salts. The next column is the slope and means how much damage or reduced growth can occur for every unit increase in salinity. A slope of 6.2 (Orchardgrass), for example, implies that for a change in salinity from 1.5 to 2.5 mmhos/cm there will be a 6.2 percent drop in performance.
Managing Saline Soil
Managing saline soils includes leaching, selecting salt tolerant crops, and other practices developed from interpreting the soil test. Chemical amend-ments are not usually needed for strictly saline soils. Amendments become necessary if sodium is excessively high in a soil test.
Specific Ion Effects—Sodium Calcium, magnesium, and sodium also are deter-mined from the saturated soil paste extract. The ratio of sodium to calcium and magnesium de-termines how likely a soil will be affected by the sodium ion. Two properties of soil are calculated from these three ions and are reported as the Sodi-um Adsorption Ratio (SAR) and the Exchangeable Sodium Percentage (ESP). The SAR tells sodium’s relative activity in exchange reactions in the soil, while ESP is the degree of saturation of the soil exchange complex with sodium. Sandy soils are less prone to the effects of sodium than clay soils. By definition, a soil is affected by sodium if the ESP is greater than 15 percent. A soil does not have to be saline in order to be considered sodium affected. The electrical conductivity of a soil affected by sodium is, by definition, less than 4.0 mmhos per cm. Sodium affected soils usually have a pH greater than 8.5. These soils have poor structure, because the sodium disperses the soil particles and reduces the large pore space. This makes leaching very difficult, since the soil becomes like concrete keeping water on the surface. The amendment most commonly used is gypsum and application rates are based on the sodium concentra-tion and the soil’s ESP (table 5).
Soils that are affected by both saline and sodium are the hardest to manage. By definition, these soils have an EC above 4.0 mmhos/cm and an ESP greater than 15 percent. Sometimes this type of soil contains gyp-sum, which can be dissolved with irrigation water to help reclaim the soil by providing more calcium to the soil exchange sites. Otherwise, amendments
contain-ing calcium are required to displace the sodium. The soil must be irrigated after application of calcium to remove the sodium that has been displaced by the cal-cium. Water is applied to leach the sodium to below the root zone of the plant. Water must be free to move to below the root zone, otherwise, the sodium will eventually work its way back up to the soil surface. Sampling Soil for Determining Salinity Finally, in order to be confident of the lab results the soil sample must be representative of the area in question. Grid sampling can help identify areas that are more salty than others. Seed germination is the time when plants are most sensitive to soil salts. A soil sample should reflect the conditions around the seed, so sample no deeper than 2 inches for analysis. Sample should be taken 6 to 8 weeks prior to plant-ing. If samples come back high in dissolved salts, then irrigation water needs to be applied to move the salts away from the seed. For furrow irrigation, this usually means alternate row irrigation and keeping the seed away from the row crest and nearer to the furrow.
Table 2. Relative salt tolerance of some grass species (a).
Common Name Botanical Name (b) Threshold (c) Slope Rating (d) mmhos/cm % per mmhos/cm
Alkali Sacaton Sporobolus airoides — — T*
Alkaligrass, Nuttall Puccinellia airoides — — T*
Bentgrass Agrostis stolonifera palustris — — MS
Bermudagrass (e) Cynodon Dactylon 6.9 6.4 T
Bluegrass, Kentucky Poa pratensis L. — — S
Canarygrass, Reed Phalaris arundinacea — — MT
Dallisgrass Paspalum dilatatum — — MS*
Fescue, Tall Festuca elatior 3.9 5.3 MT
Fescue, Meadow F. pratensis — MT*
Foxtail, Meadow Alopecurus pratensis 1.5 9.6 MS
Grama, Blue Bouteloua gracilis — — MS*
Lovegrass (f) Eragrostis sp. 2.0 8.4 MS
Orchardgrass Dactylis glomerata 1.5 6.2 MS
Ryegrass, Perennial L. perenne 5.6 7.6 MT
Saltgrass, Desert Distichlis stricta — — T*
Wheatgrass, Tall A. elongatum 7.5 4.2 T
Wheatgrass, Slender A. trachycaulum — — MT
Wheatgrass, Intermediate A. intermedium — — MT*
Wheatgrass, Western A. Smithii — — MT*
Wheatgrass, Fairway crested A. cristatum 7.5 6.9 T
NOTES: T=tolerant; S=sensitive; M=moderately.
(a) These data serve only as a guide to relative tolerances among crops. Absolute tolerances vary, depending on climate, soil conditions, and cultural practices.
(b) Botanical and common names follow the convention of Hortus Third (Liberty Hyde Bailey Hortorium Staff, 1976) where possible. (c) In gypsiferous soils (soil with a lot of gypsum), plants will tolerate soil ECe about 2 mmhos/cm higher than indicated.
(d) Ratings with an * are estimates.
(e) Average of several varieties. Suwannee and Coastal varieties are about 20 percent more tolerant, and common, and Greenfield are about 20 percent less tolerant than the average.
I.E.4
Table 3. Relative tolerance of woody species to soil salinity (a).
Common Name Botanical Name (b) Threshold (c) Slope Rating (d) mmhos/cm % per mmhos/cm
Aleppo Pine Pinus halepensis 6* — T
Almond (e) Prunus Duclis 1.5 19.0 S
Apple Malus sylvestris — — S
Apricot (e) Prunus armeniaca 1.6 24.0 S
Avocado (e) Persea americana — — S
Blackberry Rubus sp 1.5 22.0 S
Boysenberry Rubus aursinus 1.5 22.0 S
Castorbean Ricinus communis — — MS*
Cherimoya Annona cherimola — — S*
Cherry, Sand P. Besseyi — — S*
Cherry, Sweet Prunus avium — — S*
Currant Ribes sp. — — S*
Date Palm Phoenix dactylifera 4.0 3.6 T
Fig Ficus carica — — MT*
Gooseberry Ribes sp. — — S
Grape (e) Vitis sp. 1.5 9.6 MS
Grapefruit (e) Citrus paradisi 1.8 16.0 S
Guayule Parthenium argentatum 15.0 13.0 T
Japanese Black Pine Pinus thunbegiana 4* — MT
Jojoba (e) Simmondsia chinensis — — T
Jujube Ziziphus jujuba — — MT*
Olive Olea europaea — — MT
Plum, Prune (e) Prunus domestica 1.5 18.0 S
Raspberry Rubus idaeus — — S
Rosemary Rosmarinus officinalis 6* — T
Spindle Tree Euonymus patens 6* — T
NOTES: T=tolerant; S=sensitive; M=moderately.
(a) These data are applicable when rootstocks are used that do not accumulate Na+ or Cl- rapidly or when these ions do not predominate
in the soil.
(b) Botanical and common names follow the convention of Hortus Third (Liberty Hyde Bailey Hortorium Staff, 1976) where possible. (c) In gypsiferous soils, plants will tolerate ECe about 2 mmhos/cm higher than indicated.
(d) Ratings with an * are estimates.
(e) Tolerance is based on growth rather than yield.
Common Name Botanical Name (b) Threshold (c) Slope Rating (d) mmhos/cm % / mmhos/cm
Artichoke Cynara scolymus — — MT*
Asparagus Asparagus officinalis 4.1 2.0 T
Bean Phaseolus vulgaris 1.0 19.0 S
Bean, Mung Vigna radiata 1.8 20.7 S
Beet, Red Beta Vulgaris 4.0 9.0 MT
Broccoli Brassica oleracea botrytis 2.8 9.2 MS
Brussel Sprouts B. oleracea gemmifera — — MS*
Cabbage B. oleracea capitata 1.8 9.7 MS
Carrot Daucus carota 1.0 14.0 S
Cauliflower Brassica oleracea botrytis — — MS*
Celery Apium graveolens 1.8 6.2 MS
Corn, Sweet Zea mays 1.7 12.0 MS
Cucumber Cucumis sativus 2.5 13.0 MS
Eggplant Solanum Melongena esculentum 1.1 6.9 MS
Kale Brassica oleracea acephala — — MS*
Kohlrabi B. oleracea gongylode — — MS*
Lettuce Lactuca sativa 1.3 13.0 MS
Muskmelon Cucumis melo — — MS
Okra Abelmoschus esculentus — — S
Onion Allium cepa 1.2 16.0 S
Parsnip Pastinaca sativa — — S*
Pea Pisum sativum — — S
Pepper Capsicum annuum 1.5 14.0 MS
Potato Solanum tuberosum 1.7 12.0 MS
Pumpkin Cucurbita Pepo — — MS*
Radish Raphanus sativus 1.2 13.0 MS
Spinach Spinacia oleracea 2.0 7.6 MS
Squash, Scallop Cucurbita Pepo Melopepo 3.2 16.0 MS
Squash, Zucchini C. Pepo Melopepo 4.7 9.4 MT
Strawberry Fragaria sp. 1.0 33 S
Sweet Potato Ipomoea Batatas 1.5 11 MS
Tomato Lycopersicon Lycopersicum 2.5 9.9 MS
Tomato, Cherry L. esculentum var cerasiforme 1.7 9.1 MS
Turnip Brassica Rapa 0.9 9.0 MS
Watermelon Citrullus lanatus — — MS*
Notes: S= sensitive, T=tolerant, M=moderately.
(a) These data serve only as a guideline to relative tolerances among crops. Absolute tolerances vary, depending upon climate, soil conditions, and cultural practices.
(b) Botanical and common names follow the convention of Hortus Third (Liberty Hyde Bailey Hortorium Staff, 1976) where possible. (c) In gypsiferous soils, plants will tolerate ECe about 2 mmhos/cm higher than indicated.
(d) Ratings with an * are estimates.
Table 5. Pounds of pure gypsum to apply per 1,000 square feet needed to reduce the ESP by 5 percent in the top foot of soil.
I.E.6
Exchangeable Sodium Percentage (ESP)
Sodium 6 7 8 10 12 15 20 ppm 300 20 33 44 59 69 78 88 400 26 45 59 78 91 104 117 500 32 56 73 98 114 130 147 600 39 67 88 117 137 156 176 800 52 90 117 156 183 208 234 1,000 65 105 147 195 227 261 293 1,500 98 168 219 293 342 390 440 2,000 130 223 293 390 456 521 585
The above information assumes the soil sample is taken from the top 12-inch layer that weighs 3.6 million pounds per acre-foot. The units from the soil test are in parts per million (mg/kg) for the sodium and exchangeable sodium percentage (ESP). The gypsum is 100 percent pure, the efficiency of the reaction is assumed to 80 percent, and the ESP is to be reduced by 5 percent.
I.E.8