M E T H O D O L O G Y
Open Access
CellProfiler: Novel Automated Image
Segmentation Procedure for Super-Resolution
Microscopy
Kareem Soliman
Abstract
Background:Super resolution (SR) microscopy enabled cell biologists to visualize subcellular details up to 20 nm in resolution. This breakthrough in spatial resolution made image analysis a challenging procedure. Direct and automated segmentation of SR images remains largely unsolved, especially when it comes to providing meaningful biological interpretations.
Results:Here, we introduce a novel automated imaging analysis routine, based on Gaussian, followed by a segmentation procedure using CellProfiler software (www.cellprofiler.org). We tested this method and succeeded to segment individual nuclear pore complexes stained with gp210 and pan-FG proteins and captured by two-color STED microscopy. Test results confirmed accuracy and robustness of the method even in noisy STED images of gp210.
Conclusions:Our pipeline and novel segmentation procedure may benefit end-users of SR microscopy to analyze their images and extract biologically significant quantitative data about them in user-friendly and fully-automated settings.
Background
Super resolution (SR) microscopy unlocked new oppor-tunities for cell biologists to investigate cells and cellular functions at unprecedented resolution up to few nano-meters, which require re-thinking of biologists about new and previous discoveries [1]. SR microscopy visualiz-ing svisualiz-ingle molecules clusters at nanometer resolution has made image analysis a more complicated practice. Current image analysis of SR microscopy data rely mostly on com-plex analytical tools and MatLab (www.mathworks.com) based routines. Automated grouping of molecule clusters into biologically meaningful objects by direct segmenta-tion remains largely difficult; however, density algorithms optimized for Single Molecule Localization Microscopy (SMLM) was the first automated attempt to segment and interpolate object boundaries directly from SMLM images by using local adaptive density kernels to merge and sep-arate molecules clusters into meaningful objects [2].
Image segmentation algorithms that use shape or in-tensity data will identify single super resolved clusters,
but will not perceive a group of separate clusters as one functionally active domain. Automated algorithms that rely on adaptive densities information to segment and interpolate boundaries have been only shown to work well with SMLM on reference structures with continu-ous densities e.g., mitochondria, microtubule [2], how-ever; computational performance and accuracy on structures with intermittent densities and profiles re-mains lacking e.g., nuclear pores complex. For such problems, most biological studies involving SR micros-copy techniques rely on manually defining regions of in-terests (ROIs) with geometry that best fits structures investigated e.g., ellipse, circular, square or rectangular [3–5]. This type of manual work is a very tedious job, but most reliable alternative so far.
SR microscopy techniques provide a much narrower Gaussian point spread function (PSF) of the focused scanning area, enabling us to resolve features that are distant below diffraction limit of light, which is approx. about 200–300 nm in (xy) and up to 500–700 nm in (z) axis [6]. Smoothing is applied to images to average sig-nals using a smoothing function. Interestingly, applying a Gaussian could enlarge PSF of SR images and drive resolution backward toward diffraction limit of light in a Correspondence:[email protected]
Department of Pediatrics and Adolescent Medicine, University Medical Center, University of Göttingen, Robert-Koch Str.40 1.D3.644 Histology Lab, Göttingen 37075, Germany
controlled fashion by mathematical means e.g., increas-ing width of Gaussian. An intuitive way to segment SR images into meaningful groups of molecules would be through Gaussian smoothing to merge proximate signals within the artifact radius of the Gaussian. Therefore, structures and groups of molecules clusters can be merged when distance separating them is below Gauss-ian width of the applied filter. Once this cluster grouping is achieved, segmentation remains to be done. Merged super resolved structures might show intensity variation throughout the whole object, because each of the merged clusters has different intensity profile. For that, it is logical to use algorithms that use shape informa-tion to segment clumped objects, avoiding by that over-segmentation problems [7].
Once groups of clusters in an image are perceived as biologically significant objects by means of Gaussian blur-ring, it should remain possible to segment the actual SR image to find out single molecule cluster information in the image. Associating objects found in the SR image and its Gaussian blur, would allow us to find out meaningful data about each group of molecules. Interestingly, auto-mated imaging free ware software tools, like CellProfiler (www.cellprofiler.org), possess all previously described al-gorithms and analysis paradigms [8], which should make it possible to implement Gaussian blur filters and combine image segmentation procedures to extract meaningful data about clusters of molecules directly from SR images in a fully automated way.
In this paper, we introduce and test a novel image ana-lysis procedure for SR microscopy, which depends on Gaussian blurring to merge super-resolved structural de-tails in SR images into biologically meaningful objects. Followed by a segmentation process, it was then possible to interpolate objects boundaries in blurred images. Re-lating objects from both SR images and their blurred versions allowed direct reading and quantification of cluster information per groups of molecules. We used simulation data and CellProfiler to explain how the ana-lysis works and we applied our approach to study struc-tures of nuclear pore complex, to show our approach running on real data.
Results
Basic Simulation of SMLM Image and Automated Cluster Analysis by Cellprofiler
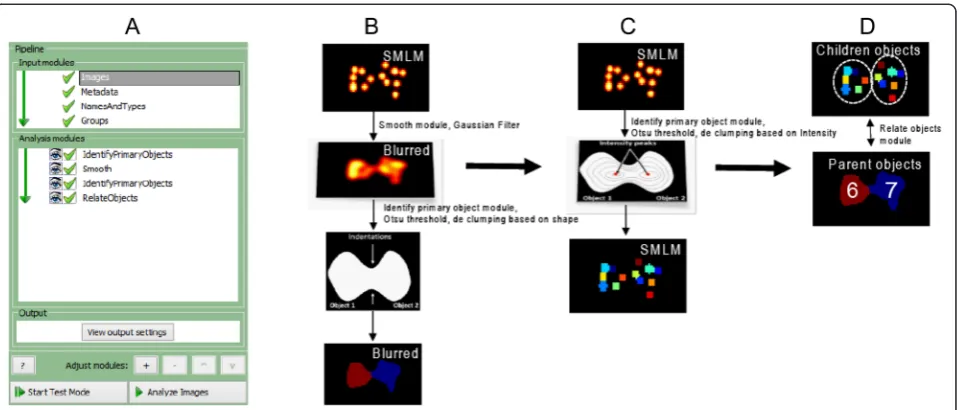
We created a basic simulation image of two adjacent single molecule clusters that simulate SMLM data e.g., PALM or STORM of the active zone bruchpilot protein clusters at synapse of neuromuscular junc-tions (NMJs) of Drosophila [3, 9]. We used CellProfi-ler to automatically count number of clusters per active zone by designing a pipeline tree in (Fig.1b). First, we used a Smooth module to apply a Gaussian
filter with an artifact diameter that is capable of mer-ging only nanoscopic clusters of both virtual active zones, while leaving it possible to delineate the two active zones (Fig. 1b). Next, we used “IdentifyPrimaryObject” module and we set MCT thresholding as indicated in ma-terials and methods. De clumping of individual active zones was done by searching for shape indentations in the fused objects (Fig. 1b), while detection of single molecule clusters per active zone was done by another automated “IdentifyPrimaryObject” module to find single molecule clusters (Fig. 1c). In the latter object search module, we used the same thresholding strategy; however, to de clump individual single molecule clusters we used maximum in-tensity to divide clumped objects (Fig. 1c). Since both identified set of objects or features come from the same image, re-alignment was not required and we could accur-ately relate objects using “RelateObjects” module. This made it possible to quantitatively count number of clus-ters per active zone (Fig. 1d).
Automated Counting of gp210 Subunits and pan-FG Protein per Nuclear Pore Sites Imaged By STED Microscopy
1. Modeling geometry of structures of interest, their clustering density and relative orientation of
clumped objects all of which decides parameters and stringency of Gaussian and segmentation algorithms. 2. Optimization of imaging acquisition parameters e.g.,
finding best field of view, right detector pixel size and laser power.
3. Control experiments to optimize biophysical related parameters e.g., labeling density optimization, label size, and label specificity.
4. Careful testing of models for any type of quantitative SR microscopy experiment and increasing (n) number of images to calculate statistical significance.
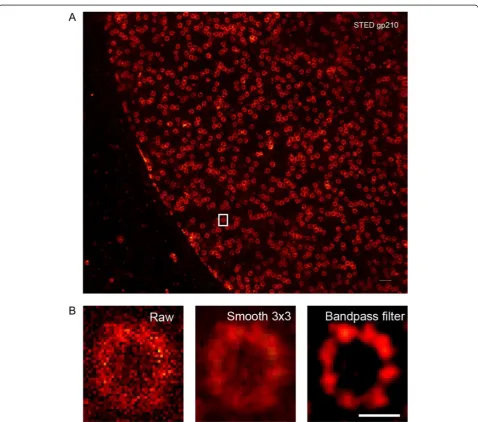
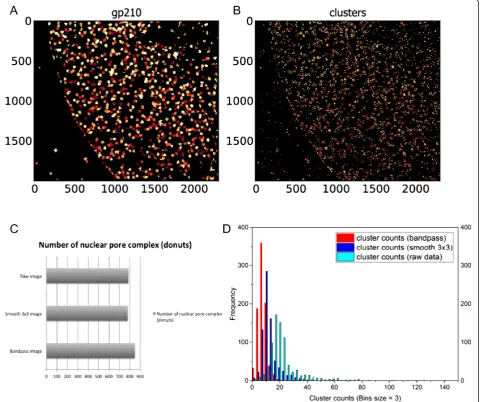
Further, we used a noisy single color STED image of gp210 (Fig. 3a). To enhance visualization of individual gp210 subunits, we applied a smooth filter in ImageJ to enhance features signals, but it was not sufficient and for that we used a bandpass filter to reduce edge pixels arti-facts and enhance contrast (Fig. 3b). (Fig. 4a and b) show an example of segmented images. Intriguing quantification results revealed that bandpass filter, not smoothing, was sufficient to boost the accuracy of cluster segmentation and we had a peak value of 8 clusters per donut from that image (n= 167 show 8 subunits per nuclear pore from an
ntotal= 847), while over segmentation was prominent in raw image and even after smoothing; as indicated by shift-ing of the peak of the histograms toward the right i.e. more clusters per donuts (Fig. 4d). No evident change in the segmentation of donuts before and after prepro-cessing (Fig. 4c). Our final results are in agreement
with previous reports of super resolution images of gp210 and pan-FG protein.
Discussion
Manually defining and tracking biologically meaning-ful ROIs in images obtained by SR microscopy is time consuming and predominantly subjective task; how-ever, it is still the most commonly used approach in SR image analysis [3–5, 12]. We designed pipelines to perform automated quantitative analysis on images acquired by SR microscopy based on a novel proced-ure, which involves Gaussian fusion of super-resolved clusters into meaningful objects. We succeeded to directly perform cluster analysis on nuclear pore com-plex proteins by overlying Gaussian fused objects (do-nuts) with segmentation results from the original SR images (gp210 clusters) to estimate number of gp210 clusters per nuclear pore.
In this paper, we mainly report the novelty and creativ-ity of the procedure and to make pipelines available for public to use, modify and develop. We also suggest that image pre-processing e.g., applying bandpass filters, and critical inspection of SR images quality should always be carefully considered, clearly stated how it was carried out before publishing any quantification results. We
predict that future advancements in the field of user-friendly automated image analysis solutions optimized for SR microscopy will follow.
Conclusion
The proposed computational image segmentation pro-cedure is a novel method optimized for super resolution
Fig. 3Enhancing image contrast by band pass filter improves visualization of gp210 clusters in noisy STED images.aOverview of single color STED image of gp210.bClose up on one nuclear pore (left), signal was enhanced by 3x3 smoothing (middle), or contrast enhanced by bandpass filter (right). Scale bar 500 nm in (a) and 100 nm in (b)
(See figure on previous page.)
microscopy. It could allow direct segmentation of super resolved features in fully automated and user-friendly settings. We successfully quantified the composition of the amphibian nuclear pore complex stained by gp210 and pan-FG proteins imaged with STED microscopy and CellProfiler was used to implement our method in fully automated mode.
Methods and Materials ImageJ and SMLM Data Simulation
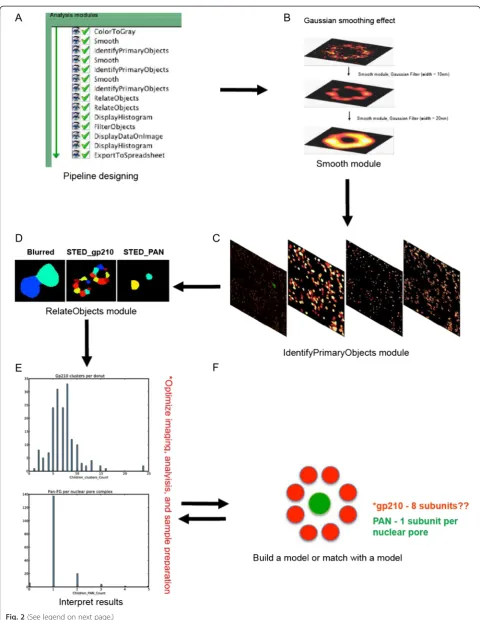
Image Gaussian filters applied in (Fig. 2) was done using ImageJ “Gaussian Blur” Plug-in. SMLM simula-tion in (Fig. 1) was made by brush tool in ImageJ to draw single molecule clusters that resemble Bruchpilot protein clusters at Drosophila neuromuscular junction (NMJ) active zones [3].
STED Images and Pre Processing
STED images used in (Figs. 2, 3 and 4) of gp210 and pan-FG proteins of nuclear pore complex in ovarian am-phibian cells were imaged by a two color STED micro-scope and were valuable gifts from Fabian Göttfert (Prof. Stefan Hell’s Lab) [11]. Pre-processing of STED images via smoothing 3x3 pixels averaging, bandpass or Gauss-ian filters, and linear intensity scaling (for clear visualization) were done in ImageJ and all images were stored as tiff colored (RGB) formats.
CellProfiler Pipelines and Data Analysis
effect, either to merge groups of structures/molecules into biologically meaningful ensembles, or to blur out noise to aid segmentation. “IdentifyPrimaryObject” module was used to find objects of interest in the analyzed images. Un-less stated otherwise, Maximum Correlation Thresholding (MCT) was implemented with 1 pixel Gaussian smooth-ing [13]. Separatsmooth-ing clumped objects was carried based on shape of objects or maximum intensity values within a ra-dius range depending on objects of interest. Distance for lower maxima suppression, which aid to separate clumped objects was set manually to median radius of objects sizes. In that way most of clumped objects in test images did not display over segmentation artifacts. To associate seg-mented objects found in SR images, their respective blurred copy, or any images in different channels in case of two color imaging, we applied “RelateObjects” auto-mated module. According to analysis purpose we set ob-jects as either‘parents’, or‘children’and data were plotted directly by “DisplayHistogram” modules. Data were also exported to spreadsheets using “ExportToSpreadsheet” module to use them in further analysis and to plot data. We used OriginPro9.1 to plot data.
Abbreviations
SR:Super resolution; STED: Stimulated Transmission Emission Depletion; ROI: Region of interest; Gp210: Glycoprotein 210; SMLM: Single Molecule Localization Microscopy; PALM: Photo Activatable Light Microscopy; STORM: Stochastic Optical Reconstruction Microscopy.
Competing Interests
The authors declare that they have no competing interests.
Authors’Contributions
SK participated in the conception and design of the study. SK performed analysis. SK drafted the manuscript.
Acknowledgment
We would like to thank Prof. Silvio Rizzoli for discussions. We are extremely grateful to PhD candidate and colleague Fabian Göttfert in Prof. Stefan’s Hell Lab for providing brilliant STED images. We would like to acknowledge Prof. Jutta Gärtner for supporting the work to take place in our department. We thank our lab team including Dr. Sven Thoms. We wish to thank CellProfiler team for providing a clear explanation tutorials of their open source software image analysis tool. This publication was supported financially by the German Research Foundation (DFG) and the Open Access Publication Funds of Göttingen University.
Received: 8 July 2015 Accepted: 28 July 2015
References
1. Saka S, Rizzoli SO. Super-resolution imaging prompts re-thinking of cell biology mechanisms. BioEssays. 2012;34(5):386–95.
2. Chen KCJ, Ge Y, Kovacevic J, editors. Spatial density estimation based segmentation of super-resolution localization microscopy images. Image Processing (ICIP), 2014 IEEE International Conference. 2014.
3. Ehmann N, van de Linde S, Alon A, Ljaschenko D, Keung XZ, Holm T, et al. Quantitative super-resolution imaging of Bruchpilot distinguishes active zone states. Nat Commun. 2014;5:4650.
4. Lau L, Lee Yin L, Sahl Steffen J, Stearns T, Moerner WE. STED Microscopy with Optimized Labeling Density Reveals 9-Fold Arrangement of a Centriole Protein. Biophys J. 2012;102(12):2926–35.
5. Pageon SV, Cordoba S-P, Owen DM, Rothery SM, Oszmiana A, Davis DM. Superresolution Microscopy Reveals Nanometer-Scale Reorganization of Inhibitory Natural Killer Cell Receptors upon Activation of NKG2D. 2013. 6. Huang B, Bates M, Zhuang X. Super-Resolution Fluorescence Microscopy.
Annu Rev Biochem. 2009;78(1):993–1016.
7. WÄHlby C, Sintorn IM, Erlandsson F, Borgefors G, Bengtsson E. Combining intensity, edge and shape information for 2D and 3D segmentation of cell nuclei in tissue sections. J Microsc. 2004;215(1):67–76.
8. Carpenter A, Jones T, Lamprecht M, Clarke C, Kang I, Friman O, et al. Cell Profiler: image analysis software for identifying and quantifying cell phenotypes. Genome Biol. 2006;7(10):R100.
9. Betzig E, Patterson GH, Sougrat R, Lindwasser OW, Olenych S, Bonifacino JS, et al. Imaging Intracellular Fluorescent Proteins at Nanometer Resolution. Science. 2006;313(5793):1642–5.
10. Löschberger A, van de Linde S, Dabauvalle M-C, Rieger B, Heilemann M, Krohne G, et al. Super-resolution imaging visualizes the eightfold symmetry of gp210 proteins around the nuclear pore complex and resolves the central channel with nanometer resolution. J Cell Sci. 2012;125(3):570–5. 11. Göttfert F, Wurm Christian A, Mueller V, Berning S, Cordes Volker C,
Honigmann A, et al. Coaligned Dual-Channel STED Nanoscopy and Molecular Diffusion Analysis at 20 nm Resolution. Biophys J. 2013;105(1):L01–3.
12. Wurm CA, Neumann D, Lauterbach MA, Harke B, Egner A, Hell SW, et al. Nanoscale distribution of mitochondrial import receptor Tom20 is adjusted to cellular conditions and exhibits an inner-cellular gradient. Proc Natl Acad Sci. 2011;108(33):13546–51.
13. Padmanabhan K, Eddy WF, Crowley JC. A novel algorithm for optimal image thresholding of biological data. J Neurosci Methods. 2010;193(2):380–4.
Submit your next manuscript to BioMed Central and take full advantage of:
• Convenient online submission
• Thorough peer review
• No space constraints or color figure charges
• Immediate publication on acceptance
• Inclusion in PubMed, CAS, Scopus and Google Scholar
• Research which is freely available for redistribution