Lancini, S., Lazzari, M., Masera, A., Salvaneschi, P. (1997). Diagnosing Ancient
Monuments with Expert Software, Structural Engineering International, 7(4), pp. 288-291
Doi: http://dx.doi.org/10.2749/101686697780494392
Author's manuscript, permission to publish online granted by IABSE. First published by the International Association for Bridge and Structural Engineering (IABSE), Zurich, Switzerland, www.iabse.org; in Structural Engineering International, 1997, Vol. 7.,
issue nr. 4, pg. 288-291.
Diagnosing Ancient Monuments with Expert Software
Stefano Lancini, Marco Lazzari, Alberto Masera, Paolo Salvaneschi
ISMES - via Pastrengo, 9 - 24068 Seriate BG - Italy
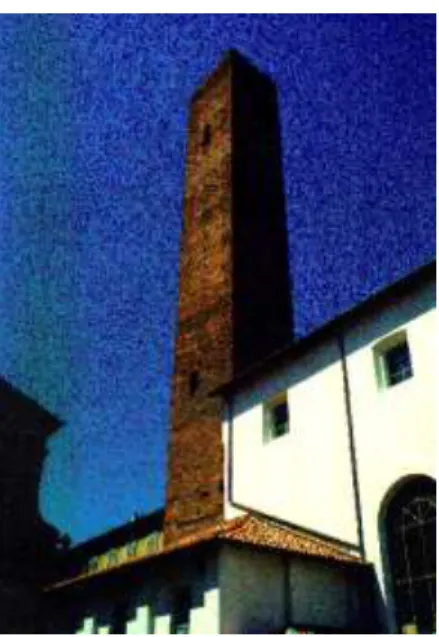
Fig. 1 - San Dalmazio Tower
Summary
In this paper we describe the experience acquired in the fields of automatic monitoring and risk assessment through the surveillance of the ancient monuments of Pavia (the Cathedral and 6 medieval Towers).
Data collected by a complex monitoring system have been systematically processed and critically to verify the behaviour of each structure.
As a result, we developed an expert system (Kaleidos) that provides on-line management and interpretation of the data gathered on the monuments.
1. Introduction
On March 17, 1989 the Civic Tower of Pavia collapsed. After this event the Italian Government appointed a technical-scientific committee to analyse the causes of the collapse and to check the state of the most important ancient monuments in
Pavia. The committee's work included a geometrical survey, investigation of the masonry structure by in-situ and laboratory tests, stress analysis by F.E. models and a complex plan for monitoring surveys.
An overall strengthening of two towers has been undertaken and some minor works have been suggested for other tow-ers. Furthermore, the data recorded between columns 4 and 5 of the Cathe-dral in the period from September to November 1989, together with the simultaneous opening of upper cracks, suggested the installation of a steel chain to connect the columns at the top (see [1] for a discussion on the structural safety assessment performed by the committee).
2. The Monitoring System
The above-cited plan for monitoring led ISMES, in 1989, to install an automatic monitoring system linked via radio to a control centre located at the University of Pavia. The instruments, installed on the Cathedral and on six Towers, acquire 141 measures 4 times a day, whilst the safety managers may start complete or partial acquisitions at any time. The following
cause and effect parameters are
monitored:
cause parameters such as air tempera-ture and masonry temperatempera-ture, solar radiation, direction and speed of the
wind, ground water and Ticino river levels, measured by means of meteo-units, piezometers and thermometers;
opening-closure of significant cracks in the Cathedral (dome, drum, naves) and on the Towers, measured by de-formometers;
global displacements of the structures (dome and top of the Towers), through plumb-lines and automatic telecoordinometers;
planimetric displacements of the top of the dome, through automatic optical sights;
foundation settlements of the columns of the Cathedral, through a level measuring circuit of communicating vessel meters;
stress on the chain between columns 4 and 5, through strain gauges;
strain of some of the Towers' walls and of one of the columns, through wire dilatometers;
rotation of some of the Towers, through tiltmeters.
Dynamic analysis was performed for structural identification purposes (dy-namic tests through vibrodine), but seis-mic monitoring is not carried out, since Pavia is not located in a seismic zone. The software package that manages the monitoring system (Indaco) helps evaluate the reliability of the data and to identify instrument failures.
Characteristics of the monuments and relevant instrumentation system Monument Height(m) Base (m) Instruments and Quantities Cathedral (Dome) 97.00 diameter 27.00 9 causes and 65 effects S.Dalmazio Tower 40.15 4.90 x 4.85 5 causes and 10 effects Belcredi Tower 51.25 5.90 x 5.90 5 causes and 6 effects Clock Tower 39.27 5.50 x 5.45 5 causes and 6 effects Carmine Tower 65.60 9.38 x 7.45 5 causes and 6 effects Maino Tower 48.00 5.13 x 5.07 6 causes and 2 effects University Tower 38.50 5.35 x 5.35 6 causes and 5 effects
3. Behaviour Analysis and
Off-line Management
The measurements gathered by the monitoring system are periodically recorded into the historical archive managed by the MIDAS data base management system at ISMES.
These measurements are processed to ana-lyse the monuments' behaviour and to evaluate their safety conditions. This led us to identify the correlations among the measured quantities and to define the behaviour reference model of the most important parameters for risk assessment. The actual behaviours have been monitored for about 8 years and that helped define the physiological behaviour
of the monuments and to specify thresholds for the on-line monitoring. The global displacements of the structures and local deformation phenomena required an interpretative analysis of the measurements, especially for the Cathedral because of its complexity. The analysis was carried out with special reference to the most important structural parts (dome, drum, columns and naves), taking into account global displacements of the dome, horizontal displacements of the columns, differential settlements of the bases of the columns and opening-closing cycles of the main cracks.
The behaviour analysis pointed out the occurrence of particular cyclic phenomena with seasonal and daily period which are mainly linked to temperature variations [2]. Moreover, through this analysis we checked the consistency of the information provided by different instruments (telecoordinometers on the columns, optic sight on the dome top, strain gauges on cracks) affected by the same phenomena.
4. On-line Interpretation
As a result of the aforementioned analysis, we have identified some possible failure scenarios:
for the Cathedral dome, vaults and arches, failures could be indicated by high stresses and displacements before unstable situations;
for the Towers, a sudden brittle collapse could be envisaged
Considering such scenarios, some form of on-line interpretation of the monitoring data would be appropriate for several reasons: as a support for the safety
managers' interpretation tasks, for detecting conditions that need inter-vention; as an alarm system in case of anomalous behaviours; as a filter of accidental misbehaviours of the monitoring instruments.
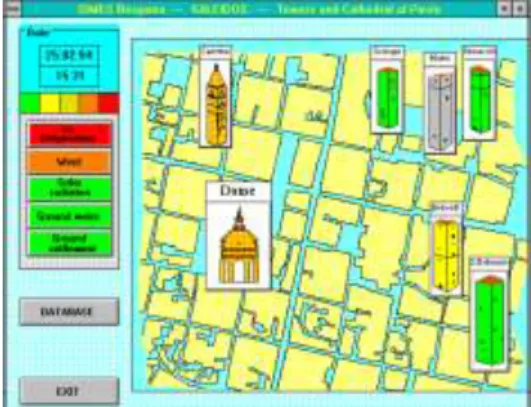
Therefore, in January 1994 we installed an interpretation software system (Ka-leidos) on a personal computer connected to the monitoring system in the acquisition centre at the University of Pavia (Fig. 2); Kaleidos is an expert system for evaluat-ing, explaining and filtering the data collected by the monitoring system. The aims of Kaleidos are to provide on-line interpretation of the behaviour of the structures, advise Safety Managers for intervention and alert the Civil Protection, if necessary, through automatic telephone calls.
The architecture of the checks carried out by Kaleidos is shown in Fig. 3. The on-line assessment is based on three steps:
a. definition of the state of each measurement by checking against thresholds the measured value, its rate of change and its distance from a value forecasted by a reference numerical model;
b. evaluation of the state of elementary structural units (e.g. gores of the dome) and identification of anomalous processes (e.g. opening of cracks) to find out any anomalous structural behaviour; for the Towers the structural unit corresponds to the entire monument;
c. synthesis of the previous evaluation steps in order to assess the state of each monument and, if necessary, to dispatch pre-set telephonic warning messages to the Safety Managers or to the Civil Protection.
In the following, we provide some details on the checks performed by Kaleidos.
4.1. State of Single Measurements
The validation of the measurements and the definition of their state is the first step in the interpretation process. The measurements are checked against pre-set thresholds, determined on the base of the physiological behaviour recorded in the past, at three different levels:1. the first level verifies that the meas-urement falls within a variation range defined according to the physical characteristics of the parameter under examination or to the past evolution of the same quantity. This variation range may be either a min-max interval
ALARM CONDITION TELEPHONE MODEM STATE OF STRUCTURAL UNITS IDENTIFICATION OF PROCESSES CONGRUENCY CHECKS STATE OF THE MONUMENT •TEST ON ACQUISITION UNIT
•TEST ON ISTRUMENT •CHECK OF LOGICAL RELIABILITY
– Instrument full scale – Physical out-threshold – Seasonal out-threshold READING VALIDATION PROCESS EVALUATION SYNTHESIS PHYSICAL THRESHOLD MEASURE RATE VARIATION REFERENCE NUMERICAL MODEL • WARNING - Safety Manager MAINTENANCE CALL "MEASURE" KALEI DOS I NDACO STRUCTURAL CONTROL STATE OF EACH MEASURE
READ VALUE Reading validated Failure Telephone Message • ALARM - Civil Protection I F
Fig. 3 - Kaleidos: control architecture Fig. 2 - Kaleidos: control panel
(fixed threshold) or a tolerance interval based on a periodic variation of the measure computed by a Fourier series development, when the measure is affected by cyclic period variation in time (periodic threshold).
For instance, for each plumbline, at a given instant a value f() is estimated through the Fourier series de-velopment, and the threshold values f() and f() are checked against the current measurement, where is the standard deviation of the values used in the off-line analysis of the time series and and are ap-propriate constants. In this way, five subsets on the possible values of the measurement are detected, which cor-respond to the normality and to four different warning situations (for proc-essing purposes, in some cases we map them into real numbers);
2. the second level checks the variation rate of the measures. The speed shall not overcome pre-set thresholds determined according to the values obtained in the past (fixed thresholds); 3. the third-level check compares real
measures and values computed at run-time by reference numerical models tuned on the past behaviour of each structure.
4.2. Evaluating processes and
structural entities
Kaleidos uses the results of the checks on single measurements to evaluate the current state of each elementary structural unit and identify the activation state of physical processes going on.
On the ground of geometric reasoning, physical models and empirical knowledge, we have identified relationships among sets of measures, which lead the evaluation process of each single group of measures. At this level, Kaleidos exploits knowledge about significance and
reliability of the instruments.
4.2.1. Activation state of processes
We have used model-based reasoning techniques to define some relationships on groups of measurements, which we use to identify the activation state of some struc-tural processes - that is behaviours that might be active in the structure - on the ground of the state of the monitored parameters, as identified by the first interpretation step:
Differential movements (in particular
opening) of the upper part of the col-umns or vertical and horizontal displacements of the top of the dome;
Differential settlements at the base of
the columns;
Deformation of the cracks
(opening-closing movements) in the Cathedral dome and naves or stress state of the chains installed between two pilasters. For instance, we have implemented rules like the following:
if
the measure of the dilatometer 1/A is anomalous and its speed is highly anomalous
and
the measure of the dilatometer 2/A is normal and its speed is anomalous then
the activation state of the opening of cracks in the zone 1 of the dome is highly anomalous
4.2.2. State of structural entities
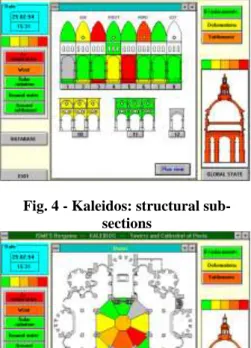
We have defined 12 zones and 5 sections in the Cathedral, which are associated to the relevant measurements; they corre-spond to (see Figs. 4-5):
Zones:
n.1-8: Octagon of columns at the base of the Cathedral dome;
n.9: top of the dome;
n.10-12: Parts of the naves where some dilatometers are installed over cracks.
Sections: dome, drum, columns, base
columns, nave.
Kaleidos evaluates the state of each zone; moreover, it evaluates the state of each sub-section, where a sub-section corre-sponds to the group of instruments result-ing from the intersection of a zone and a section (e.g., the instruments on the col-umns of the zone 4).
Each evaluation results from two contributions: the activation state of the processes within the entity; an empirical evaluation of the state indexes of the instruments of the entity.
The empirical evaluation is a linear
com-bination of the state indexes of the in-struments, weighted on the ground of the reliability and significance of the instruments. In this way, the most important instruments have a major impact on the definition of the empirical index, whilst alarms from the least reliable instruments may be attenuated or even filtered, when not supported by other ones; therefore, the empirical evaluation
acts as a congruency check on groups of data.
4.3. Global Synthesis
The synthesis process is the third step of
the interpretation. The results of the analy-sis of single measurements, structural elements and anomalous processes, are analysed in order to synthesise the current state of each monument.
Furthermore, from the trace of execution, using knowledge about the behaviour of the Cathedral and the Towers, Kaleidos builds a natural-language explanation of its evaluations, highlighting the state of each monument and their possible anomalies. We have studied and tuned an explanation mechanism such as the messages built by Kaleidos provide the users with a synthetic and effective picture of the state of the structures.
On the base of the synthesis, Kaleidos sends automatic telephonic messages to the Safety Managers (warning situations) or to the Civil Protection (emergencies); these messages are not intended as explanations, but simply as stimuli for the safety experts, who are expected to react to them by examining the measures and their interpretation, and by providing their own interpretation and decision. For
Fig. 4 - Kaleidos: structural sub-sections
instance, whenever our safety experts receive a call from Kaleidos, they get from the monitoring system the measures of the latest acquisitions (via modem), reprocess them through a local copy of Kaleidos, and analyse both data and Kaleidos’ evaluations to understand what is going on.
5. Kaleidos' Interface
The user can access the processing results through a window-based interface. The interface draws on the screen graphical representations of the objects (monu-ments, zones and sections, processes, measures) that have been assessed and displays them using a colour scale based on the objects' state; natural language ex-planations of the analysis are shown on the screen too. Interactors are available to give users more refined information by focusing on interesting details. Via the in-terface the user can also activate man-agement functions, such as print screen, and access the internal data base.
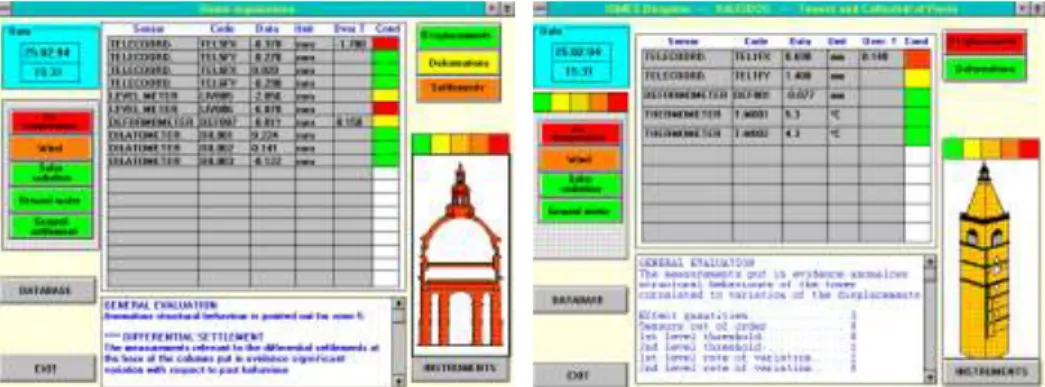
Figs. 4-7 show some screen shots, where Kaleidos displays the current readings, the state of the monuments and the relevant explanation (test situations, based on simulated data).
6. The role of the AI
Kaleidos' interpretation engine is based on artificial intelligence (AI) concepts and techniques. Their use is twofold: firstly, we exploited them in the design phase to gather and formalise expert knowledge using, for instance, causal networks of processes and qualitative modelling [3]; secondly, we exploited AI techniques, such as rule-based processing, in conjunction with conventional techniques, to implement these represen-tation and
reasoning schemes.
The explicit modelling of the engineering knowledge that derived from this process implies a clear separation of data and reasoning agents, which results in a sys-tem that can be easily modified: when new data structures are required (for in-stance, when a new instrument is added), they can be introduced in a declarative way that does not need reprogramming of the evaluation processes; on the other hand, if we want to modify or enrich the interpretation mechanisms, we can oper-ate on them without any modification of the objects to be evaluated.
This seems to be very promising for potential developments of the system for other monuments, as we can derive from our experience with Mistral, a decision support system for dam safety manage-ment that shares with Kaleidos its architecture and evaluation mechanisms. Mistral is currently installed on three arch-gravity dams: since each dam has its own original features, the development of these versions required a large effort to gather the relevant knowledge, while codifying this knowledge into Mistral's data structures was rather simple, since it implied essentially the redefinition of the declarative code that describes the objects to deal with, and the tailoring of the relevant rules. In fact, from the programming point of view the largest effort is required for updating the graphical interface.
The integration of different software technologies was the fundamental choice for the development process, aiming at using the right tool in the right place: therefore, we used Prolog for the interpre-tation and explanation engine, C for nu-merical processing, Visual Basic for both interface and data management. Kaleidos runs on a 386 PC under MS-WindowsTM.
7. Concluding remarks
Kaleidos performs an on-line interpreta-tion every 6 hours; an analysis of its first results (January '94 - September '96) on a set of more than 6000 situations (about 850.000 measurements), pointed out the following issues:
wrong data were properly filtered, avoiding incorrect warnings;
anomalies of the instrumentation were timely detected;
the basic parameters used by Kaleidos (thresholds, parameters of the refer-ence behaviour, significance and re-liability of the instruments) were con-firmed and did not need any update;
the behaviour of the structure complies with the reference forecast scenarios, without the identification of any anomalous process (note that, during the testing phase of the system, we have checked it against several collapse scenarios);
the availability of a large database of situations evaluated by Kaleidos will be helpful for any future improve-ment of the system, both for tuning new empirical or model-based strategies, that could be checked against real data, and for applying case-based reasonig techniques, that could highlight similarities between the current situation and past reference situations, which are regarded as significant in respect of safety management, as we have already experienced within other decision support systems [4].
Acknowledgements
The development of the system was supported by the Provveditorato alle Opere Pubbliche - Regione Lombardia. We are grateful to Professor Giorgio Macchi of the University of Pavia for his co-operation and suggestions.
References
[1] Macchi, G. "Monitoring medieval structures in Pavia", Structural
Engi-neering International, 3(1), 1993
[2] Macchi, S. "Structural identification of Pavia Cathedral by monitoring of the seasonal movements", IABSE
Colloquium on Inspection and
Monitoring of the Architectural
Heritage, Bergamo, Italy, May 1997
Fig. 6 - Kaleidos: looking at the measurements
[3] Salvaneschi, P., Lazzari, M., Lanci-ni, S., Masera, A., Menga, R., Maz-zà, G. "Diagnostic Reasoning in Monitor-ing of Civil EngineerMonitor-ing Structures",
IABSE Colloquium on Knowledge
Support Systems in Civil Engineering,
Bergamo, Italy, March 1995
[4] Brembilla, L., Lazzari, M., Salva-neschi, P., “Neural associative memories for detecting analogies: an application to structural safety management”, Second Workshop of the European Group for Structural Engineering Applications of Artificial
Intelligence, Bergamo, Italy, March