K. Kuhn et al. (Eds) IOS Press, 2007
© 2007 The authors. All rights reserved.
Selected for best paper award.
User Interface Optimization for an Electronic Medical Record System
Kai Zheng
a, Rema Padman
b, Michael P. Johnson
baSchool of Public Health and School of Information, University of Michigan, U.S.A. b H. John Heinz III School of Public Policy and Management, Carnegie Mellon University, U.S.A.
Abstract
Many information technology-enabled healthcare applica-tions have failed because their interfaces are difficult to use. Unfortunately, little attention has been paid in the health informatics community to designing effective user interfaces that are acceptable to healthcare professionals. This paper illustrates a method for improving application interface usability by applying sequential pattern analysis to analyze temporal event sequences recorded in an elec-tronic medical record system. Such event sequences, or clickstreams, reflect clinicians’ navigation patterns in their everyday interactions with the computer system. The identified patterns have been used by software developers to calibrate the user interface of the system, so that the within-application workflow is better aligned with clini-cians’ mental model of medical problem-solving. Such inferred patterns may also help to modify clinicians’ sub-optimal practice behavior components, as manifested through their actual usage of this point-of-care electronic system.
Keywords:
user-centered design; user interface design; sequential pattern analysis; human-computer interaction; usability assessment; data display
Introduction
Medical practice is a complex process. Large amount of data must be accessed, assembled, and analyzed at the point of care to inform proper medical decision-making. In the era of paper-based patient records, clinicians flip through stacks of paper charts to look for desired informa-tion. The use of electronic systems has greatly facilitated health data retrieval. However, it has also introduced new dimensions of problems. Two paper documents, for instance, can be laid out side by side for cross reference, while on a computer screen it is usually impractical to have two windows visible at the same time. How to pre-serve the easy “look-and-feel” of paper charts is a real challenge for software developers. In addition, poorly designed application navigation flow may also escalate learning effort, decrease productivity, and increase user errors [1, 2].
Lack of good user interfaces has been long recognized as a major impediment to the acceptance and routine use of clinical informatics applications [3]. Unfortunately, very few research studies have looked at design principles for building intuitive and effective healthcare user interfaces (UI); even fewer have validated the usability of existing UI design in realistic clinical settings. Consequently, “systems are created ad hoc, users are dissatisfied, and often sys-tems are abandoned” [2].
The present study was motivated by these facts. The com-puter system in question, the Clinical Reminder System (CRS), is a “lite” electronic medical record system (EMR) that collects, stores, and manages a wide range of patient and clinical data [4, 5]. In addition to its regular EMR functionalities, CRS is also intended to improve quality of care by providing clinicians “just-in-time” alerts and advi-sories using evidence-based guidelines.
Since 2002, CRS has been deployed in an outpatient clinic at an urban hospital, and used by clinicians to treat patients in real time. While user, task, and representational analysis were performed during the software design phase with constant feedback by participating clinicians, its UI design was still critiqued after being routinely used in clinicians’ everyday practice. In a user satisfaction survey following a 10-month field trial, users complained that the applica-tion’s early user interface, shown in Figure 1, provided little guidance as to a desired workflow [4, 5]. As a result, user acceptance was not satisfactory, and the utilization rate of the system remained low [4, 5].
Although this UI reflected the best knowledge of develop-ers and preferences of the client organization, the standard Windows-based layout was reported as “not aligned with our common practice styles”. The horizontally arranged tabs, for example, did not reflect the preferred order of clinical information access. As a result, users expended substantial energy unnecessarily to adapt their practice to a UI design that they considered “uncomfortable”.
Figure 1 - An early user interface
To solve the identified UI flaws, the system was reengi-neered into a full web-based application. A screenshot of the new web interface is shown in Figure 2. Unique fea-tures of the web-enabled application provide tremendous promise for maximally preserving the “look-and-feel” of traditional paper charts. In the new design, for example, different features conveying different clinical information elements are no longer arranged in a tabular form, instead, they are displayed in the same workspace that can be easily navigated by mouse scroll wheels, simulating paper-flip-ping behavior. A navigation menu is also provided on an adjacent frame to enable fast switches across different fea-tures. However, it is not known whether this new design is consistent with, or represents an improvement upon, clini-cians’ typical workflow.
The study reported in this paper was therefore conducted to identify the preferred sequential order in which different features of the system are accessed. To learn clinicians’ navigation behavior, this study uses a sequential pattern analysis method to analyze actual usage recorded in the computer logs that contain time stamped events. Actual usage data, unlike many software usability experiments, represent users’ interaction with a system under real work-ing conditions, rather than on contrived laboratory exercises.
Methods
Sequential pattern analysis
Sequential pattern analysis discovers hidden and recurring patterns within large sequences of events. It has been applied in a wide variety of domains such as web person specialization and page recommendation [6], HCI usabil-ity testing [7], and genetic sequence analysis [8]. In this study, a consecutive sequential pattern algorithm is employed to analyze the event sequences recorded in CRS. This algorithm detects consecutively occurring events that
Figure 2 - New user interface to be evaluated appear across different sessions. Such patterns, that repre-sent adjacent feature accesses frequently occurring next to each other and in a given sequential order, are of particular interest to inform UI redesign.
Lets denote an even sequence by <e1,e2, … , en>, where ej,j 1…n, is an event that occurs at the jth position in s. The consecutive sequential pattern algorithm finds a sequencep <pt,pt+1, … , pt+l> that is a subset of s, which is also part of, or supported by, other sequences. The sup-port for p is defined as the fraction of total sequences that supports p. When a sequence satisfies a certain minimum
support threshold, it is named a Sequential Pattern. The largest length sequential pattern that is not part of any other patterns is called a Maximal Sequential Pattern. The objective of the sequential pattern analysis is to find all such maximal sequential patterns.
When the minimum support is a constant for any given length, the most efficient algorithm starts with calculating support for all possible sequences composed of two con-secutive events. When a sequence does not satisfy the minimum support, it is removed from further computation; otherwise, it is treated as a candidate sequence to compute support for larger length sequences. The algorithm stops when no larger length sequences based on a current candi-date would satisfy the minimum support. The current candidate sequence is then chosen as a maximal sequential pattern.
Study site and data collection
In this study, 10 months of usage data were electronically collected from October 1, 2005 to August 1, 2006 and ana-lyzed. These usage data were generated from the most recent web-enabled version of CRS. The system imple-mentation was accomplished in the summer of 2005 and substantial training was provided afterwards.
The main CRS user population during the study period was composed of 40 first-, second-, and third year internal medicine residents. Residents who used the system for fewer than 5 patient encounters are excluded from the analysis. It is likely that such users’ interactions with CRS do not reflect mature application usage. 30 active resident users were thus identified, whose system usage was recorded in 973 unique patient encounters.
Data analysis and results
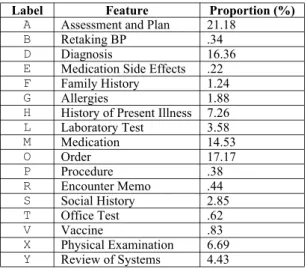
Data preparationData preparation procedures were performed prior to the analysis. All events and their affiliated attributes, such as session ID and time stamp, were first collected from scat-tered data tables. The event type was then mapped based on a labeling schema, which is composed of distinct letter symbols. Table 1 lists all 17 main features1 that the CRS application provides, ordered alphabetically by their label-ing symbols2. The screenshot shown in Figure 2 illustrates the on-screen positions of each of the 17 major features. Event sequences were then constructed. HMMMYAD, for instance, is a 7-length sequence composed of 7 events that occurred within a patient encounter, ordered chronologi-cally by their time stamps. The resulting event sequences are further consolidated by collapsing repeating access to a
same feature. For example the segment MMM, “prescribing multiple medications consecutively”, is collapsed into one single event M. In this study only across-feature navigation is of interest, that is, “jumps” across different features. Figure 3 shows the distribution of event sequence length after the collapsing operation. The sequences composed of 4 or less events are excluded from further data analysis because they provide little information in regard to sequential navigational patterns. This operation results in the loss of 6 additional users whose recorded sequence lengths are all below 5. After these data preparation proce-dures 473 event sequences are retained, generated by 24 distinct resident users. Distribution of number of sequences owned by each user is depicted in Figure 4. Sev-eral sample event sequences are shown below:
HMOMYXAM GHXVHADADHA HGYXADAOMYSX OMRHFYXYXADADA HXOPMOMOMOMODADAM HSXDADADADADAMOMOMOMOMO
Figure 3 - Distribution of event sequence length
Figure 4 - Usage distribution among users Frequency of feature access
Table 1 shows the aggregated proportion of feature accesses3. These proportions roughly represent how fre-quently each application feature was used. As shown in Table 1, among the 17 major features “Assessment and Plan”, “Diagnosis”, and “Medication” were most heavily used. Note that while “Encounter Memo” appears on top of screen, it was seldom accessed.
1 Feature that must be displayed in a certain position for legal reasons, such as patient’s demographics always appearing on top of an encounter page, is excluded from the consideration of this study. Also excluded are non-actable or not yet activated features, for example “Reason for the Visit” that is entered by nurses when a patient calls to make an
appointment.
2 A symbol letter is usually the first letter of a feature unless
there is a conflict. 3 Repeating access to a same feature is counted only once.
0 5 10 15 20 25 30 35 40 45 50 S e q u e n c e L e n g t h 0 5 10 15 20 25 30 35 40 45 50 55 60 65
Table 1 - Main features and overall frequency of access
Table 2 shows the results of the sequential pattern analysis. All maximal sequential patterns included in the table sat-isfy a minimum support threshold of 15%. These patterns are sorted by the level of support they received.
Table 2 - Maximal sequential pattern discovered
Some interesting sequential patterns emerge from Table 2. ADAD, appearing in 51.16% of all encounters, is the most salient pattern discovered, followed by a similar and par-tially overlapped pattern DADA, with 43.97% support. It indicates that the users of CRS frequently switched between the features “Assessment and Plan” and “Diagno-sis”. Similarly, users frequently switched between “Order” and “Medication”, with 35.1% support for OMOM and 27.06% support for MOMO; and “Order” and “Laboratory Test”, with 18.6% support for OMOM and 15.64% support for MOMO. A further examination found that A precedes D more often (89.18%) when a user entered the AD...AD or DA...DA segment. Similarly, O was usually accessed before M (72.57%), and before L (71.58%).
Supported by 40.17% of all encounters, ADA is preceded by X - “Physical Examination”, and YXAD appears in 21.78% of time. This indicates that “Physical Examina-tion” “Assessment and Plan” “Diagnosis” is a frequently traversed path, which is often preceded by accessing “Review of Systems”. Further, OMY occurs in 16.7% of all sequences, indicating that OM - “Order” and “Medication”
were often used before Y - “Review of Systems”. HS -“History of Present Illness” then “Social History” and HS -“History of Present Illness” then “Order”, are two other consecutive patterns with slightly smaller support, 19.03% and 15.01%, respectively.
Anad hoc within-sequence analysis was further conducted to detect sequence segment recurring within an encounter session. Results are shown in Table 3. The “Probability of Repeat” in Table 3 exhibits the probability of a two-length event segment recurring within a sequence. DA or AD -“Diagnosis” and “Assessment and Plan”, OM or MO -“Order” and “Medication”, and OL or LO - “Order” and “Laboratory Test”, are three frequently repeating segments thus identified, which also confirm the cross sequence pat-terns of DADA, ADAD, OMOM, MOMO, OLOL, and LOLO. Because items in these reappearing sequence segments were usually accessed next to each other, they are hereby referred to as Bundled Action.
Table 3 - Recurring patterns within encounters
The repeating access to bundled actions, however, blurs the boundary of “jumps” from a series of bundled action accesses to other features. For example the reappearing AD with varying length in the sequence HADAD...ADADXY impairs the analytical power for discovering whether there exists a pattern H-AD-Y that may help reveal interesting patterns at an overall level. Similar to collapsing repeating access to the same feature, repeating access to the same bundled action is further collapsed to count as one single occurrence. For example the HDAD...ADADAXY sequence is converted into HDAY to form a new, higher level sequence.
A second pass sequential pattern analysis was then con-ducted to analyze the event sequences obtained after this collapsing operation. ADO - “Assessment and Plan” to “Diagnosis” to “Order” is the only additional sequential pattern thus identified, supported by 15.64% of all encoun-ters. This pattern indicates that after a user finished working on “Assessment and Plan” and “Diagnosis”, he or she would switch to the “Order” section immediately to prescribe orders of new medications or laboratory tests.
Discussion
Based on the findings from analyzing actual usage data with sequential pattern analysis, several UI design princi-ples can be arrived at:
• “Encounter Memo” should be properly relocated. This feature is less frequently used while occupying the most salient position in the current design;
Label Feature Proportion (%)
A Assessment and Plan 21.18
B Retaking BP .34
D Diagnosis 16.36
E Medication Side Effects .22
F Family History 1.24
G Allergies 1.88
H History of Present Illness 7.26
L Laboratory Test 3.58 M Medication 14.53 O Order 17.17 P Procedure .38 R Encounter Memo .44 S Social History 2.85 T Office Test .62 V Vaccine .83 X Physical Examination 6.69 Y Review of Systems 4.43
Maximal Sequential Pattern Level of Support (%)
ADAD 51.16 DADA 43.97 XADA 40.17 OMOM 32.77 MOMO 29.39 YXAD 21.78 HS 19.03 OL 18.6 OMY 16.7 LO 15.64 HO 15.01
Sequential Pattern Probability of Repeat (%)
AD 70.22 MO 64.98 OL 64.77 DA 64.35 OM 63.67 LO 51.35
• “Assessment and Plan”, “Diagnosis”, and “Medica-tion” are the most frequently accessed features. They should be placed in the most salient positions on a computer screen;
• “Assessment and Plan” and “Diagnosis”, “Order” and “Medication”, and “Order” and “Laboratory Test” are bundled actions. They are usually accessed next to each other and often used multiple times within an encounter session. Navigation aids such as hyperlink shortcuts should be provided to facilitate these frequent feature switches;
• “Review of Systems”, “Physician Examination”, “Assessment and Plan”, and “Diagnosis” should be presented adjacent to each other in this sequential order. Accesses to these four features often appear as a series of events occurring sequentially.
These design principles have been used in redesigning the existing user interface of CRS. Since the basic EMR func-tionalities that CRS provides are universal, these design principles may also be applicable to other electronic medi-cal record systems.
Conclusions
Improving the UI design of an electronic medical record system can be successfully attained by analyzing the actual usage data recorded during its everyday use. The sequen-tial patterns identified in this paper led to a set of design principles used in redesigning the application’s user inter-face. These design principles mainly propose that different clinical information elements should be presented in the sequential order in which they are usually accessed, which reflects clinicians’ mental model of medical problem-solv-ing durproblem-solv-ing patient encounters.
This study has a few limitations. First, actual usage data must be collected from a working system. Its current design, inevitably, may exert an influence on users’ own working style. Second, the findings are derived from test-ing a stest-ingle system with certain unique features. While the method and the results provide general insights into designing user interfaces for other types of health
applica-tions, they may not be used without careful customization. Finally, the user population of this study was mainly com-posed of internal medicine residents. The derived design pattern reflecting their practice style may not be generaliz-able to other clinical specialties.
References
[1] Bates DW, Kuperman GJ, Rittenberg E, Teich JM, Fiskio J, Ma'luf N, Onderdonk A, Wybenga D, Winkelman J, Brennan TA, Komaroff AL, and Tanasijevic M. A randomized trial of a computer-based intervention to reduce utilization of redundant laboratory tests.
Am J Med 1999; 106(2):144-50
[2] Tang PC and Patel VL. Major issues in user interface design for health professional workstations: summary and recommendations. Int J Biomed Comput 1994; 34(1-4):139-48.
[3] Johnson CM, Johnson TR, and Zhang J. A user-centered framework for redesigning health care interfaces. J Biomed Inform 2005; 38(1): 75-87.
[4] Zheng K, Padman R, Johnson MP, Engberg J, and Diamond HS. An adoption study of a clinical reminder system in ambulatory care using a developmental trajectory approach. Medinfo. 2004; 11(Pt 2):1115-9.
[5] Zheng K, Padman R, Johnson MP, and Diamond HS. Understanding technology adoption in clinical care: clinician adoption behavior of a point-of-care reminder system. Int J Med Inform 2005; 74(7-8):535-43. [6] Montgomery AL, Li SB, Srinivasan K, and Liechty JC.
Modeling online browsing and path analysis using clickstream data. Marketing Science 2004; 23(4):579-95. [7] Siochi AC and Ehrich RW. Computer analysis of user
interfaces based on repetition in transcripts of user sessions, ACM Transactions on Information Systems 1991; 9(4):309-35.
[8] Eres R, Landau GM, and Parida L. Permutation pattern discovery in biosequences. J Comput Biol 2004; 11(6):1050-60
Address for correspondence
Kai Zheng, [email protected], M3531 SPH II, 109 S. Observatory, Ann Arbor, 48109-2029, U.S.A.