Research Papers
ECIS 2018 Proceedings
11-28-2018
Closing the Loop of Big Data Analytics: the Case of
Learning Analytics
Marta Stelmaszak
London School of Economics, [email protected]
Aleksi Aaltonen
Warwick Business School, [email protected]
Follow this and additional works at:
https://aisel.aisnet.org/ecis2018_rp
This material is brought to you by the ECIS 2018 Proceedings at AIS Electronic Library (AISeL). It has been accepted for inclusion in Research Papers by an authorized administrator of AIS Electronic Library (AISeL). For more information, please [email protected].
Recommended Citation
Stelmaszak, Marta and Aaltonen, Aleksi, "Closing the Loop of Big Data Analytics: the Case of Learning Analytics" (2018).Research Papers. 82.
Twenty-Sixth European Conference on Information Systems (ECIS2018), Portsmouth,UK, 2018
Research paper
Stelmaszak, Marta, London School of Economics and Political Science, London, UK,
[email protected]
Aaltonen, Aleksi, Warwick Business School, Warwick, UK, [email protected]
Abstract
Much of the literature on business analytics assumes a straightforward relationship from human be-haviour to data and from data to analytical insights that can be used to steer operations. At the same time, more critical scholars have suggested that the implications of big data analytics can go beyond improved decision making, sometimes twisting or even undermining managerial efforts. We adapt a theory of reactivity, originally developed to study university rankings, to identify various unintended effects of the application of big data analytics in an organizational setting. More specifically, we study the perceptions of a sophisticated learning analytics system among staff members of an internationally recognized business school. We find evidence for four reactive effects: re-allocation of resources, change in values, redefinition of work and practices, and gaming, and map these to four underlying reactive mechanisms: commensuration, self-fulfilling prophecies, reverse engineering and narratives. The study contributes toward theoretically broader, but also more practical understanding of big data analytics: reactivity may dilute the methodological validity of analytics to describe organisational and business environment for managerial purposes, yet the understanding of reactive effects makes a more potent use of analytics possible in organisational settings.
Keywords: Big data, Analytics, Reactivity, Business intelligence.
1
Introduction
Research on business analytics (e.g. Bayrak, 2015; Ittmann, 2015; Bichler et al., 2017) and, more gen-erally, data science constantly uncover new data sources and improve modelling techniques to support more effective decision making. Much of the literature assumes a relatively straightforward relation-ship from human behaviour to data and from data to analytical insights. Broadly managerial interest on analytics revolves then on the ability of the data to represent internal and external business environ-ments in an increasingly detailed fashion and, thus, to serve optimization, innovation and strategic planning efforts critical to organisational survival. At the same time, critical researchers from infor-mation systems (Alaimo, 2014; Alaimo and Kallinikos, 2017; Constantiou and Kallinikos, 2015; Ek-bia et al., 2015) through sociology (Ruppert, 2012; van der Vlist, 2016; Iliadis and Russo, 2016) to media studies (Puschmann and Burgess, 2014; Gregg, 2015) have sought to problematize the opera-tion of big data analytics by showing that big data often incorporate various social, cultural and tech-nical biases. In short, the implications of big data and business analytics are shown to go beyond im-proved decision making, and sometimes even undermine it.
Our study is motivated by arguments found in the latter, critical literature that big data analytics may come unintendedly feed back to what it purports to reveal. This raises serious methodological and managerial issues regarding the adoption of big data analytics in organisational settings. A more thor-ough understanding of how big data analytics feeds back into phenomena it claims to describe or pre-dict can help making better use of such analytics, including drawing important lessons for decision-making and strategy (Constantiou and Kallinikos, 2015). In particular, we harness an established
theo-Twenty-Sixth European Conference on Information Systems (ECIS2018), Portsmouth, UK, 2018 2 ry of reactivity (Espeland and Sauder, 2007) from sociology to attempt to lay bare the mechanisms by which analytical systems and related practices may shape the organisational setting in which they are embedded. An understanding of such unintended feedback mechanisms involved in big data analytics, which we hope to contribute to, can help solve some of the persistent problems in analytics, reconcile conflicting results, and thus enable a more potent use of big data. Our research question is: How does the application of big data analytics interact with or shape the phenomenon it purports to describe and predict?
To investigate the reactive character of big data analytics, we conduct a qualitative case study on a sophisticated learning analytics system used by an internationally-recognized business school to col-lect, analyse and utilize data about student learning. Learning analytics is a type of business analytics that has recently emerged as an increasingly influential practice in higher education (Siemens, 2013, p. 1328), offering a good opportunity to explore potential bi-directionality in causal relations that emerge with the adoption of analytical tools and techniques. We carried out 31 interviews between June and September 2017 with 29 members of academic, teaching, administrative and systems development staff at different levels of seniority to learn how they use the learning analytics system and how the data collection and analysis may feed back into the operations.
2
Literature review
2.1
Big data analytics
Early evangelists of big data cultivated a belief that data can, in a direct and undisturbed way capture and describe reality, bringing “the end of theory” (Anderson, 2008), as big data allows for “rendering into data aspects of the world not previously quantified” (Kennedy et al., 2015, p. 1). Parallel to devel-opments in big data, a stream of research rooted in computer science and statistics have focused on refining statistical models and predictive powers of analytics, taking the relationship between the events or phenomena and data that describe them for granted and as unproblematic, as though big data fully and faithfully represented the world (Ekbia et al., 2015, boyd and Crawford, 2012; Kitchin, 2014). At the same time, other strands of literature point to the highly reductive character of all data. Data are in essence “the things having been given”, as the etymology of the term can be traced back to Latin (Galloway, 2011, p. 87; Rosenberg, 2013, p. 37), being also present in other languages such as French. Data are thus not the same as the facts recorded, but what is “remaining after the tide of being recedes” as Galloway (2011, p. 87) puts it almost poetically. In the extreme case, it may be even so that data have “no relation to truth or reality beyond the reality that data helps us to construct” (Rosen-berg, 2013, p. 37). The various mechanisms involved in the production of big data have become an object of increasing scrutiny. The main issue pertains to how technology translates social interaction into computable objects (Alaimo and Kallinikos, 2017) through creating sets of actions that become encoded along computable paths (Alaimo and Kallinikos, 2017), which is often a highly reductive process.
The production of big data and their analytics rely heavily on commensuration, that is the transfor-mation of different qualities into a common metric (Espeland and Stevens, 1998). Commensuration is required to make data relational and recombinant (Kitchin and McArdle, 2016). Another potent mech-anism involved in the production of big data is classification, that is “a spatial, temporal, or spatio-temporal segmentation of the world” into “sets of boxes” (Bowker and Star, 1999, p. 10), where data can only be assigned to pre-existing, established fields, or classes (Fourcade and Healy, 2013). Finally, the use of big data relies on the mechanisms of calculation (Power, 1997), that is, subjecting number-based data to calculative practices which entail “a progressive reduction of complexity” (Starr, 1980, p. 40) and “enable new ways of acting upon and influencing the actions of individuals” (Miller, 2001 p. 379). All in all, different strands of literature indicate that the relationship between the world of people and their behaviours, and big data produced out of these is one of reduction, or reductive repre-sentation through a series of mechanisms of production, rather than a simple equivalence.
Twenty-Sixth European Conference on Information Systems (ECIS2018), Portsmouth, UK, 2018 3 ‘Business analytics’, ‘business intelligence’ and ‘big data’ are often used interchangeably (Holsapple et al., 2014). In broad terms, they identify analytics as applications, technologies, and processes for gathering, storing, accessing, and analysing data to help business users make better decisions (Watson, 2009). Indeed, the emphasis on improved decision making through analytics is a common thread in literature; studies of the aims of big data analytics deployments point to the capacities to evaluate rich data sources, identify patterns within them and use them in decision making (Chaudhuri, Dayal and Narasayya, 2011). In conjunction with existing IT systems, big data analytics allows for synthesizing “vast amount of data into powerful decision making capabilities” (Baker, 2007, p. 2), and a growing body of literature points towards the capacity of analytics to enable data assessment and measurement for the purposes of performance appraisal and improvement (e.g. Norris, Baer and Offerman, 2009; boyd and Crawford, 2012), which are particularly relevant to higher education institutions.
We refer to all such analytics as big data analytics and further focus on a subfield known as learning analytics (Clow, 2014; Selwyn, 2015), that is “the measurement, collection, analysis, and reporting of data about learners and their contexts, for the purposes of understanding and optimizing learning and the environments in which it occurs” (Siemens, 2013, p. 1328). The link between learning analytics and big data analytics is asserted within the learning analytics literature itself, identifying it as a sub-field of business intelligence (Goldstein and Katz, 2005; Clow, 2014; Papamitsiou and Economides, 2014; Selwyn, 2015) or business analytics (Daniel, 2017). Learning analytics not only exemplifies epistemological issues related to big data but it also allows us to study big data analytics in a setting that is highly informed and, hence, potentially reflexive about the issues of big data, that is, university-level business education.
2.2
Learning analytics
The practice of learning analytics (LA) evolved around two main technological trends in education: the adoption of virtual learning environments (VLEs) and, consequently, the increased availability of behavioural data from VLEs (Macfadyen and Dawson, 2010). Off-the-shelf VLEs, such as Moodle or BlackBoard, come with built-in tracking functions while custom-made systems are also typically equipped with similar features (Romero et al., 2008). VLEs track behaviour such as reading and writ-ing of resources, takwrit-ing tests, performwrit-ing tasks or communicatwrit-ing with peers (Mostow et al., 2005) in the form of time-stamped clicks. The data can then be combined with information about users’ pro-files, academic results and interaction data for analytical purposes (Romero et al., 2008).
The idea behind LA is that using tracking data from VLEs is a potent way of measuring educational progress, and closely related to how students learn and perform (e.g. Daniel, 2015; Siemens, 2013; Yu & Jo, 2014). Typically, practitioners try collect as much data as possible, to gather “any data [they] can get their hands on” (Jones, 2015, p. 186) as “data mining is not a separate act to normal user be-haviour [therefore] the information retrieved is also highly authentic in terms of reflecting real and uninterrupted user behaviour” (Greller and Drachsler, 2012, p. 42). The collected data are then sub-jected to a range of pre-processing and aggregation tasks and, ultimately, analytics not unlike ap-proaches seen in the wider field of business analytics including prediction, clustering, relationship mining, or discovery with models (Baker & Yacef, 2009; Romero et al., 2008). Typical LA goals in-clude understanding the data associated with activities and behaviours in VLEs that can be associated with effective learning, which could then lead to better feedback and assessment, as well as improved capacity for interventions (Macfadyen et al., 2014). Among the most frequent uses of LA according to literature are student behaviour modelling, prediction of performance, attrition risk detection and re-tention, improved feedback, recommendation of resources (Papamitsiou and Economides, 2014), data visualization, course recommendation (Sin & Muthu 2015), and other more specialised uses.
However, LA researchers have struggled to identify statistically significant and theoretically robust correlations (e.g. Clow, 2014; Ruipérez-Valiente et al., 2015), stating that “it remains an on-going challenge to formulate indicators from the available datasets that bear relevance for the evaluation of the learning process” (Greller and Drachsler, 2012, p. 49) and conceding that VLE data are often a poor proxy for learning (Tempelaar et al., 2015). Critical studies, mostly in education and pedagogy,
Twenty-Sixth European Conference on Information Systems (ECIS2018), Portsmouth, UK, 2018 4 have begun to echo concerns around the reductionist nature of data that feed LA systems, as well as the mechanisms involved in data production. For example, it has been suggested that data-intensive approaches place disproportionate attention on things that are easy to count (Reyes, 2015; Selwyn, 2015). It is equally important, as researchers argue, to keep in mind what is not being measured and how these omissions impact LA results (e.g. Reyes, 2015; Selwyn, 2015; Wise, 2014). In short, there is a risk that naïve use of data become the primary means of abstraction of education (Thompson, 2017) and contribute to its reduction at high speed (Thompson and Cook, 2017). Some researchers feel that the new paradigm is reconfiguring the sense of education (Thompson & Cook, 2017).
3
Theoretical framework
The theory of reactivity was developed through Espeland and Sauder’s seminal study of law school rankings (2007). Since then, the idea of reactivity has been deployed to study the rankings of other educational institutions (Bowman and Bastedo, 2010; Goglio, 2016; Hazelkorn, 2011), including busi-ness schools (Willmott, 2011), corporate reputation rankings (Sekou Bermiss et al., 2014), and valua-tion online (Orlikowski and Scott, 2014; Jeacle and Carter, 2011).
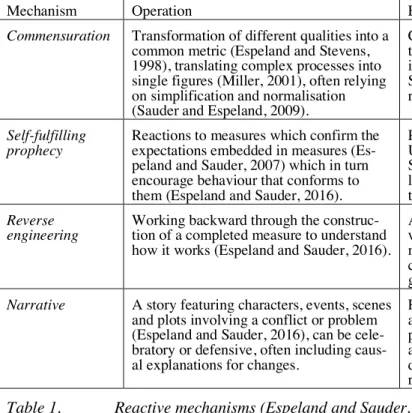
Espeland and Sauder (2007) propose that all measurement can lead to reactivity: individuals altering their behaviour in reaction to being evaluated, observed or measured. Reactivity affects the behaviour and actions of measurement subjects, limiting the methodological validity of measurements underpin-ning whatever analytical techniques are then applied with the data (Espeland and Sauder, 2007). Rank-ings in their view become conduits or instruments that give rise to reactivity. The authors do not ques-tion the power or utility of reductive representaques-tions afforded by rankings, yet they are primarily inter-ested in the way rankings become reactive, that is feed back into the schools they are supposed to (on-ly) rank in terms of underlying educational quality. Placed outside of organisations they rank, carrying out “surveillance from a distance” (Sauder and Espeland, 2009, p. 71), rankings impact organisations by four mechanisms: commensuration, self-fulfilling prophecies, reverse engineering, and narratives. The mechanisms and typical effects are summarised in Table 1.
Mechanism Operation Effects
Commensuration Transformation of different qualities into a common metric (Espeland and Stevens, 1998), translating complex processes into single figures (Miller, 2001), often relying on simplification and normalisation (Sauder and Espeland, 2009).
Changing locus of attention by altering rela-tionships (Espeland and Stevens, 1998), creat-ing visibility and invisibility (Espeland and Stevens, 1998), leading to re-allocation of resources, change of values.
Self-fulfilling
prophecy Reactions to measures which confirm the expectations embedded in measures (Es-peland and Sauder, 2007) which in turn encourage behaviour that conforms to them (Espeland and Sauder, 2016).
Performing to a measure as seen in the case of US law schools (Espeland and Sauder, 2007; Sauder and Lancaster, 2006; Stake, 2006), leading to gaming, redefining work and prac-tices.
Reverse
engineering Working backward through the construc-tion of a completed measure to understand how it works (Espeland and Sauder, 2016).
Actors stop thinking about the institution as a whole, but rather as a collection of discrete, measurable units whose functioning can be changed according to the formula, leading to gaming, redefining work and practices. Narrative A story featuring characters, events, scenes
and plots involving a conflict or problem (Espeland and Sauder, 2016), can be cele-bratory or defensive, often including caus-al explanations for changes.
Repeated at various levels of seniority and across many functions, narratives become powerful vehicles of identity and influence actions and behaviours in line with the pre-dominant narrative, leading to re-allocation of resources, redefining work and practices.
Twenty-Sixth European Conference on Information Systems (ECIS2018), Portsmouth, UK, 2018 5 The four mechanisms described in Table 1 offer a promising starting point to develop an understand-ing of feedback mechanisms in big data analytics albeit we expect the mechanisms to operate differ-ently in other contexts. By applying the theory to the study of big data analytics in a higher education institution, we are hoping to confirm whether similar mechanisms that are typical of rankings and oth-er means of valuation also appear and drive reactivity in big data analytics. In their work, Espeland and Sauder (2016) investigate the effects of reactivity within law schools arguing and exemplifying at lengths that reactive mechanisms lead to, for example, re-allocation of resources, redefining work and practices, gaming and change of values. Detecting such reactive effects in the context our study is an important first step towards the identification of the mechanisms of reactivity.
4
Methods
4.1
Context
The School is an internationally recognized and highly ranked business school in the world with under 10,000 students in several undergraduate and postgraduate courses and around 320 members of staff. Some of the most prestigious courses offered by the School include the MBA, Executive MBA and a Distance Learning MBA. Under different names and in varying forms in the past, its MBA pro-grammes have been on offer since around 1970s. The School has a strong internal software develop-ment team that develops and maintains a custom Virtual Learning Environdevelop-ment (VLE). Features are added and redesigned to the VLE in a fairly agile and demand-driven way, resulting in significant tem releases and upgrades through the academic year. In order to oversee the development of the sys-tem, a strategic committee with representatives from different staff groups manages demand for the services of the development team and oversees projects.
The strategic committee noted and approved a project for “Enhanced Support for DL [distance learn-ing] Tutors” in 2012, and in 2013 to introduce “Monitoring Lesson Understanding and Tracking Pro-gress” within the VLE, which include the first mention of engagement analytics that later on evolved into more generic learning analytics solution. The motivation for these projects was linked to the duty-of-care towards DLMBA students to help focus the tutorial support resource and improve student re-tention and progression leading to higher revenues for the School. The first project was subsequently superseded in 2014 by “Student and Tutor Monitoring for Online Modules” and, along with it, the en-gagement analytics function went into development. Enen-gagement analytics were first deployed in a small, private online course in finance and showcased to the wider community during a tutor away day for distance learning staff, at which point “it was felt that this technology would be well used in dis-tance learning and was enthusiastically welcomed by the tutors”, as noted in the minutes from the stra-tegic committee meeting. The engagement analytics function did not undergo significant changes or development since it went live, but has been increasingly used at the School. Several short presenta-tions and workshops around this functionality were offered by the development team, but most of the adoption is led by word-of-mouth and hands-on discovery. Most interviewees have either learned about this function from the tutor away day, a short presentation by the development team to their par-ticular group, or by chance, “clicking around” or “stumbling upon it” when looking for something else.
At the time of our study, the VLE offered a range of engagement analytics features, including the ag-gregate number of views per resource, named student view per resource, date and time viewing statis-tics (called “usage statisstatis-tics”), individual student and staff progress per lesson and module, number of comments by students and staff, aggregation of data into student quartiles, and aggregate data per teaching week. These are available to the teaching module leader and staff involved in the overall planning and delivery of programmes. Other analytics available in the system included student as-sessment grade, aggregated grades in previous years and cohorts with mean and median. These en-gagement analytics were visible in general to most tutors enrolled as teaching on a particular module. Students can see their self-declared progress using check boxes and in some MBA modules are dis-played the ranking of the student within their year or cohort.
Twenty-Sixth European Conference on Information Systems (ECIS2018), Portsmouth, UK, 2018 6
4.2
Case study design
We conducted a qualitative study to uncover reactive mechanisms and effects of big data analytics by applying a single case research design (Yin, 1994). The approach entails collecting rich evidence that enables intensive, contextual understanding of the phenomenon (Flyvbjerg, 2006). The case selection was guided by several factors. First, the case of learning analytics opens up difficult epistemological issues involved in the use of analytics, thus providing a fruitful ground for the discussion not only of the topic of this project, but also of the nature of learning. Second, as outlined in background research above, previous LA research that provides interesting problematisations of the broader phenomenon of big data analytics. Third, a university setting enables access to motivated and interested informants who should also be well-informed in the aspects of learning analytics.
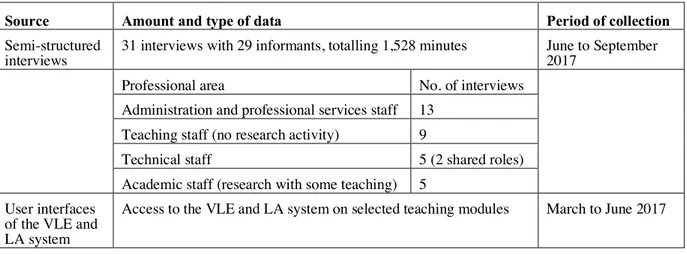
Source Amount and type of data Period of collection Semi-structured
interviews 31 interviews with 29 informants, totalling 1,528 minutes June to September 2017 Professional area No. of interviews
Administration and professional services staff 13 Teaching staff (no research activity) 9
Technical staff 5 (2 shared roles) Academic staff (research with some teaching) 5
User interfaces of the VLE and LA system
Access to the VLE and LA system on selected teaching modules March to June 2017
Table 2. Summary of data sources
Relying on snowball sampling, between June and September 2017 we carried out 31 semi-structured interviews with 29 members of academic, teaching, administrative and systems development staff at various levels of seniority to understand how LA is used, what effects it generates and what reactive mechanisms can be found at play. The interviewees included Assistant and Associate Professors, Teaching Fellows, Senior Teaching Fellows and Professorial Fellows, Operations Directors, Pro-grammes Managers, Assistant Registrars, Administrative officers, Teaching and Learning Consultants and Technology Utilisation Consultants, Technology Integrators, and Information Systems Consult-ants. The interviews lasted on average 49 minutes, with the shortest one lasting for 24 minutes, and the longest one for 85 minutes. In the interviews, we asked about the use and experience of the VLE and specifically about the use of data collected and made visible in the LA system, for example by enquir-ing how different interviewees use this data, whether they experienced any problems or issues with it, and whether they have noticed any changes since the system has been rolled out at the institution. In the interviews, we are effectively observing perceptions of analytics of the different parties, which are not necessarily the same as actual behaviour. However, perceptions inform people’s understanding of behaviours and also shape the behaviours themselves especially as it comes to reactivity (Espeland and Sauder, 2016).
The interviews were transcribed and coded by one of the authors using a theoretically-derived coding scheme to identify issues of reactivity at the research site. Following our survey of Learning Analytics literature outlined above, we created a set of codes for the intended uses of LA, and the theory of reac-tivity was relied upon to derive codes for the mechanisms and effects of reacreac-tivity at play, while we remained open to potential new mechanisms emerging. This resulted in creating codes derived directly from the theory of reactivity, thus we coded the data for reallocation of resources, redefining work and practices, gaming and change of values, as well as the mechanisms, including self-fulfilling prophe-cies, commensuration and reverse engineering.
Twenty-Sixth European Conference on Information Systems (ECIS2018), Portsmouth, UK, 2018 7 We selectively complemented the interview data with the analysis of documentary evidence from IT strategy meetings minutes and, in particular, the analysis of user interfaces of the learning platform and its analytics system, for example to trace the development of narratives around the system and contextualise our understanding of the LA system. While aiming to generalise our findings back to the theory, we have thus ensured strong construct validity through the use of multiple source of evidence, as well as reliability by maintaining a case study database (Yin, 1994).
5
Findings
5.1
Uses of learning analytics
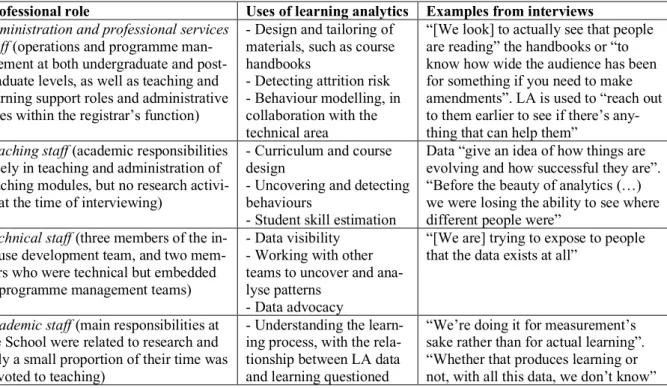
We are particularly interested in understanding how different groups use and perceive the LA compo-nent of the VLE at the School, and this interest also guided our questions in the semi-structured inter-views. When analysing our data, we coded the interviews for most common uses of LA as identified in the literature. We cluster the findings [in Table 3] in this section around users and their most common activities.
Professional role Uses of learning analytics Examples from interviews Administration and professional services
staff (operations and programme man-agement at both undergraduate and post-graduate levels, as well as teaching and learning support roles and administrative roles within the registrar’s function)
- Design and tailoring of materials, such as course handbooks
- Detecting attrition risk - Behaviour modelling, in collaboration with the technical area
“[We look] to actually see that people are reading” the handbooks or “to know how wide the audience has been for something if you need to make amendments”. LA is used to “reach out to them earlier to see if there’s any-thing that can help them”
Teaching staff (academic responsibilities solely in teaching and administration of teaching modules, but no research activi-ty at the time of interviewing)
- Curriculum and course design
- Uncovering and detecting behaviours
- Student skill estimation
Data “give an idea of how things are evolving and how successful they are”. “Before the beauty of analytics (…) we were losing the ability to see where different people were”
Technical staff (three members of the in-house development team, and two mem-bers who were technical but embedded in programme management teams)
- Data visibility - Working with other teams to uncover and ana-lyse patterns
- Data advocacy
“[We are] trying to expose to people that the data exists at all”
Academic staff (main responsibilities at the School were related to research and only a small proportion of their time was devoted to teaching)
- Understanding the learn-ing process, with the rela-tionship between LA data and learning questioned
“We’re doing it for measurement’s sake rather than for actual learning”. “Whether that produces learning or not, with all this data, we don’t know”
Table 3. Summary uses of LA data by administrative, teaching, technical and academic staff
The brief summary of the uses of LA presented in Table 3 is by-and-large in line with what the LA literature posits about the purpose in which data can be put. LA has an impact on its users across the School and, as such, our case can be understood to offer a rich representation of LA in practice.
5.2
Reactive effects of learning analytics
In the preceding section, we have briefly identified the uses of LA at the research site which are con-gruent with extant literature and they way practices are described. In this section, we discuss the ef-fects of learning analytics present in our interviews.
5.2.1 Redefining work and practices
One of the most prevalent effects of the introduction of LA which was not intended or planned was the fact that LA data led to changes in work and working practices, as already suggested by more critical
Twenty-Sixth European Conference on Information Systems (ECIS2018), Portsmouth, UK, 2018 8 researchers of education. For example some teaching staff perceived that “it [LA] detracts from the job of educating” and introduces a host of new data-related activities which may take away time they would otherwise spend teaching or interacting with students. Importantly, a number of our interview-ees have experienced what they called “the move towards e-learning”, that is an impression or encour-agement that e-learning elements should be introduced even in face-to-face teaching in classrooms, in the form of online activities or teaching weeks conducted entirely online.
Although curriculum and course redesign has been identified as main uses of LA, several of our inter-viewees pointed out that this can also lead to some less positive effects, such as “teaching then comes completely oriented around ‘well, I need to make sure that the materials are really exciting be-cause they’re going to rate me on that’”. Some of our interviewees expressed a concern that as a result of the LA data, they may have to restructure their materials and practices towards what causes students to “engage more”, that is to what generates more views, comments, and clicks, rather than towards what is intellectually more challenging and stimulating.
5.2.2 Resource re-allocation
Resources are re-allocated as a result of LA, especially regarding the use of tutors. On some distance learning courses, LA is used to decide whose contracts should be extended or terminated if tutors do not correspond to enough views or comments in the system: “if I look at the online tracking of staff engagement and people are repeatedly not doing what they’re supposed to be doing, they’ll be on the blacklist and they won’t have the contract renewed; it’s a really cut and dried thing”. Likewise, some members of staff we interviewed use the LA data to “get a bigger team through using those stats to prove that there’s a lot of need for more people to interact with the students that are posting those posts”.
Relatedly, it has been pointed out that “changes have become measurable and this is why more power and more investment has gone into non-faculty”. To quantify that, as an example, the teaching and learning support team has grown from a team of four initially to 17 members of staff when the study was conducted, and “we’ve got a dean of pedagogy now, so there’s a whole kind of structure in there now to support teaching because I think that the data is saying that this is what we need”. The School has also created a new post related to student satisfaction and engagement which has monitoring LA data in its job specification.
5.2.3 Change of values
Many of our interviewees pointed towards the increasing value and importance attached to student feedback, as “it has made us collect other sorts of feedback almost obsessively” and that LA data has gained more prominence and importance, especially in the light of suggestions from the wider sector that it could be incorporated into the Teaching Excellence Framework1 scores. Shortly before our
study, a new system allowing students to give feedback on the feedback they received was introduced as part of “more emphasis on teaching and teaching evaluations”. It has been suggested that it is relat-ed to changes in what students expect as “what they want now is just to do with power, power of da-ta”. Another interviewee pointed out that “people are feeling more and more that they’re being judged by these young person’s statistics”. Further, the emphasis on employing teaching fellows certain teaching roles was linked to what LA point towards as “we employ teaching fellows because they have that focus on teaching rather than being research-focused”.
It was also pointed out that there has been to some extent a move away from “treating them [students] like an adult learner” to “hand holding to the extreme”. Some interviewees suggested that they have experienced a significant move away from allowing students to look for things, develop research
1 Teaching Excellence Framework, commonly known as TEF, is a sector-wide assessment of teaching quality in higher
Twenty-Sixth European Conference on Information Systems (ECIS2018), Portsmouth, UK, 2018 9 skills, and critically analyse large amounts of material towards making material available on the VLE in bite-sized chunks, which they suggested was a result of LA data suggesting that students are less likely to click on longer videos or reading materials. Relatedly, a number of interviewees pointed out an increasing value of student interaction and a push towards building interactive components into their courses. This has been linked to the fact that interaction on the VLE generates data and therefore provides a form of a measurement which can be made useful for other purposes, as opposed to stu-dents interacting offline where their activities cannot be measured.
5.2.4 Gaming the analytics
The fact that LA could be gamed was present in several interviews. Our interviewees were concerned and sometimes perceived that students would “just click on everything, (…) play the system, if stu-dents think ‘I need to look as if I’m busy and engaging’, then they’ll play the system”. As one inter-viewee suggested, “people who actually previously didn’t bother to do that, will use a little of their valuable time which could be actually spent getting an education, they’ll actually use that time to play the game”. While the link to data, LA and gaming is made explicit, gaming remains a worry in the way LA is used at the School: “it’s not really indicating that they’ve probably completed that page, it’s indicating that oh, I’d better do this otherwise the programme team will get on to me”. Similar thoughts were expressed by several interviewees who showed limited trust towards LA as students “might be literally clicking on it and not engaging with it and just scrolling very quickly through” and that they may think “they have to do it to be seen to have completed everything”.
LA played a role in reputation and impression management, especially in modules where there is a mark allocated for student participation. A link between LA data and reputation has been established by a few of our interviewees: “on some courses that emphasis on reputation is in fact built into the way the courses work so your online presence and all of your activity forms are taken in a quite pow-erful way”. Indeed, one of our interviewees confessed that “two minutes after you’ve posted some-thing she’s always looked at everysome-thing first. […] I do have a positive impression of her as a result of that even though she’s relatively quiet in class, just because she seems super on it and interested”. However, it is not only students who might do it consciously, but our interviewees pointed out that members of staff may engage in reputation management as “it’s pretty critical for our external online tutors to be representing themselves well at the moment because it’s a matter of are we going to renew our contract or not” and that the system relies on “quantifying the tutor engagement”.
5.3
Identifying the mechanisms of reactivity
The theory of reactivity stipulates the existence of a set of mechanisms leading to the effects identified above. Drawing from critical realism (Bhaskar, 1978; Archer and Bhaskar, 1998), and especially the DREI framework as applied in information systems research (Mingers et al., 2013), we posit that through the description of effects above, we can carry out the retroductive analysis to identify whether mechanisms similar to Espeland and Sauder’s studies are also present in our case. Below we present our findings pointing towards the mechanisms of commensuration, self-fulfilling prophecy, reverse engineering and narratives in our study.
5.3.1 Commensuration
Commensuration means the transformation of different qualities into a common metric, which is at the very foundation of the learning analytics. The idea is that complex, diverse learning processes can be encoded, or commensurated, through a set of simple actions such as a ‘view’ or ‘comment’ in the online environment. Various (but not all) interviewees implicitly assume that there is such a direct link, and data in the system corresponds, at least in some sense, to learning. For example, using the LA data to decide who will get a participation certificate from a module relies on the assumption that clicking on the VLE equals participating, or doing the job. In this instance, the qualitatively different, individual processes of learning become commensurated through a narrow set of data points and along pre-established paths. Some members of staff admitted that since the directions from the School were
Twenty-Sixth European Conference on Information Systems (ECIS2018), Portsmouth, UK, 2018 10 to increase student interaction, they have built in mechanisms forcing students to interact online as much as possible which sometimes may mean that interaction quality will drop, but LA will show higher numbers of clicks and views (“we get the data and then we get diverted into just pursuing the data instead of focusing on the goal”). Relatedly, since some staff now just look at the summary of the number of comments made by other staff as part of their job, a concern was expressed that this may mean that the average quality of comments will drop for the sake of their number. As pointed out above, some interviewees have also admitted that they would build their impression of students based on their LA data, commensurating the meaning of a good student to a student with a high number of clicks and views in the LA system.
Commensuration in our case can be identified as a mechanism leading to the re-allocation of resources to obtain more data, equated with more interaction and engagement, as well as a change in values from the depth and analysis to numbers.
5.3.2 Self-fulfilling prophecy
Self-fulfilling prophecies were not as clearly identifiable as for example commensuration mechanisms, yet we have come across some concerns of our interviewees responsible for the development and im-plementation of the system that reactions to measures may confirm the expectations embedded in measures. For example, one of the struggles an interviewee faced was related to revealing LA output to students: “I don’t know how students feel when it’s like you were 99th out of 100. I don’t know if
that could be negative and whether we’ve got the support then to back it up if the student who has a bad reaction to data because data’s not neutral”, which is hinting at a potential self-fulfilling prophecy mechanism in work. Further, it has been suggested that it is possible to fall for thinking that “a student hasn’t opened six of ten lecture materials, [I’ll think] lazy student, I’m not going to help them, that might be the student who needs the most help”, again potentially symptomatic of self-fulfilling proph-ecies. The mechanism of self-fulfilling prophecies can lead to changes in what is valued, as well as to redefining of practices, as discussed above.
5.3.3 Reverse engineering
Reverse engineering, that is working backward through the construction of a completed measure to understand how it works, often with the aim of trying to influence the measure regardless of the under-lying quality it is supposed to measure, has been present throughout and can be identified in a number of instances in our study.
The concern about reverse engineering related to LA has been expressed well by one of our interview-ees: “’I want to do well, I want to get a first. I’d put more work into these or I’ll set…’ you know, they’ll set themselves up in a way [while] one of the virtues of the degree is that it is a sort of very rounded measure of accomplishments, but the moment we start giving really quite high-resolution da-ta…”, exemplifying the fact that students may then lose focus from the degree and its value and start studying to the data. A similar idea was expressed by another interviewee who stated “the more we add data analytics […] the more we’re instrumentalising their understanding of learning, you know, it’s a box to tick, it isn’t a concept or an idea to engage with, to understand, it’s a ‘what do I need to do to get my 2:1 at the end of it and this is going to help me’”. However, it is also interesting to note how staff themselves plan to increase the amounts of LA data on their modules by reverse engineering stu-dent activity and motivating stustu-dents to get onto the platform: “we’ll be giving certificates out to peo-ple who achieved compeo-pletion of at least 75% and suddenly […] all the numbers were like ‘vroom’”. Similarly, staff would reach out to students showing as low activity on the system to get their activity higher, or even display LA statistics in lecture rooms to encourage students to view and comment more frequently. These interventions are symptomatic of thinking how the LA data can show more interaction and engagement, and taking appropriate steps aimed at increasing the numbers in the LA system, which is a clear example of reverse engineering.
Quite strikingly reverse engineering can be identified as a mechanism leading to gaming and redefin-ing of practices.
Twenty-Sixth European Conference on Information Systems (ECIS2018), Portsmouth, UK, 2018 11
5.3.4 Narratives
Narratives are repeatedly told stories providing causal explanations for changes, which were perhaps the most clearly visible mechanism of reactivity in our study. Out of a number of narratives that emerged through the interviews, the narrative of student engagement was the most prevalent one, re-peated across different levels of seniority and professional roles. Student engagement as a goal was posited as the main explanation for why LA was implemented and why these data had to be used. The LA project itself was frequently referred to among senior stakeholders on the committee as “engage-ment analytics”. The narrative constructed around engage“engage-ment and the need to measure it justified the use of LA across the school. It has been emphasised on a few occasions that the School has “a duty of care around engagement”. The emphasis has also shifted towards the idea of “continuous engage-ment”, that is designing continuous activities for students to get “much, much smaller bits of data” than just their end-term outcomes. Keeping students engaged became the modus operandi and the goal of course redesign activities, for example with the structure of the DLMBA changed to introduce gated content forcing students to work on certain activities to access further materials on the modules: “so engagement is the big issue really of trying to help, particularly with this new structure of the course, it’s going to be much less forgiving of not getting going with it and not engaging”. The same narrative is perhaps what has driven the School to create a new post during our study which was explicitly relat-ed to engagement: Student Experience and Engagement Manager, with one of the role’s focuses on using the LA data to improve engagement.
The narrative of engagement and the role of LA data as the best mechanism to capture it can be identi-fied as a mechanism behind changes in values, reallocation of resources, and redefining practices.
6
Discussion
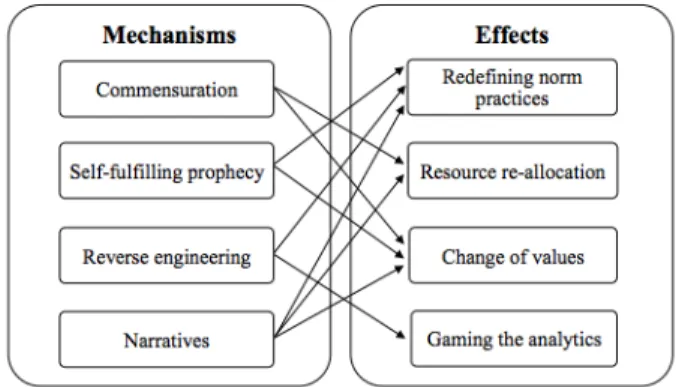
Our aim in this paper was to demonstrate and study the applicability of the theory of reactivity to un-derstanding learning analytics and, by implication, big data analytics. Toward this end, we have identi-fied a broad spectrum of uses and effects of learning analytics at the research site, but also some emer-gent effects not foreseen in the literature that will be briefly discussed below. We further retroduced a number of potential mechanisms that, we claim, would account for reactive effects. The findings also contribute to how organisations should harness big data analytics in their operations. We specifically found evidence of re-allocation of resources, changes in values, redefining of work and practices, and gaming. Furthermore, these effects would seem to emerge from mechanisms that fit the typology pro-posed by the theory: commensuration, self-fulfilling prophecies, reverse engineering and narratives are at play in our research site and contribute various to the reactive effects as depicted in Figure 1.
Figure 1. Reactive mechanisms and effects
Going back to our research question, the perceptions of informant strongly suggest that learning ana-lytics feeds into the phenomena it purports to describe by way of reactive mechanisms, resulting in unintended changes in the educational setting subject to analytics. This suggests that big data analytics engenders bi-directional rather than unidirectional causality largely assumed in the literature, which call for more in-depth study. Interestingly, in our study we also observed reactive effects which are not
Twenty-Sixth European Conference on Information Systems (ECIS2018), Portsmouth, UK, 2018 12 present in the original theory, yet which would seem to result from similar reactive mechanisms at play: discipline through analytics, standardising through data, and acceleration through data.
First, LA data was used to discipline both students and staff, for example in plagiarism cases where students who claim they have not seen anti-plagiarism regulations could be traced in the system, con-firming they did in fact view pages related to plagiarism. Some members of staff were surprised about the fact that staff behaviour was traced in the system, as “so now they’re able… so is somebody else using this data analytics not to help shape my teaching or the student’s learning, but a managerial tool to evaluate our performance?”. It has been suggested that just the fact that staff activity is monitored, tutors became more compliant, as “so they monitor staff activity because in the past, when it wasn’t monitored, some tutors will literally not do anything”.
Second, as already hinted in the discussion of redefining of work and practices, our interviewees have pointed towards certain standardising effects of the use of LA. As a related effect, “there’s been a huge push to develop a standard template for everybody who teaches, so a template for uploading your ma-terials” on the VLE and some interviewees have pointed out that “having that standard template auto-matically standardizes the data you collect in the background”. Data generation was identified as a potential cause of turning education “very samey”, with one interviewee pointing out “it’s a bit like going to IKEA. You walk into an IKEA, you know exactly what you’re going to get and I think they want students to have that experience with their modules”.
Third, another effect that a number of interviewees have hinted at is the speeding up of various aspects of the academic teaching cycle. Decisions are made quicker, development happens at a faster pace than in the past, changes can be made much more quickly than from one academic year to another. A salient feature of LA is that it provides nearly real-time feedback on how students progress through the VLE material, prompting some of our interviewees to introduce changes in their teaching materials within the same cohort, rather than for the next year: “so it does enable you to have that sort of forma-tive learning experience with the students rather than waiting for that year to end, then it is too late to help them out”. The pace at which the VLE enabled instruction to take place has also led to the idea of “continuous engagement”, as discussed above, which would not have been possible without the LA data in the background.
In our view, it is important to study these emerging effects in more detail, to shed light on the reasons for their occurrence in the big data analytics setting. Also, returning to the original theory of reactivity, school rankings operate externally to the organisations that are being ranked and measured. The reduc-tion of entire institureduc-tions to a few numbers within rankings are performed by external, independent actors. By contrast, big data analytics operates often internally within organisations on top of digital technology designed or appropriated to capture social phenomena as data through the mechanisms of encoding, aggregation, and computation (Alaimo and Kallinikos, 2017). There are important differ-ences in these two contexts that we will discuss briefly.
First, in the context of big data analytics, the devices that generate reactivity are essentially placed within the organisations, invoking powerful disciplinary mechanisms and pointing towards the panop-tic or disciplinary character of such systems (see for example Woodcock, 2017). At the same time, this would at least in principle allow for managerial intervention to steer, cultivate and mitigate reactive effects towards desired outcomes. Simply put, educational institutions may have no other option than bow to the pressure exerted by rankings, yet they can decide how they deploy big data analytics in their operations. Second, in big data analytics the device giving rise to reactive mechanisms and ef-fects is an IT artefact which codifies or encodes specific behaviours by the rule of code (Lessig, 2006), rather than human assessment as in rankings. This can point towards an explanation of the standardis-ing character of learnstandardis-ing analytics and its disciplinary character we have seen emerge. Third, rather than producing ranking numbers, big data analytics encodes behaviours as computable actions within the systems, making them easier and quicker to track. The data are available to be acted upon nearly instantaneously, unlike in the case of rankings that are published at set intervals and with specific de-lays. As a result, big data analytics can produce reactive effects at a much quicker pace than rankings, and while this can be a partial explanation of the speeding up effects we have preliminarily observed,
Twenty-Sixth European Conference on Information Systems (ECIS2018), Portsmouth, UK, 2018 13 it is also important to notice that if reactivity happens quicker, the world that data purports to describe also becomes transformed at a faster rate.
7
Conclusions
Through a qualitative case study, we have applied the theory of reactivity (Espeland and Sauder, 2007) to the context of learning analytics and identified several reactive effects, namely allocation of re-sources, change in values, redefining work and practices, and gaming in the way different employees perceive analytics-related phenomena at the organization. Also, we have identified three further ef-fects, including discipline, standardisation and acceleration not covered by the original theory. We found evidence that commensuration, self-fulfilling prophecy, reverse engineering and narrative mechanism are driving reactive effects in learning analytics at the research site.
The findings suggest that big data analytics can feed into the phenomena it purports to describe, lead-ing to unintended or unplanned changes in organizational phenomena subjected to analytics. If true, this calls for broader perspective and models to capture the role of analytics in organizational change. A positive message of the study is that while reactivity may dilute the methodological power of big data analytics to describe the world for managerial purposes, its reactive effects are probably easier to steer if we understand the mechanisms driving them, than in the context of university rankings that impose external pressure on the whole industry.
The approach we have taken is not free of limitations. The use of interviews entails reliance on obser-vations and experiences reported by the users of the system. While we did complement the interviews with the analysis of the LA system itself, this does not rule out potential bias in the reported experi-ence of its users, and hexperi-ence we propose further, quantitative study of reactive mechanisms and effects using VLE clickstream data. Our study relied on snowball sampling, which may have impacted the findings as well. Finally, we conducted our study at one institution only thus some results may be due to the specificity of the organisation.
In order to further develop our understanding of the recursive character of big data analytics, we sug-gest further qualitative studies in contexts other than learning analytics. This would improve the exter-nal validity of the theoretical contribution put forward in this paper and, most likely, uncover more nuances regarding reactivity in the context of big data analytics. Further, the study of reactivity of big data analytics would benefit from quantitative studies that would identify reactivity through other means than participants’ perceptions. Actors’ perceptions are certainly a valid data point here, for much of reactivity is undoubtedly mediated by actors’ perceptions about big data analytics, yet the idea of reactivity is precisely that such perceptions shape behaviour that should be measurable in one way or the other.
References
Alaimo, C. (2014). “Computational consumption: Social Media and the construction of Digital Consumers.” PhD thesis. London School of Economics and Political Science.
Alaimo, C. & Kallinikos, J. (2017). “Encoding the Everyday: Social Data and its Media Apparatus.” In: Big data is not a monolith: policies, practices, and problems. Ed. by C. Sugimoto, H. Ekbia, & M. Mattiolo, Cambridge, MA: The MIT Press, 77–90.
Anderson, C. (2008) The End of Theory: The Data Deluge Makes the Scientific Method Obsolete. URL: https://www.wired.com/2008/06/pb-theory/. Accessed on: 17/08/2017.
Archer, M. & Bhaskar, R. (1998) Critical Realism: Essential readings, London: Routledge.
Baker, R.S.J.D. & Yacef, K. (2009) “The State of Educational Data Mining in 2009: A Review and Future Visions.” Journal of Educational Data Mining, 1(1), 3–16.
Twenty-Sixth European Conference on Information Systems (ECIS2018), Portsmouth, UK, 2018 14 Bayrak, T. (2015). “A Review of Business Analytics: A Business Enabler or Another Passing Fad.”
World Conference on Technology, Innovation and Entrepreneurship. Procedia – Social and Behav-ioral Sciences, 195, 230–239.
Bhaskar, R. (1978) “On the Possibility of Social Scientific Knowledge and the Limits of Naturalism.”
Journal for the Theory of Social Behavior, 8(1), 1–28.
Bichler, Martin; Heinzl, Armin; and van der Aalst, Wil (2017) “Business Analytics and Data Science: Once Again?” Business & Information Systems Engineering: Vol. 59: Iss. 2, 77–79.
Bowker, G.C. & Star, S.L. (1999) Sorting things out: classification and its consequences, Cambridge: MIT Press.
Bowman, N. A., & Bastedo, M. N. (2009) “Getting on the front page: Organizational reputation, status signals, and the impact of U.S. News and World Report on student decisions.” Research in Higher Education, 50, 415–436.
boyd, D. & Crawford, K. (2012) “Critical Questions for Big Data.” Information, Communication & Society, 15 (December 2013), 662–679.
Chaudhuri, S., Sayal, U., Narasayya, V. (2011) “An Overview of Business Intelligence Technology.”
Communications of the ACM, 54(8), 88–98.
Clow, D. (2014) “Data Wranglers: Human interpreters to help close the feedback loop.” In: Proceed-ings of the Fourth International Conference on Learning Analytics And Knowledge LAK’14, 49– 53.
Constantiou, I. & Kallinikos, J. (2015). “New games, new rules: big data and the changing context of strategy.” Journal of Information Technology, 30(1), 44–57.
Daniel, B. (2015) “Big Data and analytics in higher education: Opportunities and challenges.” British Journal of Educational Technology, 46(5), 904–920.
Daniel, B. (2017) “Overview of Big Data and Analytics in Higher Education.” In: Big Data and Learning Analytics in Higher Education. Current theory and practice.”. Ed. By B. Daniel. Cham: Springer, 1–6.
Ekbia, H., Mattioli, M., Kouper, I., Arave, G., Ghazinejad, A., Bowman, T., Suri, V. R., Tsou, A., Weingart, S. & Sugimoto, C. R. (2015) “Big data, bigger dilemmas: A critical review.” Journal of the Association for Information Science and Technology, 66(8), 1523–1545.
Espeland, W.N. & Sauder, M. (2007) “Rankings and Reactivity: How Public Measures Recreate Social Worlds.” American Journal of Sociology, 113(1), 1–40.
Espeland, W. N. & Sauder, M. (2016) Engines of Anxiety: Academic Rankings, Reputation, and Accountability, New York: Russel Sage Foundation.
Espeland, W.N. & Stevens, M.L. (1998) “Commensuration as a Social Process.” Annual Review of Sociology, 24, 313–343.
Flyvbjerg, B. (2006) “Five Misunderstandings About Case-Study Research.” Qualitative Inquiry, 12(4), 219–245.
Fourcade, M. & Healy, K. (2013) “Classification situations: Life-chances in the neoliberal era.”
Accounting, Organizations and Society, 38(8), 559–572.
Galloway, A. (2011) “Are Some Things Unrepresentable?” Theory, Culture & Society, 28(7–8), 85– 102.
Goglio, V. (2016) “One size fits all? A different perspective on university rankings.” Journal of High-er Education Policy and Management, 38:2, 212–226.
Goldstein, P. & Katz, R. (2005) “Academic Analytics: The Uses of Management Information and Technology in Higher Education - Key Findings.” Educase Center for Analysis and Research, December 2005.
Gregg, M. (2015) “Inside the Data Spectacle.” Television & New Media, 16(1), 37–51.
Greller, W. & Drachsler, H. (2012) “Translating learning into numbers: A generic framework for learning analytics.” Educational Technology and Society, 15(3), 42–57.
Hazelkorn, E. (2011) Rankings and the Reshaping of Higher Education. The Battle for World-Class Excellence, London: Palgrave Macmillan.
Twenty-Sixth European Conference on Information Systems (ECIS2018), Portsmouth, UK, 2018 15 Holsapple, C., Lee-Post, A., Pakath, R. (2014) “A unified foundation for business analytics.” Decision
Support Systems, 64, 131–141.
Iliadis, A. & Russo, F. (2016) “Critical data studies: An introduction.” Big Data & Society, 3(2), 1–7. Ittmann, H. (2015). “The impact of big data and business analytics on supply chain management.”
Journal of Transport and Supply Chain Management, 9:1, 1–9.
Jeacle, I. & Carter, C. (2011) “In TripAdvisor we trust: Rankings, calculative regimes and abstract systems.” Accounting, Organizations and Society, 36, 293–309.
Jones, K.M.L. (2015) All the data we can get: A contextual study of learning analytics and student privacy. PhD thesis. University of Wisconsin-Madison.
Kennedy, H., Poell, T. & van Dijck, J. (2015) “Data and agency.” Big Data & Society, 2(2), 1–7. Kitchin, R. (2014) Data devolution. Big data, open data, data infrastructures & their consequences,
London: Sage.
Kitchin, R. & McArdle, G. (2016) “What makes Big Data, Big Data? Exploring the ontological characteristics of 26 datasets.” Big Data & Society, 3(1), 1–10.
Lessig, L. (2006) Code 2.0. New York: Basic Books.
Macfadyen, L.P., Dawson S., Pardo, A. & Gašević, D. (2014) “Embracing Big Data in Complex Edu-cational Systems: The Learning Analytics Imperative and the Policy Challenge.” Research & Prac-tice in Assessment, 9, 17–29.
Miller, P. (2001) “Governing by Numbers: Why Calculative Practices Matter.” Social Research, 68(2), 379–396.
Mingers, J., Mutch, A. & Willcocks, L. (2013) “Critical Realism in Information Systems Research.”
MIS Quarterly, 37(3), 795–802.
Mostow, J., Beck, J., Cen, H. Cuneo, A., Gouvea, E. & Heiner, C. (2005) “An Educational Data Min-ing Tool to Browse Tutor-Student Interactions: Time Will Tell!” Proceedings of the Workshop on Educational Data Mining (2005), 15–22.
Norris, D., Baer, L. & Offerman, M. (2009) “A national agenda for action analytics”. In: National Symposium on Action Analytics, St. Paul, MN. URL: http://www.gilfuseducation.com/wp-content/uploads/SettingaNationalAgendaforActionAnalytics101509.pdf (visited on 07/10/2017). Orlikowski, J. & Scott, S. V. (2014) “What Happens When Evaluation Goes Online? Exploring
Appa-ratuses of Valuation in the Travel Sector.” Organization Science 25(3), 868–891.
Papamitsiou, Z., & Economides, A. (2014) “Learning Analytics and Educational Data Mining in Prac-tice: A Systematic Literature Review of Empirical Evidence.” Educational Technology & Society, 17 (4), 49–64.
Power, M. (1997) The audit society: Rituals of verification, Oxford: Oxford University Press.
Puschmann, C. & Burgess, J. (2014) “Metaphors of Big Data.” International Journal of Communication, 8, 1690–1709.
Reyes, B.J.A. (2015) “The skinny on big data in education: Learning analytics simplified.”
TechTrends, 59(2), 75–80.
Romero, C., Ventura, S. & García, E. (2008) “Data mining in course management systems: Moodle case study and tutorial.” Computers and Education, 51(1), 368–384.
Rosenberg, D. (2013) “Data before the Fact.” In:“Raw Data” is an Oxymoron. Ed by L. Gitelman. Cambridge: MIT Press, 15–40.
Ruipérez-Valiente, J.A., Muñoz-Merino, P., Leony, D., Delgado Kloos, C. (2015) “ALAS-KA: A learning analytics extension for better understanding the learning process in the Khan Academy platform.” Computers in Human Behavior, 47, 139–148.
Ruppert, E. (2012) “The Governmental Topologies of Database Devices.” Theory, Culture & Society, 29(4/5), 116–136.
Sauder, M. & Espeland, W.N. (2009) “The Discipline of Rankings: Tight Coupling and Organizational Change.” American Sociological Review, 74, 63–82.
Sauder, M. & Lancaster, R. (2006) “Do Rankings Matter? The Effects of U.S. News & World Report Rankings on the Admissions Process of Law Schools.” Law & Society Review, 40(1), 105–134.
Twenty-Sixth European Conference on Information Systems (ECIS2018), Portsmouth, UK, 2018 16 Sekou Bermiss, Y., Zajac, E., King, B. G. (2014) “Under Construction: How Commensuration and Management Fashion Affect Corporate Reputation Rankings.” Organization Science, 25(2), 591– 608.
Selwyn, N. (2015) “Data entry: towards the critical study of digital data and education.” Learning, Media and Technology, 40(1), 64–82.
Siemens, G. (2013) “Learning Analytics: The Emergence of a Discipline.” American Behavioral Scientist, 57(10), 1380–1400.
Sin, K. & Muthu, L. (2015) “Application of big data in education data mining and learning analytics – a literature review.” ICTACT Journal on Soft Computing, 5(4), 1035–1049.
Stake, J.E. (2006) “The Interplay Between Law School Rankings, Reputations, and Resource Allocation: Ways Rankings Mislead.” Indiana Law Journal, 81, 229–270.
Starr, P. (1980) “The Sociology of Official Statistics.” In: . The politics of numbers. Ed by. W. Alonso & P. Starr. New York: Russell Sage Foundation, 7–58.
Tempelaar, D.T., Rienties, B. & Giesbers, B. (2015) “In search for the most informative data for feed-back generation: Learning analytics in a data-rich context.” Computers in Human Behavior, 47, 157–167.
Thompson, G. (2017) “Computer adaptive testing, big data and algorithmic approaches to education.”
British Journal of Sociology of Education, 38(6), 827–840.
Thompson, G. & Cook, I. (2017) “The logic of data-sense: thinking through Learning Personalisa-tion.” Discourse: Studies in the Cultural Politics of Education, 38(5), 740–754.
van der Vlist, F. (2016) “Accounting for the social: Investigating commensuration and Big Data practices at Facebook.” Big Data & Society, January-Ju, 1–16.
Watson, H. J. (2009) “Tutorial: business intelligence past, present, and future”. Communications of the Association for Information Systems, 25(1), 487–510.
Willmott, H. (2011) “Journal list fetishism and the perversion of scholarship: reactivity and the ABS list.” Organization, 18(4), 429–442.
Wise, A.F. (2014) “Designing pedagogical interventions to support student use of learning analytics.” In: Proceedings of the Fourth International Conference on Learning Analytics And Knowledge - LAK ’14, 203–211.
Woodcock, J. (2016) Working the Phones: Control and Resistance in Call Centres. London: Pluto Press.
Yin, R. (1994) Case study research. Design and Methods, London: Sage.
Yu, T. & Jo, I.-H. (2014) “Educational Technology Approach Toward Learning Analytics: Relation-ship Between Student Online Behavior and Learning Performance in Higher Education.” In: Pro-ceedings of the Fourth International Conference on Learning Analytics And Knowledge - LAK ’14, 269–270.