A Method for Experimental Analysis and
Modeling of Virtualization Performance
Overhead
?Nikolaus Huber1, Marcel von Quast1, Fabian Brosig1, Michael Hauck2, and
Samuel Kounev1
1
Karlsruhe Institute of Technology (KIT) Chair for Software Design and Quality
Am Fasanengarten 5 76131 Karlsruhe, Germany {nikolaus.huber,fabian.brosig,samuel.kounev}@kit.edu [email protected] 2 Forschungszentrum Informatik 76131 Karlsruhe, Germany [email protected]
Abstract. Nowadays, virtualization solutions are gaining increasing
im-portance. By enabling the sharing of physical resources, thus making resource usage more efficient, they promise energy and cost savings. Ad-ditionally, virtualization is the key enabling technology for Cloud Com-puting and server consolidation. However, resource sharing and other factors have direct effects on system performance, which are not yet well-understood. Hence, performance prediction and performance man-agement of services deployed in virtualized environments like public and private Clouds is a challenging task. Because of the large variety of virtu-alization solutions, a generic approach to predict the performance over-head of services running on virtualization platforms is highly desirable. In this paper, we present a methodology to quantify the influence of the identified performance-relevant factors based on an empirical approach using benchmarks. We show experimental results on two popular state-of-the-art virtualization platforms, Citrix XenServer 5.5 and VMware ESX 4.0, as representatives of the two major hypervisor architectures. Based on these results, we propose a basic, generic performance predic-tion model for the two different types of hypervisor architectures. The target is to predict the performance overhead for executing services on virtualized platforms.
1
Introduction
In recent years, due to trends like Cloud Computing, Green IT and server consol-idation, virtualization technologies are gaining increasing importance. Formerly
?
This work was funded by the German Research Foundation (DFG) under grant No. 3445/6-1.
used to multiplex scarce resources such as mainframes [15], nowadays virtualiza-tion is again used to run multiple virtual servers on a single shared infrastruc-ture, thus increasing resource utilization, flexibility and centralized administra-tion. Because this technology also allows sharing server resources on-demand, it promises cost savings and creates new business opportunities by providing new delivery models, e.g., Infrastructure as a Service or Software as a Service.
According to the International Data Corporation (IDC), 18% of all new servers shipped in the fourth quarter of 2009 were virtualized [7] and the server virtualization market is expected to grow 30% a year through 2013 [8]. However, the adoption of server virtualization comes at the cost of increased system com-plexity and dynamics. The increased comcom-plexity is caused by the introduction of virtual resources and the resulting gap between logical and physical resource allocations. The increased dynamics is caused by the lack of direct control over the underlying physical hardware and by the complex interactions between the applications and workloads sharing the physical infrastructure introducing new challenges in systems management.
Hosting enterprise services on virtualized platforms like Cloud environments requires an efficient performance management strategy at the application level. Service-Level Agreements (SLAs), e.g., performance guarantees such as service response time objectives, need to be respected. On the other hand, the target is to utilize server resources efficiently in order to save administration and energy costs. Thus, providers of virtualized platforms are faced with questions such as: What performance would a new service deployed on the virtualized infrastructure exhibit and how much resources should be allocated to it? How should the system configuration be adapted to avoid performance problems arising from changing customer workloads? In turn, customers using virtualized resources are interested in a service’s performance behavior when, e.g., moving it to a Cloud Computing environment or when migrating it from one platform to another.
Answering such questions for distributed, non-virtualized execution environ-ments is already a complex task [12]. In virtualized environenviron-ments, this task is even more complicated because resources are shared. Moreover, since changes in the usage profiles of services may affect the entire infrastructure, capacity plan-ning has to be performed continuously during operation. Proactive performance
management, i.e., avoiding penalties by actingbefore performance SLAs are
vi-olated, requires predictions of the application-level performance under varying service workloads. Given that computation details are abstracted by an increas-ingly deep virtualization layer, the following research questions arise: i) What is the performance overhead when virtualizing execution environments? ii) Which are the most relevant factors that affect the performance of a virtual machine? iii) What are the differences in performance overhead on different virtualiza-tion platforms? iv) Can the performance-influencing factors be abstracted in a generic performance model?
Previous work on performance evaluation of virtualization platforms focuses mainly on comparisons of specific virtualization solutions and techniques, e.g., container-based virtualization versus full virtualization [2, 13, 17, 14]. Other work
like [1, 18, 9] investigates core and cache contention effects. Koh et al. predict the performance inference of virtualized workloads by running benchmarks manu-ally [10]. We extend our automated experimental analysis approach from [5] and evaluate its applicability to VMware ESX 4.0, another industry-standard plat-form with a different hypervisor architecture [16]. The main goal is to build a generic model which enables the prediction of performance overheads on dif-ferent virtualization platforms. To this end, we evaluate various performance-influencing factors like scheduling parameters, different workload types and their mutual influences, and scalability and overcommitment scenarios on the two dif-ferent types of hypervisor architectures. Finally, we summarize the results of both case studies and formulate a basic generic model of the influences of vari-ous parameters on the performance of virtualized applications. This model shall provide the means for estimating the performance of a native application when migrated to a virtualized platform or between platforms of different hypervisor architectures. In addition, this model can be used for capacity planning, e.g., by Cloud providers, to estimate the number of virtual machines (VMs) which can be hosted.
The contributions of [5] and [6] summarized and extended here are: i) an ap-proach on automated experimental analysis of the performance-influencing fac-tors of virtualization platforms, ii) an in-depth experimental analysis of the the state-of-the-art Citrix XenServer 5.5 virtualization platform covering performance-influencing factors like scheduling parameter, mutual influences of workload types etc., iii) an evaluation of these results on VMware ESX 4.0, another vir-tualization platform with a different hypervisor architecture, iv) a basic model capturing the general performance-influencing factors we have identified.
The remainder of this paper is organized as follows. Section 2 provides an overview of the automated experimental analysis we use. Section 3 presents detailed experimental results on Citrix XenServer 5.5. An comparison of our results based on repeated experiments on VMware ESX 4.0 is given in Section 4. In Section 5, we present our performance prediction model. Section 6 discusses related work, followed by a conclusion and an outlook on future work in Section 7.
2
Automated Experimental Analysis
Because virtualization introduces dynamics and increases flexibility, a variety of additional factors can influence the performance of virtualized systems. There-fore we need to automate the experiments and performance analysis as much as possible. In this section we give a brief summary of the generic approach to automated experimental analysis of virtualized platforms presented in [5].
2.1 Experimental Setup
The experimental setup basically consists of aMasterVM and acontroller. From
a static point of view, the MasterVM serves as a template for creating multiple VM clones executing a benchmark of choice (see Section 2.4). It contains all
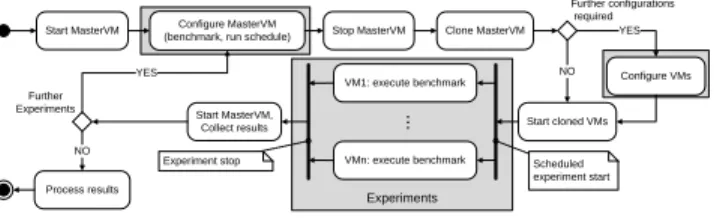
desired benchmarks together with a set of scripts to control the benchmark exe-cution (e.g., to schedule benchmark runs). A second major part is the controller which runs on a machine separated from the system under test. From a dynamic point of view, the controller clones, deletes, starts, and stops VMs via the virtu-alization layer’s API. Furthermore, it is responsible for collecting, processing and visualizing the results (see Figure 1). It also adjusts the configuration (e.g., the amount of virtual CPUs) of the MasterVM and the created clones as required by the considered type of experiment. Further details can be found in [5].
Experiments Start MasterVM (benchmark, run schedule)Configure MasterVM Stop MasterVM Clone MasterVM
Start cloned VMs Configure VMs VM1: execute benchmark Start MasterVM, Collect results Further Experiments Process results Further configurations required YES NO YES NO VMn: execute benchmark ... Scheduled experiment start Experiment stop
Fig. 1.Automated execution of experiments from the controllers point of view.
2.2 Experiment Types
Several types of experiments are executed, targeted at the following categories of influencing factors: (a) virtualization type, (b) resource management configu-ration, and (c) workload profile (see also Figure 8).
For category (a), an initial set of experiments is executed to quantify the performance overhead of the virtualization platform. The number of VMs and other resource management-related factors like core affinity or CPU scheduling parameters are part of category (b). The influence of these factors is investigated
in two different scenarios, focused onscalability(in terms of number of co-located
VMs), and overcommitment (in terms of allocating more resources than are
actually available). For scalability, one increases the number of VMs until all available physical resources are used. For overcommitment, the number of VMs is increased beyond the amount of available resources. Finally, for category (c) a set of benchmarks is executed focusing on the different types of workloads. For a more detailed description of the experiment types as well as a benchmark evaluation, we refer to [5].
2.3 Experimental Environment
We conducted our experimental analysis in two different hardware environments described below. In each considered scenario Windows 2003 Server was the native and guest OS hosting the benchmark application, unless stated otherwise.
Environment 1:This environment is a standard desktopHP Compaq dc5750
machine with an Athlon64 dual-core 4600+, 2.4 GHz. It has 4 GB DDR2-5300 of main memory, a 250 GB SATA HDD and a 10/100/1000-BaseT-Ethernet connection. The purpose of this environment was to conduct initial experiments for evaluating the overhead of the virtualization layer. This hardware was also
used to run experiments on a single core of the CPU by deactivating the second core in the OS.
Environment 2: To evaluate the performance when scaling the number of
VMs, a SunFire X4440 x64 Server was used. It has 4*2.4 GHz AMD Opteron
6 core processors with 3MB L2, 6MB L3 cache each, 128 GB DDR2-667 main memory, 8*300 GB of serial attached SCSI storage and 4*10/100/1000-BaseT-Ethernet connections.
2.4 Benchmark Selection
Basically, any type of benchmark can be used in the automated experimental analysis. Only the scripts to start and stop the benchmark and to extract the results must be provided. For CPU and memory-intensive workloads, two
alter-native benchmarks have been discussed in [5]: Passmark PerformanceTest v7.03
(a benchmark used by VMware [19]) and SPEC CPU20064 (an industry
stan-dard CPU benchmark). Both benchmarks have a similar structure consisting of sub-benchmarks to calculate an overall metric. Benchmark evaluation results in [5] showed that both Passmark and SPEC CPU show similar results in terms of virtualization overhead. However, a SPEC CPU benchmark run can take sev-eral hours or even to complete. Since passmark has much shorter runs, we use Passmark in their experiments and repeat each benchmark run 200 times to obtain a more confident overall rating and to gain a picture of the variability
of the results. In addition to Passmark, the Iperf benchmark5 is used to
mea-sure the network performance. It is based on a client-server model and supports the throughput measurement of TCP and UDP data connections between both endpoints.
3
Experiment Results for Citrix XenServer 5.5
In this section we summarize the results of [5] and enrich them with more fine-grained results and analyses. In [5], several benchmarks (CPU, memory, network I/O) were automatically executed to analyze the performance of native and vir-tualized systems. The results of a case study with Citrix XenServer 5.5 showed that the performance overhead for CPU virtualization is below 5% due to the hardware support. However, memory and network I/O virtualization overhead amounts up to 40% and 30%, respectively. Further experiments examined the performance overhead in scalability and overcommitment scenarios. The results for both the scalability and overcommitment experiments showed that the per-formance behavior of Citrix XenServer 5.5 meets the expectations and scales very well even for more than 100 VMs. Moreover, the measurements showed that performance loss can be reduced if one assigns the virtual CPUs to phys-ical cores (called core pinning or core affinity). For a detailed discussion of the previous results, we refer to [5].
3 Passmark PerformanceTest: http://www.passmark.com/products/pt.htm 4
SPEC CPU2006: http://www.spec.org/cpu2006/
5
In the following we present extended, more recent in-depth measurement results. At first, we compare the performance overhead of virtualization for dif-ferent workload types. Second, we present performance overheads in scaled-up and overcommitment scenarios. Finally, we investigated the impact of network I/O in more detail.
Overhead of Virtualization In these experiments, we investigate the performance
degradation for CPU, memory and I/O in more detail by looking at the sub-benchmark results of each sub-benchmark metric. The measurement results of Fig-ure 2 depict the fine-grained sub-benchmark results for the Passmark CPU Mark results normalized to the native execution. The results demonstrate that float-ing point operations are more expensive (up to 20% performance drop for the
Physics sub-benchmark) than the other sub-benchmark results. However, the overall performance drops are still in the range of 3% to 5%.
Total (CPU Mark) Integer Math
Floating Point Math
Find Prime
Numbers SSE Compression Encryption Physics String Sorting Legend
native (1 CPU core) virtualized (1 CPU core) native (2 CPU cores) virtualized (2 CPU cores)
nor malized 0.75 0.80 0.85 0.90 0.95 1.00 1.05 1.10
Fig. 2.Sub-benchmark results of the Passmark CPU Mark metric.
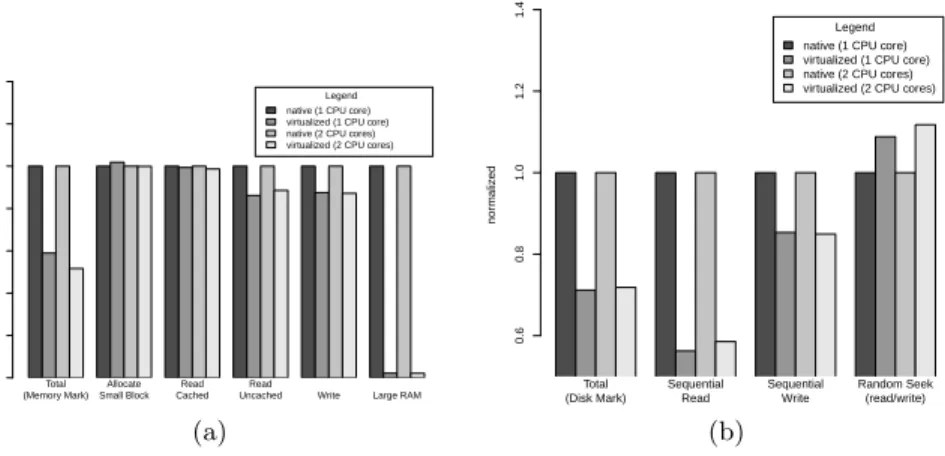
Looking at the fine-grained memory benchmark results depicted in Fig-ure 3(a), one can see that for the memory-intensive workloads the main cause for the overall performance drop stems from the allocation of large memory
ar-eas. For the Large RAM sub-benchmark, performance overhead is almost 97%.
However, when increasing the size of the main memory in separate, independent experiment with one VM at a time, the performance overhead for large memory accesses is only 65%, which also improves the overall memory benchmark results. Hence, increasing memory allocation can significantly improve performance for memory-intensive workloads, especially if expensive swapping can be avoided.
Finally, Figure 3(b) shows our results for disk I/O intensive workloads . With the Passmark Disk mark benchmark, we measured a performance overhead of up to 28%. A more detailed look at the benchmark results shows that most of the
performance overhead is caused by sequentialreadrequests, which achieve only
60% of the native performance, whereas for write request’s the performance
overhead does not exceed 20%.
The performance increase for the random seek benchmark can be explained by the structure of the virtual block device, a concept used in Citrix XenServer 5.5 for block oriented read and write, minimizing administration overhead and thus decreasing access times.
Total (Memory Mark) Allocate Small Block Read Cached Read
Uncached Write Large RAM Legend native (1 CPU core) virtualized (1 CPU core) native (2 CPU cores) virtualized (2 CPU cores)
nor malized 0.0 0.2 0.4 0.6 0.8 1.0 1.2 1.4 (a) Total (Disk Mark) Sequential Read Sequential Write Random Seek (read/write) Legend native (1 CPU core) virtualized (1 CPU core) native (2 CPU cores) virtualized (2 CPU cores) Subbenchmarks Festplatte (lokal)
nor malized 0.6 0.8 1.0 1.2 1.4 (b)
Fig. 3. Sub-benchmark results of the Passmark Memory Mark metric 3(a) and the
Passmark Disk Mark metric 3(b).
Scalability and Overcommitment The following measurements give insights and
explain why core affinity improves performance. Figure 4(a) shows the boxplot of 24 VMs simultaneously executing the CPU benchmark without core affinity. There are clearly two categories of VMs, one category (1, 11-19) performing significantly different from the other (2-10, 20-24). This behavior is not observed with core affinity (see Figure 4(b)), when each VM is executed on a separate physical core. This indicates that XenServer’s scheduler does not distribute the VMs on the cores equally. In Section 4, we investigate if this effect is observable on other hypervisor architectures, too.
With core affinity enabled, for scalability and overcommitment the perfor-mance drops linear with the scaled amount of VMs and inversely proportional to
the overcommitment factor, respectively. For example, assumecis the amount of
physical cores. If provisioningx·camount of virtual CPUs, performance roughly
drops by x1 in each of our experimental environments (single core, dual core, 24
cores).
Network I/O We conducted further experiments with the network I/O
bench-mark Iperf to gain more insight on the performance overhead of XenServer’s credit-based scheduler and its performance isolation. More precisely, the goal of these experiments was to demonstrate how the additional overhead introduced by the hypervisor to handle I/O requests is distributed among the running VMs. To this end, we executed four VMs, two VMs running CPU Mark and two VMs
withIperf. We pinned them pairwise on two physical cores, i.e., corec0executed
a pair of the CPU VM and Iperf VM and a different available corecxthe other
pair. The CPU benchmark was executed on both VMs, simultaneously and the network I/O benchmark was started separately on one VM. This symmetric
setup allows us to compare the results of VMs executed onc0 (where the Dom0
● ● ● ● ● ● ● ● ● ● ● ● ● ● ● ● ● ● ● ● ● ● ● ● ● ● ● ● ● ● ● ● ● ● ● ● ● ● ● ● ● ● ● ● ● ● ● ● ● ● ● ● ● ● ● ● ● ● ● ● ● ● ● ● ● ● ● ● ● ● ● ● ● ● ● ● ● ● ● ● ● ● ● ● ● ● ● ● ● ● ● ● ● ● ● ● ● ● ● ● ● ● ● ● ● ● ● ● ● ● ● ● ● ● ● ● ● ● ● ● ● ● ● ● ● ● ● ● ● ● ● ● ● ● ● ● ● ● ● ● ● ● ● ● ● ● ● ● ● ● ● ● ● ● ● ● ● ● ● ● ● ● ● ● ● ● ● ● ● ● ● ● ● ● 840 860 880 900 920 940 VMs CPU Mar k Rating 1 2 3 4 5 6 7 8 910 11 12 13 14 15 16 17 18 19 20 21 22 23 24 (a) ● ● ● ● ● ● ● ● ● ● ● ● ● ● ● ● ● ● ● ● ● ● ● ● ● ● ● ● ● ● ● ● ● ● ● ● ● ● ● ● ● ● ● ● ● ● ● ● ● ● ● ● ● ● ● ● ● ● ● ● ● ● ● ● ● ● ● ● ● ● ● ● ● ● ● ● ● ● ● ● ● ● ● ● ● ● ● ● ● ● ● ● ● ● ● ● ● ● ● ● ● ● ● ● ● ● ● ● ● ● ● ● ● ● ● ● ● ● ● ● ● ● ● ● ● ● ● ● ● ● ● ● ● ● ● ● ● ● ● ● ● ● ● ● ● ● ● ● ● ● ● ● ● ● ● ● ● ● ● ● ● 800 850 900 950 VMs CPU Mar k Rating 1 2 3 4 5 6 7 8 9101112131415161718192021222324 (b)
Fig. 4. CPU benchmark results for 24 VMs executedwithout (a) andwith (b) core
affinity. + + +++++++++++ + +++++++++++++ + ++++++++++ ++++++ + + +++ ++++++++++++++++++++++++++++++++++++++++++++++++ + + + 0 20 40 60 80 100 400 500 600 700 800 900
Network I/O performance effects
# Measurement CPU Mar k Rating ooooooooooooo o oooooooooooooooooooooooooooooooooooooooooooooooooooooooooooooooooooooooooooooooooooooo + o
cpu mark measurements on corex
cpu mark measurements on core0
Fig. 5.CPU benchmark results of two VMs executed oncore0andcorexwhen network
I/O is received by the VM running oncorex.
One would expect that there is no performance effect on the VMs running
onc0when the Iperf VM oncxexecutes network I/O. However, the results show
that the performance of the VM running the CPU benchmark on c0 drops up
to 13% when the VM oncx is executing the network I/O benchmark. Figure 5
depicts the CPU benchmark results of VMs executed on core0 (o) and corex
(+), showing that the benchmark rating of the VM oncore0 drops, although its
paired VM is idle. Because VMs executed on other cores thanc0did not exhibit
this behavior, this indicates that Dom0 mainly usesc0to handle I/O. This causes
a slight performance drop for VMs simultaneously executed onc0, i.e., about 1%
on average. This drop could further increase if other virtual machines on other cores receive network load. However, this is part of further research.
Mutual Influences of Workload Types Target of these experiments is to
iden-tify the mutual influences of VMs sharing their resources and serving different
physical core other then core0 to avoid interferences with Dom0. Then, we ran
an experiment for each possible combination of benchmark types. As a result,
we calculate the relative performance drop as r = 1−(ri/rs), where ri is the
interference result and rs the result measured when executing the benchmark
on an isolated VM. Table 1 summarizes the results for all combinations of work-load types. Note that we did not run network vs. network experiments because additional hardware would have been required.
V MA CPU CPU Mem CPU Mem Disk CPU Mem Disk
V MB CPU Mem Mem Disk Disk Disk Net Net Net
rA 46.71% 50.64% 50.33% 23.35% 24.82% 31.16% 52.88% 52.85% 3.07% rB 52.44% 45.93% 49.04% 1.49% -0.09% 45.99% 40.46% 42.18% 33.31%
Table 1. Mutual performance degradation for different workload types on Citrix
XenServer 5.5.
The results show that there are no significant mutual influences of CPU and memory intensive workloads. The performance drop for both benchmarks is reasonably equal and the drop also fits the expectation that each VM receives only half of its performance compared to isolated execution. Explanations are the similarity of both workload types in terms of the used resources (memory benchmarks require CPU as well) and the hardware support for CPU virtual-ization. An interesting observation is that the Disk benchmark is not influenced by other workload types except of when executed vs. the disk benchmark. This indicates that on Citrix XenServer 5.5, disk intensive workloads do not compete for resources of CPU and memory intensive workloads. This can be explained with the similar reason as for the virtualization overhead of the Disk mark re-sult: the concept used in Citrix XenServer 5.5 for block oriented read and write to minimize administration overhead. With this concept, disk workload can be passed through without requiring major hypervisor intervention.
4
Evaluation on VMware ESX 4.0
To evaluate the validity of the conclusions from our analysis of XenServer on other hypervisor architectures, we conducted the same experiments on another popular industry standard platform, VMware ESX 4.0, which has a different type of hypervisor architecture. This section compares the experiment results of both platforms. The following discussion and comparison of the results of our measurements on VMware ESX 4.0 has a similar structure as Section 3. we were only able to install VMware ESX 4.0 and to conduct our experiments on the SunFire machine.
Overhead of Virtualization After repeating the experiments on VMware ESX 4.0,
we calculate the relative delta between the two platforms as
V M wareESX4.0 − CitrixXenServer5.5
The results in Table 2 show almost identical results for the CPU and memory benchmarks because both virtualization platforms use the hardware virtualiza-tion support. However, for the I/O benchmarks, VMware ESX 4.0 performs better. The reason for this is that in Citrix XenServer 5.5, all I/O workload is handled by the separate driver domain Dom0, which is less efficient monolithic architecture of VMware ESX 4.0. Hence, it is important to distinguish these architectural differences when generalizing the results for the I/O performance overhead.
Benchmark rel. Delta
CPU Mark 0.15% Memory Mark 0.19% Disk Mark 19.14% Iperf, outgoing 13.91% Iperf, incoming 15.94%
Table 2.Relative deviation of CPU, memory, disk I/O and network I/O benchmark
results. 0.80 0.85 0.90 0.95 1.00 1.05 1.10 Number of VMs CPU Mar k Rating (nor maliz ed to 1 VM without affinity) ● ● ●
● Xen (with CPU affinity) Xen (without CPU affinity) vSphere (without CPU affinity)
1 12 24
(a) CPU benchmark
0.4 0.5 0.6 0.7 0.8 0.9 1.0 1.1 Number of VMs Memor y Mar k Rating (nor maliz ed to 1 VM without affinity) ● ● ● ● Xen (with CPU affinity)
Xen (without CPU affinity) vSphere (without CPU affinity)
1 12 24
(b) Memory benchmark
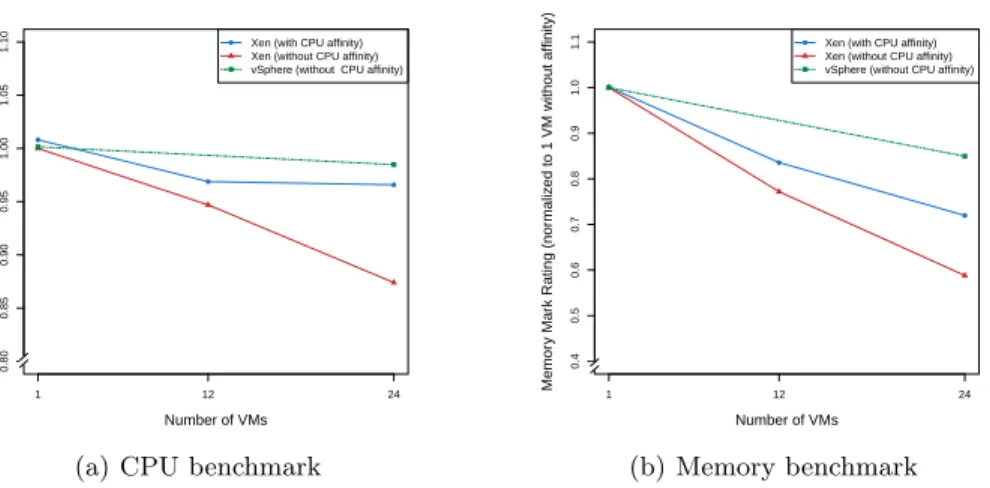
Fig. 6.Performance drop when scaling the number of VMs to the number of available
cores.
Scalability and Overcommitment Concerning the performance behavior when
scaling up and overcommitting, respectively, for VMware ESX 4.0 we observe a similar trend to the one on Citrix XenServer 5.5 (see Figure 6). Figure 7 shows this trend for the overcommitment scenario. As one can see, both platforms behave similarly. The results for scalability are similar with VMware ESX 4.0
performing slightly better. Another observation was that on VMware ESX 4.0, using core affinity did not result in any performance improvements. This indi-cates an improved hypervisor scheduling strategy which takes care of multicore environments and the cache and core effects observed in Section 3.
0.0 0.2 0.4 0.6 0.8 1.0 Overcommitment factor CPU Mar k Rating (nomr aliz ed) Hypothesis (1/x) XenServer vSphere CPU overcommitment 1 2 3
(a) CPU benchmark
0.0 0.2 0.4 0.6 0.8 1.0 Overcommitment factor Memor y Mar k Rating (nor malised ) Hypothesis (1/x) Xen vSphere 1 2 3 (b) Memory benchmark
Fig. 7.Performance behavior for CPU overcommitment for Citrix XenServer 5.5 and
VMware ESX 4.0 for CPU and Memory benchmarks.
Network I/O Analyzing the results of the network I/O experiments repeated
on VMware ESX 4.0 shows some further advantages of the monolithic architec-ture and that the concept of a separate management VM (Dom0) has a slight performance drawback. For example, we did not observe the effect of the Dom0 discussed in Section 4 (Network I/O). Hence, on VMware ESX 4.0, the addi-tional overhead for I/O virtualization is distributed more evenly than in Citrix XenServer 5.5.
Mutual Influences of Workload Types We repeated the same experiments to
determine the mutual influences of workload types on VMware ESX 4.0. Table 3 lists the results. For CPU and memory intensive workloads, the observations are comparable to the ones for Citrix XenServer 5.5: both workload types have a similar effect on each other caused by their similarities.
However, there is a big difference to Citrix XenServer 5.5 for disk intensive workload. For VMware ESX 4.0, we observe a high performance degradation of the disk workload independent of the other workload type. For example, if the disk benchmark is executed with CPU or memory benchmark, disk benchmark results drop almost 50%, whereas CPU and memory benchmark results suffer from only 10% and 20% performance loss, respectively. One explanation is that VMware’s virtual disk concept is different from Xen and in this concept both VMs compete for CPU time assigned by the hypervisor, thus confirming the differences in both hypervisor architectures. However, CPU and memory suffer from less performance degradation when running against disk workload than in Citrix XenServer 5.5.
The conclusions drawn are that by migrating and repeating our automated analysis to VMware ESX 4.0, we were able to confirm the results for CPU and memory intensive workloads as well as the observed trends in the scalability and overcommitment scenarios. However, the experiments also showed that there are differences when handling I/O intensive workloads. In these scenarios, VMware ESX 4.0’s performance behavior and performance isolation is better.
V MA CPU CPU Mem CPU Mem Disk CPU Mem Disk
V MB CPU Mem Mem Disk Disk Disk Net Net Net
rA 47.03% 46.64% 49.23% 10.02% 17.21% 44.53% 9.95% 35.32% 14.87% rB 48.21% 40.29% 51.34% 49.56% 45.53% 44.82% 65.02% 54.56% 32.74%
Table 3. Mutual performance degradation for different workload types on VMware
ESX 4.0.
5
Modeling the Performance-Influencing Factors
Having analyzed two major representative virtualization platforms, we now struc-ture the performance-influencing factors and capstruc-ture them in a basic mathe-matical performance model allowing one to predict the performance impacts of virtualized environments.
5.1 Categorization
This section categorizes the performance-influencing factors of the presented virtualization platforms. The goal is to provide a compact hierarchical model of performance-relevant properties and their dependencies. We capture those fac-tors that have to be considered for performance predictions at the application level, i.e., that have a considerable impact on the virtualization platform’s
per-formance, and we structure them in a so-calledfeature model [3]. In our context,
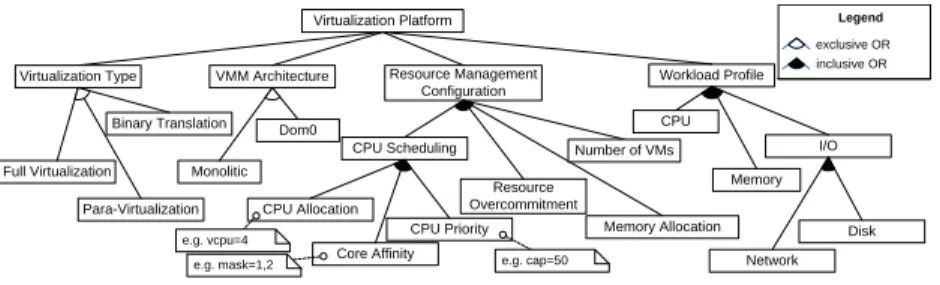
a feature corresponds to a performance-relevant property or a configuration op-tion of a virtualizaop-tion platform. The goal of the feature model is to capture the options that have an influence on the performance of the virtualization platform in a hierarchical structure. The feature model should also consider external in-fluencing factors such as workload profile or type of hardware. The model we propose is depicted in Figure 8.
The first performance-influencing factor is the virtualization type. Different
techniques might cause different performance overhead, e.g., full virtualization performs better than other alternatives because of the hardware support. In our feature model, we distinguish between the three types of virtualization: i) full virtualization, ii) para-virtualization and iii) binary translation. Furthermore, our experiments showed, that another important performance-influencing factor
is thehypervisor’s architecture. For example, a monolithic architecture exhibited
better performance isolation.
Several influencing factors are grouped underresource management
virtualization platform’s performance and is influenced by several factors. The first factor CPU allocation reflects the number of virtual CPUs allocated to a VM. Most of the performance loss of CPU intensive workloads comes from core and cache inferences [1]. Hence, the second factor is core affinity, specifying if vir-tual CPUs of VMs are assigned to dedicated physical cores (core-pinning). The third factor reflects the capability of assigning different CPU priorities to the VMs. For example, the Xen hypervisor’s cap parameter or VMware’s limits and fixed reservations parameters are CPU priority configurations. In addition, the level of resource overcommitment influences the performance due to contention effects caused by resource sharing. Finally, the memory allocation and the num-ber of VMs influence the resource management configuration, too. Managing virtual memory requires an additional management layer in the hypervisor. The number of VMs has a direct effect on how the available resources are shared among all VMs. Virtualization Platform Binary Translation Para-Virtualization Full Virtualization Virtualization Type exclusive OR Legend inclusive OR Resource Management Configuration CPU Scheduling CPU Allocation Core Affinity Workload Profile I/O CPU Memory Network Disk CPU Priority Memory Allocation
Number of VMs Resource Overcommitment VMM Architecture Dom0 Monolitic e.g. cap=50 e.g. mask=1,2 e.g. vcpu=4
Fig. 8.Major performance-influencing factors of virtualization platforms.
Last but not least, an important influencing factor is the workload profile
executed on the virtualization platform. Virtualizing different types of resources causes different performance overheads. For example, CPU virtualization is sup-ported very well whereas I/O and memory virtualization currently suffer from significant performance overheads. In our model we distinguish CPU, memory and I/O intensive workloads. In the case of I/O workloads, we further distin-guish between disk and network intensive I/O workloads. Of course, one can also imagine a workload mix as a combination of the basic workload types.
5.2 Performance Model
Based on the results of Section 3 and Section 4 we now propose a basic math-ematical performance prediction model (e.g., based on linear regression). We focus on the performance-influencing factors for which similar results were ob-served on the two virtualization platforms considered. These are the overhead for CPU and memory virtualization, the performance behavior in scalability sce-narios and the performance behavior when overcommitting CPU resources. Our model is intended to reflect the performance influences of the factors presented in the previous section. It can be used to predict the performance overhead for services to be deployed in virtualized environments.
In our experiments, performance is measured as the amount of benchmark op-erations processed per unit of time, i.e., the throughput of the system. This is not directly transferable to system utilization or response times, as the benchmarks always try to fully utilize the available resources. Therefore, in the following, we refer to throughput as the system performance. We calculate a performance
overhead factoroused to predict the performancepvirtualized=o·pnative, where
ocan be replaced by a formula of one of the following sections.
Overhead of Virtualization:The following basic equations allow to predict the
overhead introduced when migrating a native system to a virtualized platform. These equations assume that there are no influences by other virtual machines, which we consider later below. For CPU and memory virtualization, we calculate
the overhead factorsocpu andomem as 1−relative deviation100 using the measured
relative deviation values. One can use our automated approach to determine these factors for any other virtualization platform to derive more specific over-head factors. For I/O overover-head, we recommend to measure the performance overhead for each specific virtualization platform using our automated approach because the evaluation showed that there are significant differences between dif-ferent virtualization platforms and their implementations, respectively.
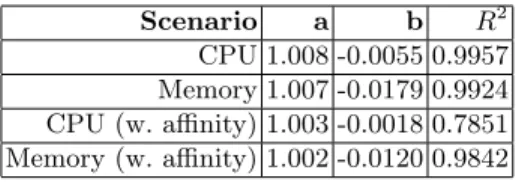
Scalability:To model the performance-influence of scaling-up CPU resources,
we use a linear equation. The performance overhead is defined as oscal =a+
b·cvirt, where cvirt is the number of virtual cores. The coefficients a and b
are given in Table 4. We distinguish between scenarios without core affinity and scenarios, where the virtual CPUs are pinned to the physical cores in an equal distribution. These equations give an approximation of the performance degradation when scaling-up which is independent of the virtualization platform. However, this approximation is only valid until you reach the amount of physical cores available. The overcommitment scenario is modeled in the next section. Moreover, the coefficients of determination show that the linear trend fits very well, except for the CPU with affinity scenario.
Overcommitment:When considering a scenario with overcommitted CPU
re-sources, we can approximate the performance overhead asooverc= 1x, wherexis
the overcommitment factor. The overcommitment factor is determined by cvirt
cphy,
the ratio of the provisioned virtual corescvirt and available physical corescphy.
Note that for CPU overcommitment this dependency between the performance overhead and the overcommitment factor is independent of the virtualization platform and the amount of executed VMs. Our experiments on two leading industry standard virtualization platforms demonstrated that the performance overhead simply depends on the ratio of virtual and physical cores. This depen-dency is valid at the core level, i.e., if you pin two VMs with one virtual core each on a single physical core, you experience the same performance drop.
6
Related Work
Barham et al. present the Xen hypervisor and compare its performance to a native system, the VMware workstation 3.2 and a User-Mode Linux at a high
Scenario a b R2
CPU 1.008 -0.0055 0.9957 Memory 1.007 -0.0179 0.9924 CPU (w. affinity) 1.003 -0.0018 0.7851 Memory (w. affinity) 1.002 -0.0120 0.9842
Table 4.Coefficients a, bfor the linear equations for CPU and memory performance
when scaling-up and the corresponding coefficient of determination.
level of abstraction [2]. They show that the performance is practically equiva-lent to a native Linux system and state that the Xen hypervisor is very scalable. [14, 17, 13] follow similar approaches by benchmarking, analyzing and compar-ing the properties of Linux-VServer 1.29, Xen 2.0, User-Mode Linux kernel 2.6.7, VMware Workstation 3.2. and OpenVZ, another container-based virtualization solution. Apparao et al. analyze the performance characteristic of a server con-solidation workload [1]. Their results show that most of the performance loss of CPU intensive workloads is caused by cache and core interferences. However, since the publication of these results, the considered virtualization platforms have changed a lot (e.g., hardware support was introduced) which renders the results outdated. Hence, the results of these works must be revised especially to evaluate the influences of, e.g., hardware support. Moreover, the previous work mentioned above does not come up with a model of the performance-influencing factors nor does it propose a systematic approach to quantify their impact au-tomatically. Such a generic framework to conduct performance analyses is pre-sented in [20]. This framework allows adding adapters to benchmark, monitor, and analyze the performance of a system. The framework has been applied to the performance analysis of message-oriented middleware, however, the adapters currently do not support the analysis of performance properties of virtualization platforms or Cloud Computing environments.
7
Conclusion and Outlook
In this paper, we conducted fine-grained experiments and in-depth analyses of the Citrix XenServer 5.5 based on the results of [5]. We migrated this approach to VMware ESX 4.0 and evaluated the validity of the previous findings. In summary, the results showed that CPU and memory virtualization performance behavior is similar on both systems as well as CPU scalability and overcommitment. How-ever, the results also indicated a deviation when it comes to I/O virtualization and scheduling. In these cases, VMware ESX 4.0 provides better performance and performance isolation than Citrix XenServer 5.5. Finally, we presented a basic model allowing to predict the performance when migrating applications from native systems to virtualized environments, for scaling up and overcom-mitting CPU resources, or for migrating to a different virtualization platform. As a next step, we plan to study the performance overhead for mixed workload
types and their mutual performance influence in more detail. In addition, we will use our model as a basis for future work in the Descartes research project [4, 11]. For example, we will integrate our results in a meta-model for performance prediction of services deployed in dynamic virtualized environments.
References
1. P. Apparao, R. Iyer, X. Zhang, D. Newell, and T. Adelmeyer. Characterization & Analysis of a Server Consolidation Benchmark. InVEE ’08, 2008.
2. P. Barham, B. Dragovic, K. Fraser, S. Hand, T. Harris, A. Ho, R. Neugebauer, I. Pratt, and A. Warfield. Xen and the Art of Virtualization. InSOSP, 2003. 3. K. Czarnecki and U. W. Eisenecker. Generative Programming. Add.-Wes., 2000. 4. Descartes Research Group. http://www.descartes-research.net, July 2011. 5. N. Huber, M. von Quast, F. Brosig, and S. Kounev. Analysis of the
Performance-Influencing Factors of Virtualization Platforms. InThe 12th International Sympo-sium on Distributed Objects, Middleware, and Applications (DOA), 2010.
6. N. Huber, M. von Quast, M. Hauck, and S. Kounev. Evaluating and Modeling Virtualization Performance Overhead for Cloud Environments. In International Conference on Cloud Computing and Service Science (CLOSER), 2011.
7. IDC. Virtualization Market Accelerates Out of the Recession as Users Adopt ”Virtualize First” Mentality. http://www.idc.com/getdoc.jsp?containerId =prUS22316610, April 2010.
8. IT world, The IDG Network. Gartner’s data on energy consumption, virtu-alization, cloud. http://www.itworld.com/green-it/59328/gartners-data-energy-consumption-virtualization-cloud, 2008.
9. R. Iyer, R. Illikkal, O. Tickoo, L. Zhao, P. Apparao, and D. Newell. VM3: Measuring, modeling and managing VM shared resources. Computer Networks, 53(17):2873 – 2887, 2009.
10. Y. Koh, R. C. Knauerhase, P. Brett, M. Bowman, Z. Wen, and C. Pu. An analysis of performance interference effects in virtual environments. InISPASS, 2007. 11. S. Kounev, F. Brosig, N. Huber, and R. Reussner. Towards self-aware performance
and resource management in modern service-oriented systems. InSCC’10. 12. D. A. Menasc´e, V. A. F. Almeida, and L. W. Dowdy. Capacity Planning and
Performance Modeling - From Mainframes to Client-Server Systems. Prentice-Hall, Inc., 1994.
13. P. Padala, X. Zhu, Z. Wang, S. Singhal, and K. G. Shin. Performance evaluation of virtualization technologies for server consolidation. HP Labs Tec. Report, 2007. 14. B. Qu´etier, V. N´eri, and F. Cappello. Scalability Comparison of Four Host
Virtu-alization Tools. Jounal on Grid Computing, 5(1):83–98, 2007.
15. M. Rosenblum and T. Garfinkel. Virtual machine monitors: current technology and future trends. Computer, 38(5):39–47, 2005.
16. M. Salsburg. Beyond the Hypervisor Hype. InCMG Conference, 2007.
17. S. Soltesz, H. P¨otzl, M. E. Fiuczynski, A. Bavier, and L. Peterson. Container-based operating system virtualization: a scalable, high-performance alternative to hypervisors. SIGOPS Oper. Syst. Rev., 41(3):275–287, 2007.
18. O. Tickoo, R. Iyer, R. Illikkal, and D. Newell. Modeling virtual machine perfor-mance: Challenges and approaches. InHotMetrics, 2009.
19. VMware. A performance comparison of hypervisors. http://www.vmware.com/pdf/hypervisor performance.pdf, 2007.
20. D. Westermann, J. Happe, M. Hauck, and C. Heupel. The Performance Cockpit Approach: A Framework for Systematic Performance Evaluations. InSEAA’10.