VOLUME 41, ARTICLE 20, PAGES 579
-
592
PUBLISHED 22 AUGUST 2019
https://www.demographic-research.org/Volumes/Vol41/20/ DOI: 10.4054/DemRes.2019.41.20
Descriptive Finding
How marriages based on bride capture differ:
Evidence from Kyrgyzstan
Susan Steiner
Charles M. Becker
© 2019 Susan Steiner & Charles M. Becker.
This open-access work is published under the terms of the Creative Commons Attribution 3.0 Germany (CC BY 3.0 DE), which permits use, reproduction, and distribution in any medium, provided the original author(s) and source are given credit.
1 Introduction 580
2 Data 581
3 Measuring similarity in personality 583
4 Results 584
5 Conclusions 589
How marriages based on bride capture differ:
Evidence from Kyrgyzstan
Susan Steiner1
Charles M. Becker2
Abstract
BACKGROUND
A significant proportion of women in the Kyrgyz Republic marry via ala kachuu, generally translated as bride capture or kidnapping. Many regard this practice as harmless elopement or a tradition; others perceive it as a form of forced marriage.
OBJECTIVE
This paper contributes to the understanding of ala kachuu by exploring the extent to which couples in these marriages differ from those in arranged or love marriages.
METHODS
We use the 2013 wave of the Life in Kyrgyzstan survey to compute profile similarity indices for the personality of couples. We then regress marriage type on the profile similarity index, controlling for sociodemographic variables.
RESULTS
Couples in marriages resulting from bride capture are far less assortatively matched on personality traits than other couples, especially those who have only recently married.
CONCLUSIONS
This greater dissimilarity is consistent with ala kachuu being forced marriage rather than merely staged or ritualized elopement.
CONTRIBUTION
This paper provides a novel source of evidence on the possible nonconsensual nature of bride capture in Kyrgyzstan, adding further weight to those arguing that it is forced.
1
Center for Evaluation and Development (C4ED), Mannheim, Germany and Leibniz Universität Hannover, Germany. Email:[email protected].
1. Introduction
According to ethnographic reports, many women were captured for marriage in societies across Europe, Asia, Africa, Australia, and the Americas in the past (Ayres 1974; Barnes 1999). In many places, this so-called bride capture no longer seems common, but it is still practiced in such countries as Armenia, Ethiopia, Kazakhstan, Kyrgyzstan, and South Africa. In Kyrgyzstan, for example, an estimated 16–24% of currently married women were captured (Becker, Mirkasimov, and Steiner 2017; Nedoluzhko and Agadjanian 2015; UNFPA 2016). Here, contemporary bride capture usually involves a potential groom and his male friends taking a young woman into a car and transporting her to his home. The woman might be captured from her house, a school, her workplace, or on the street. In the man’s home, his female relatives pressure her to put a marriage scarf over her hair, signifying that she accepts the marriage (Borbieva 2012). In principle, a woman may resist but Amsler and Kleinbach (1999) and Kleinbach, Ablezova, and Aitieva (2005) estimate that only 8 to 17% of bride captures do not result in marriage.
In principle, the extent of force involved may vary (Amsler and Kleinbach 1999; Kleinbach, Ablezova, and Aitieva 2005). One extreme is fully nonconsensual abduction, in which the man captures the woman through physical force. Another extreme is elopement, in which the man and the woman agree on the capture beforehand – for example, in the case of parental disapproval of their marriage plans. For policy-making, it is important to determine whether marriages following bride capture tend to be coercive or consensual as only coercive captures would be a matter of concern.
Despite bride capture being illegal, and the emergence of several initiatives by nongovernmental organizations and international organizations combating the practice and publishing anecdotes of violent bride captures (UN Women 2016), there is substantial belief among the Kyrgyzstani population that marriages following bride capture are largely consensual displays that pay homage to tradition while being practical, in the sense of lowering wedding costs (UNFPA 2016). We strongly dispute this claim. As we document in Becker, Mirkasimov, and Steiner (2017), infants born to Kyrgyz women in such marriages are significantly lighter at birth – between 40 and 200 grams, depending on the specification – than those offspring of other marriages. We argue that this birth-weight loss is a sign of increased psychological stress experienced by women who have to live with a partner they did not choose.
Kyrgyzstan survey, in which couples self-report their marriage type: love marriage, arranged marriage, or marriage following bride capture.
A conventional approach to measuring similarity of married couples would be to focus on age and education. We choose instead to focus on personality for the following reasons. First, women’s age at first marriage is highly concentrated between ages 17 and 23. Even in a coercive setting, social conventions are such that men would naturally target women in this age range and 0–5 years younger than themselves. Second, there is remarkably little variation in educational attainment, especially in rural Kyrgyzstan. A high proportion of young men and women finish, or nearly finish, secondary school; only a small proportion goes on to university. Third, personality is more difficult to ascertain on the marriage market than age and education, which makes this characteristic particularly interesting in the context of forced marriages in which spouses might not know each other very well. Fourth, it might be that men who capture a woman actively choose a spouse with different personality traits than themselves. For instance, this would be the case if socially unattractive men targeted women with more socially acceptable traits in order to enhance their own social acceptance.
2. Data
We use data from the Life in Kyrgyzstan (LiK) survey, which is nationally representative (Brück et al. 2014). This survey was first conducted in 2010. The original sample consisted of slightly more than 8,000 adult individuals in 3,000 households. LiK is an individual panel survey in which all adult individuals of the originally sampled households are tracked and interviewed. Five survey waves have been collected (2010, 2011, 2012, 2013, and 2016) but only the first four are publicly available as of July 2018.
Our main data source is the 2013 LiK wave, which consists of 7,652 adult individuals in 2,584 households. In this wave, married respondents are requested to name their spouse in the household, which facilitates identification of couples yielding 2,812 married couples. We know the type of marriage for 2,520 of these couples. Marriage type was self-reported by female LiK respondents in 2011 and later updated for those respondents with a change in marital status. Some women observed in 2013 were not part of the 2011 LiK sample. Most newly observed women were migrants and thus absent from their household in 2011. These women should have reported their marital status in 2012 or 2013 but many did not do so.
provided by women in the LiK, we cannot report the corresponding numbers for married men.
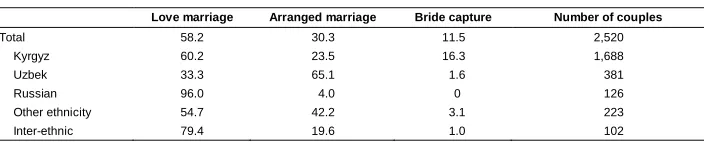
Table 1 shows the prevalence of different types of marriage. Overall, 58.2% of interviewed women report to have married through love marriage; 30.3% through arranged marriage; and 11.5% through bride capture. The table also reports prevalence of the three types of marriage for different ethnic groups. Most couples in our sample are mono-ethnic; i.e., husband and wife report having the same ethnicity. Only 4% of all couples are inter-ethnic. According to the women’s self-report, love marriages are most prevalent among Russian and inter-ethnic couples, and arranged marriages dominate among Uzbek and other ethnic couples. While Kyrgyz couples practice all three types of marriage, marriages following bride capture are essentially limited to this ethnic group. With few exceptions, non-Kyrgyz do not engage in bride capture but marry through either love or arranged marriages.
Table 1: Prevalence of marriage type (in %), by couple’s ethnic group
Love marriage Arranged marriage Bride capture Number of couples
Total 58.2 30.3 11.5 2,520
Kyrgyz 60.2 23.5 16.3 1,688
Uzbek 33.3 65.1 1.6 381
Russian 96.0 4.0 0 126
Other ethnicity 54.7 42.2 3.1 223
Inter-ethnic 79.4 19.6 1.0 102
Note: Other ethnicity includes all remaining ethnic groups that reside in Kyrgyzstan. They are not reported separately as each ethnicity numbers fewer than 100 couples in the survey.
Source: LiK survey data.
3. Measuring similarity in personality
We measure couples’ similarity in terms of personality with the help of the 21-item version of the Big Five Inventory (Rammstedt and John 2005) contained in the LiK. Respondents stated to what extent they agreed with the 21 personality statements on a 5-point Likert scale (1 = strongly disagree; 5 = strongly agree).
Our measure of spousal similarity is the profile similarity index (Klohnen and Mendelsohn 1998; Luo and Klohnen 2005). This index correlates wife and husband’s responses across all personality statements of the Big Five Inventory. Ranging from –1 to 1, it captures the relative importance that each spouse accords to these statements. The advantage of the profile similarity index – compared with standard correlation coefficients – is that we obtain a measure of spousal similarity for each couple. We use this measure as an outcome variable in multivariate regressions below.
The formula to calculate the profile similarity index is:
= ∑ ( − ̅)( − ̅)
∑ ( − ̅) ∑ ( − ̅)
where ̅ and ̅ are the average values over all personality statements for the wife w and husband h, respectively. and are the wife and husband’s valuesx for a specific statementa.z is the total number of statements.
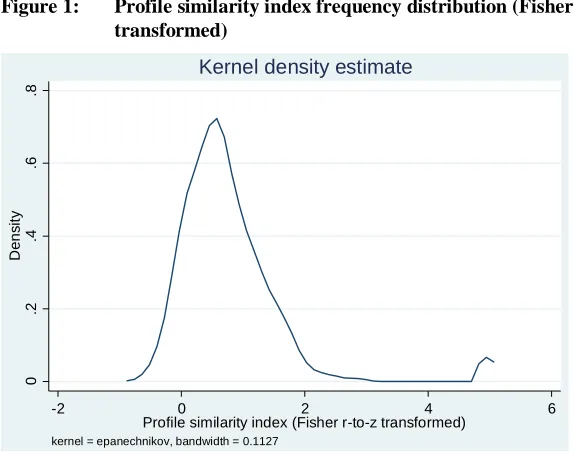
Figure 1: Profile similarity index frequency distribution (Fisher r-to-z transformed)
Source: Authors’ calculation based on LiK data.
4. Results
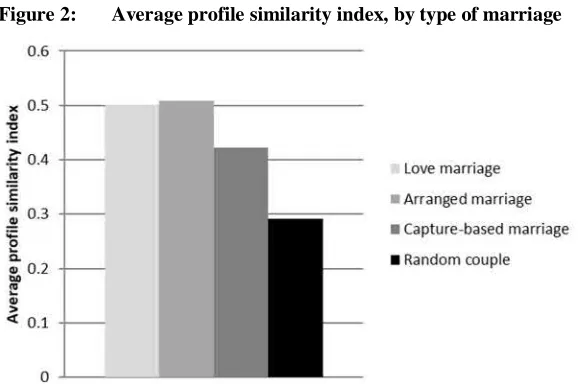
Figure 2 illustrates the extent of assortative mating in love, arranged, and capture-based marriages. While the average profile similarity index is almost identical in arranged and love marriages, it is substantially lower in capture-based marriages (p-value < 0.01 for a one-tailed test comparing them to love or arranged marriages). This suggests that spouses in capture-based marriages are more randomly paired than spouses in other marriages.
0
.2
.4
.6
.8
D
en
s
it
y
-2 0 2 4 6
Profile similarity index (Fisher r-to-z transformed) kernel = epanechnikov, bandwidth = 0.1127
Figure 2: Average profile similarity index, by type of marriage
Source: Authors’ calculation based on LiK data.
We next analyze how couples in capture-based marriages compare with randomly matched couples by creating 25,440 random pairs of husbands and wives and computing their profile similarity indexes. Only individuals within the same province are matched to each other because marriage markets in Kyrgyzstan tend to be local. The resulting average profile similarity index for the random couples is positive, possibly due to common response biases, common general knowledge about human behavior, or true shared human nature (Luo and Klohnen 2005). Yet, it is lower than that of couples in capture-based marriages (p-value < 0.01 for a one-tailed test). Hence, while spouses in capture-based marriages seem to be more randomly paired than spouses in love and arranged marriages, they are not fully random matches.
It is important to acknowledge that marriage type is self-reported. Thus, it is possible that women who were captured and are happy with their marriage report it as love marriage. If so, the pattern shown here would be an overestimation of the difference between marriages resulting from bride capture and other marriage types because the first group would only contain the more adverse marriages.
schooling years, and district of residence (by including district dummies). Nonetheless, despite this rich set of controls, it is still possible that unobserved variables also account for variation in couples’ similarity.
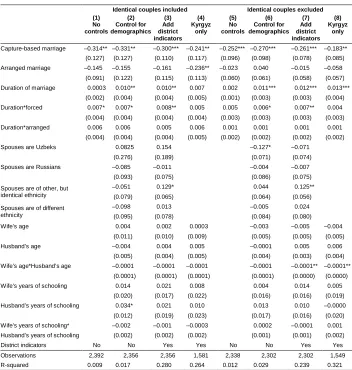
Table 2: Estimation results: Association of profile similarity index and type of marriage
Identical couples included Identical couples excluded (1) No controls (2) Control for demographics (3) Add district indicators (4) Kyrgyz only (5) No controls (6) Control for demographics (7) Add district indicators (8) Kyrgyz only
Capture-based marriage –0.314** –0.331** –0.300*** –0.241** –0.252*** –0.270*** –0.261*** –0.183** (0.127) (0.127) (0.110) (0.117) (0.096) (0.098) (0.078) (0.085) Arranged marriage –0.145 –0.155 –0.161 –0.236** –0.023 0.040 –0.015 –0.058
(0.091) (0.122) (0.115) (0.113) (0.060) (0.061) (0.058) (0.057) Duration of marriage 0.0003 0.010** 0.010** 0.007 0.002 0.011*** 0.012*** 0.013***
(0.002) (0.004) (0.004) (0.005) (0.001) (0.003) (0.003) (0.004) Duration*forced 0.007* 0.007* 0.008** 0.005 0.005 0.006* 0.007** 0.004
(0.004) (0.004) (0.004) (0.004) (0.003) (0.003) (0.003) (0.003) Duration*arranged 0.006 0.006 0.005 0.006 0.001 0.001 0.001 0.001
(0.004) (0.004) (0.004) (0.005) (0.002) (0.002) (0.002) (0.002) Spouses are Uzbeks 0.0825 0.154 –0.127* –0.071
(0.276) (0.189) (0.071) (0.074) Spouses are Russians –0.085 –0.011 –0.004 –0.007
(0.093) (0.075) (0.086) (0.075) Spouses are of other, but
identical ethnicity
–0.051 0.129* 0.044 0.125**
(0.079) (0.065) (0.064) (0.056) Spouses are of different
ethnicity
–0.098 0.013 –0.005 0.024
(0.095) (0.078) (0.084) (0.080) Wife’s age 0.004 0.002 0.0003 –0.003 –0.005 –0.004
(0.011) (0.010) (0.009) (0.005) (0.005) (0.005) Husband’s age –0.004 0.004 0.005 –0.0001 0.005 0.006
(0.005) (0.004) (0.005) (0.004) (0.003) (0.004) Wife’s age*Husband’s age –0.0001 –0.0001 –0.0001 –0.0001 –0.0001** –0.0001**
(0.0001) (0.0001) (0.0001) (0.0001) (0.0000) (0.0000) Wife’s years of schooling 0.014 0.021 0.008 0.004 0.014 0.005
(0.020) (0.017) (0.022) (0.016) (0.016) (0.019) Husband’s years of schooling 0.034* 0.021 0.010 0.013 0.010 –0.0000 (0.012) (0.019) (0.023) (0.017) (0.016) (0.020) Wife’s years of schooling* –0.002 –0.001 –0.0003 0.0002 –0.0001 0.001 Husband’s years of schooling (0.002) (0.002) (0.002) (0.001) (0.001) (0.002)
District indicators No No Yes Yes No No Yes Yes
Observations 2,392 2,356 2,356 1,581 2,338 2,302 2,302 1,549 R-squared 0.009 0.017 0.280 0.264 0.012 0.029 0.239 0.321
Note: Standard errors are clustered at the community (primary sampling unit) level. Constant omitted. *** p<0.01, ** p<0.05, * p<0.1.
Columns (1)–(4) include the 54 couples that provided identical responses to the personality statements; columns (5)–(8) exclude them. Columns (1) and (5) do not control for demographics. In columns (2) and (6), we control for ethnicity, age, and education. Columns (3) and (7) add dummies for the district of residence. Hence, here we only compare couples within the same district to each other. Finally, columns (4) and (8) restrict the analysis to Kyrgyz couples because bride capture is rarely practiced by other ethnic groups, as shown above. All regressions control for duration of marriage, as couples may grow more alike over time (or the most dissimilar couples may divorce); duration is also interacted with marriage type. Controlling for marriage duration reduces the number of observations from 2,399 to a maximum of 2,392.
In all columns, newlywed couples (i.e., at zero years of marriage duration) in capture-based marriages turn out to have a significantly lower profile similarity index than newlywed couples in love marriages, and at least at a 5% significance level. Coefficients vary between –0.33 and –0.18, indicating a 37%–70% lower index for capture-based marriages compared with the average profile similarity index. There is only little evidence for social homogamy as coefficients differ little between columns (1) and (2) as well as between columns (5) and (6). Adding in district indicators only slightly reduces the forced marriage coefficient’s absolute value. Newlywed couples in arranged marriages do not seem to have different profile similarity indexes than those in love marriages, save for when the sample is restricted to only those of Kyrgyz ethnicity and in which identical couples are included.
Marriage duration does turn out to matter for similarity. Over time, observed couples become more alike, regardless of marriage type. The positive interaction terms for duration and capture-based marriage imply that this convergence is particularly important for couples in these marriages – quite likely because they were so dissimilar to begin with.
duration of marriage, couples become more similar in all types of marriage. Spouses in capture-based marriages converge, above all, in openness, the trait in which they were most dissimilar at the beginning of marriage.
Table 3: Estimation results: Association of personality trait similarities index and type of marriage, controlling for marriage duration
(1) (2) (3) (4) (5)
Openness Conscientiousness Agreeableness Extraversion Neuroticism
Capture-based marriage –0.769*** –0.279 –0.366* –0.459 –0.210 (0.209) (0.233) (0.215) (0.289) (0.212) Arranged marriage –0.305* 0.0260 –0.089 –0.134 0.030
(0.159) (0.223) (0.213) (0.192) (0.203) Duration of marriage 0.011 0.033*** 0.031*** 0.026** 0.025**
(0.009) (0.010) (0.011) (0.010) (0.011) Duration*forced 0.024*** 0.005 0.001 0.019* 0.002
(0.009) (0.008) (0.007) (0.011) (0.009) Duration*arranged 0.014** –7.41e–05 –0.005 0.007 0.0003 (0.006) (0.007) (0.007) (0.007) (0.007) Spouses are Uzbeks 0.202 0.020 0.124 0.444** 0.172
(0.211) (0.205) (0.178) (0.206) (0.183) Spouses are Russians –0.117 –0.182 0.039 0.154 0.159
(0.139) (0.208) (0.254) (0.212) (0.232)
Spouses are of other, but identical ethnicity
0.179 0.255 0.199 0.061 0.347**
(0.138) (0.178) (0.165) (0.148) (0.145) Spouses are of different ethnicity 0.343** –0.333 –0.048 0.169 –0.050
(0.156) (0.229) (0.250) (0.242) (0.244)
Wife’s age 0.014 –0.023 –0.015 –0.021 –0.003
(0.015) (0.019) (0.020) (0.018) (0.020)
Husband’s age –0.001 –0.005 0.010 0.007 0.005
(0.011) (0.010) (0.012) (0.012) (0.012) Wife’s age*Husband’s age –0.0002 –0.0004 –0.0002 –0.0001 –0.0003 (0.0002) (0.0002) (0.0002) (0.0002) (0.0002) Wife’s years of schooling 0.081 –0.024 –0.018 0.040 –0.029
(0.049) (0.052) (0.051) (0.060) (0.065) Husband’s years of schooling 0.059 –0.023 –0.051 0.055 –0.078
(0.049) (0.049) (0.059) (0.058) (0.064) Wife’s years of schooling* –0.006 0.004 0.003 –0.002 0.006 Husband’s years of schooling (0.004) (0.005) (0.005) (0.005) (0.005)
District indicators Yes Yes Yes Yes Yes
Observations 2,141 2,227 2,217 2,277 2,086
R-squared 0.184 0.153 0.157 0.137 0.204
Note: Standard errors are clustered at the community (primary sampling unit) level. Constant omitted. *** p<0.01, ** p<0.05, * p<0.1.
5. Conclusion
References
Amsler, S. and Kleinbach, R. (1999). Bride kidnapping in the Kyrgyz Republic. International Journal of Central Asian Studies 4: 185–216.
Ayres, B. (1974). Bride theft and raiding for wives in cross-cultural perspective. Anthropological Quarterly 47(3): 238–252.doi:10.2307/3316978.
Barnes, R.H. (1999). Marriage by capture. Journal of the Royal Anthropological Institute 5(1): 57–73.doi:10.2307/2660963.
Becker, C.M., Mirkasimov, B., and Steiner, S. (2017). Forced marriage and birth outcomes.Demography54(4): 1401–1423.doi:10.1007/s13524-017-0591-1.
Borbieva, N.O. (2012). Kidnapping women: Discourses of emotion and social change in the Kyrgyz Republic. Anthropological Quarterly 85(1): 141–169. doi:10.1353/anq.2012.0015.
Brück, T., Eseanliev, D., Kroeger, A., Kudebayeva, A., Mirkasimov, B., and Steiner, S. (2014). Household survey data for research on well-being and behavior in Central Asia. Journal of Comparative Economics 42(3): 819–835. doi:10.1016/j.jce.2013.02.003.
Kleinbach, R., Ablezova, M., and Aitieva, M. (2005). Kidnapping for marriage (ala kachuu) in a Kyrgyz village. Central Asian Survey 24(2): 191–202. doi:10.1080/02634930500155138.
Klohnen, E.C. and Mendelsohn, G.A. (1998). Partner selection for personality characteristics: A couple-centered approach.Personality and Social Psychology Bulletin 24(3): 268–278.doi:10.1177/0146167298243004.
Luo, S. and Klohnen, E.C. (2006). Assortative mating and marital quality in newlyweds: A couple-centered approach. Journal of Personality and Social Psychology 88(2): 304–326.doi:10.1037/0022-3514.88.2.304.
Nedoluzhko, L. and Agadjanian, V. (2015). Between tradition and modernity: Marriage dynamics in Kyrgyzstan. Demography 52(3): 861–882. doi:10.1007/s13524-015-0393-2.
Rammstedt, B. and John, O.P. (2005). Kurzversion des Big Five Inventory (BFI-K). Diagnostica 51(4): 195–206.doi:10.1026/0012-1924.51.4.195.
United Nations Entity for Gender Equality and the Empowerment of Women (UN Women) (2016). Gender in society perception study: Violence against women and girls. Bishkek: UN Women.
Supplemental material
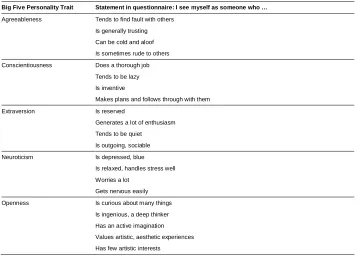
Table A-1: The Big Five Personality Traits (21-item version)
Big Five Personality Trait Statement in questionnaire: I see myself as someone who …
Agreeableness Tends to find fault with others Is generally trusting Can be cold and aloof Is sometimes rude to others Conscientiousness Does a thorough job
Tends to be lazy Is inventive
Makes plans and follows through with them Extraversion Is reserved
Generates a lot of enthusiasm Tends to be quiet Is outgoing, sociable Neuroticism Is depressed, blue
Is relaxed, handles stress well Worries a lot
Gets nervous easily Openness Is curious about many things