DEMOGRAPHIC RESEARCH
VOLUME 40, ARTICLE 33, PAGES 963
-
974
PUBLISHED 16 APRIL 2019
https://www.demographic-research.org/Volumes/Vol40/33/ DOI: 10.4054/DemRes.2019.40.33
Descriptive Finding
The residential segregation of the American
Indian and Alaska Native population in US
metropolitan and micropolitan areas, 2010
Jack Byerly
© 2019 Jack Byerly.
This open-access work is published under the terms of the Creative Commons Attribution 3.0 Germany (CC BY 3.0 DE), which permits use, reproduction, and distribution in any medium, provided the original author(s) and source are given credit.
1 Introduction 964
2 Background 964
3 Data and methods 966
4 Results 968
5 Limitations and future directions 970
6 Acknowledgments 972
Demographic Research: Volume 40, Article 33 Descriptive Finding
The residential segregation of the American Indian and Alaska
Native population in US metropolitan and micropolitan areas, 2010
Jack Byerly1
Abstract
BACKGROUND
Racial/ethnic residential segregation has been studied extensively, but few studies have focused on the growing population of American Indians and Alaska Natives (AIANs). An examination of the group’s residential patterns will contribute to an understanding of the social position of AIANs and the overall pattern of racial/ethnic residential segregation in the United States.
OBJECTIVE
What is the average level of residential segregation in 2010 across metropolitan and micropolitan areas with a substantial AIAN presence? What are the most and least segregated areas for this group? What are the causes and correlates of residential segregation for this group?
METHODS
I use the index of dissimilarity to measure the residential segregation of single-race and multiracial AIANs from non-Hispanic whites in 264 metropolitan and micropolitan statistical areas, using data from the 2010 census. I also use data from the 2010 census and the 2006–2010 American Community Survey to estimate OLS regression models examining the possible causes and correlates of segregation levels across metropolitan and micropolitan areas.
RESULTS
The index of dissimilarity for single-race AIANs is 31.8, while for multiracial AIANs it is 23.6. For both single-race and multiracial AIANs, higher segregation levels are found in metropolitan areas with larger populations, a higher proportion of AIANs, more female-headed households, and a lower relative education level for AIANs.
CONCLUSIONS
Relative to other racial/ethnic groups, AIANs – especially multiracial AIANs – experience low levels of residential segregation from non-Hispanic whites.
CONTRIBUTION
This is the first study that reports and examines residential segregation levels for AIANs using 2010 census data.
1. Introduction
A rich vein of research in demography, sociology, and related fields has focused on the measurement, causes, and consequences of racial/ethnic residential segregation. Little of this research, however, has focused on the American Indian and Alaska Native (AIAN) population. The growth of this population in recent decades (Norris, Vines, and Hoeffel 2012; Passel 1997) has prompted increased attention to the residential segregation of this population (Bennett 2011; Iceland, Weinberg, and Steinmetz 2002; Lichter et al. 2007; Wilkes 2003; Wilkes and Iceland 2004). Nonetheless, gaps remain in our knowledge of this topic. In this paper, I contribute to the literature on the racial/ethnic residential segregation of AIANs by using more recent data (from the 2010 decennial census), comparing the residential segregation of single-race and multiracial AIANs, and examining some of the possible causes and correlates of racial/ethnic residential segregation for these groups.
2. Background
The 2010 decennial census counted approximately 2.9 million single-race AIANs and 2.3 million multiracial AIANs. The size of both populations increased substantially during the decade from 2000 to 2010: Single-race AIANs increased 18.4% and multiracial AIANs increased 39.2%. The growth of both groups outpaced the population growth of the United States as a whole during this period (9.7%) (Norris, Vines, and Hoeffel 2012). This decade was not unique. Since the shift from census enumerator–identified race to self-identification of race on census forms in the mid-twentieth century, the growth of the AIAN population has outpaced that which would be possible based on natural increase and immigration, indicating change driven, in part, by changes in self-identification (Passel 1997; Thornton 1997). Because of movement both into and out of self-identification as AIAN, the total number of identification changes is even larger than the net values suggest (Liebler, Bhaskar, and Porter 2016; Liebler and Ortyl 2014).
Demographic Research: Volume 40, Article 33
population dynamics, and traditional association with rural areas. Studies examining residential segregation of AIANs in metropolitan areas in the period 1980–2000 (Bennett 2011; Iceland, Weinberg, and Steinmetz 2002; Lichter et al. 2007; Wilkes 2003; Wilkes and Iceland 2004) find moderate residential segregation of AIANs from non-Hispanic whites. (Index of dissimilarity values in these studies generally fall between 30 and 45.) These values are generally lower than the comparable segregation measures for African Americans and Hispanics (Iceland, Weinberg, and Steinmetz 2002). Research on small towns and rural areas (Lichter et al. 2007) finds a similar pattern: AIANs are moderately segregated from non-Hispanic whites, but to a lesser extent than Hispanics and African Americans. Iceland, Weinberg, and Steinmetz (2002) find slight declines in AIAN/non-Hispanic white residential segregation during the period 1980–2000. Evidence on the segregation of multiracial AIANs is even scarcer, but research to date (Bennett 2011; Iceland, Weinberg, and Steinmetz 2002) suggests that multiracial AIANs are slightly less segregated from non-Hispanic whites than are single-race AIANs.
There are a number of reasons why studying the residential segregation of AIANs may be theoretically and empirically intriguing. First, it contributes to producing a more complete picture of racial/ethnic residential segregation in the United States by including a racial/ethnic group not often considered in residential segregation research. Second, it may help us understand how residential segregation patterns change in the presence of shifting racial/ethnic identity and a growing multiracial population. Finally, despite the relatively disadvantaged socioeconomic position of AIANs as a group (Davis, Roscigno, and Wilson 2016; Huyser, Sakamoto, and Takei 2010; Huyser, Takei, and Sakamoto 2014; Snipp 1989, 1992), past research has shown that they are less segregated from non-Hispanic whites than many other racial/ethnic minority groups. A better understanding of the residential segregation patterns of this group may help us understand the relative importance of race/ethnicity and socioeconomic status in the production, reproduction, and decline of racial/ethnic residential segregation.
3. Data and methods
I measure residential segregation using the index of dissimilarity (D) for census tracts within MSAs, using the package ‘seg’ (Reardon and Townsend 2018) for Stata 15.1. The comparison group for all calculations of D is single-race non-Hispanic whites. Data on residence and race/ethnicity comes from the 2010 decennial census. Because estimates of residential segregation may be unreliable when populations are very small (Wilkes 2003), I limit the analysis to MSAs with a minimum population of 1,000 single-race AIANs and 1,000 individuals who identified as AIAN in combination with one or more other racial identities (i.e., multiracial AIANs). The full sample includes 219 metropolitan areas and 45 micropolitan areas, encompassing approximately 71.9% of the national single-race AIAN population and approximately 79.2% of the national multiracial AIAN population. I also report average D values for just the 219 metropolitan areas in the sample and list the five most and least segregated MSAs for each of the samples (full and metropolitan only) and groups (single-race and multiracial AIANs).
I then estimate OLS regression models using the D values for single-race AIANs and multiracial AIANs. In each analysis, the dependent variable is the D value for the relevant group in each MSA in the full sample. The explanatory variables are based on past findings (e.g., Rugh and Massey 2014) on the MSA-level factors that help explain racial/ethnic residential segregation. The independent variables and their data sources are summarized below and in Table 1.
Demographic Research: Volume 40, Article 33
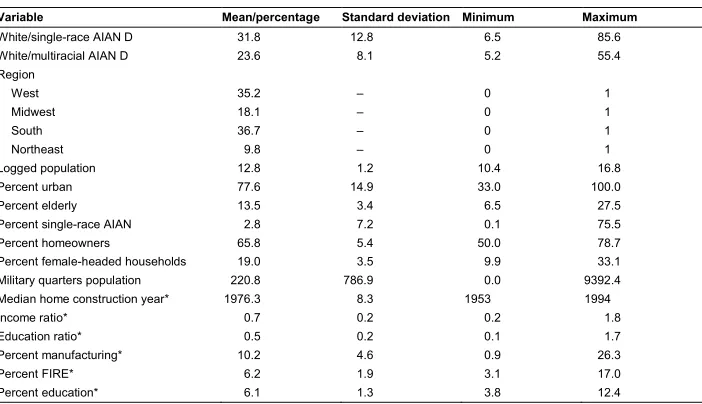
single-race AIAN household income to median non-Hispanic white household income in the MSA, based on the 2006–2010 five-year ACS estimates. ‘Education ratio’ is the ratio of the percent of the single-race AIAN population age 25 years or older with at least a bachelor’s degree to the percent of the non-Hispanic white population age 25 years or older with at least a bachelor’s degree in each MSA, based on the 2006–2010 five-year ACS estimates. ‘Percent manufacturing’ is the percentage of the civilian employed population age 16 years or older in the MSA working in the manufacturing industry, based on the 2006–2010 five-year ACS estimates. ‘Percent FIRE’ is the percentage of the civilian employed population age 16 years or older in the MSA working in the finance, insurance, or real estate industry, based on the 2006–2010 five-year ACS estimates. ‘Percent education’ is the percentage of the civilian employed population age 16 years or older in the MSA working in education, training, or library occupations, based on the 2006–2010 five-year ACS estimates.
Table 1: Descriptive statistics (data from the 2010 decennial census except as noted)
Variable Mean/percentage Standard deviation Minimum Maximum
White/single-race AIAN D 31.8 12.8 6.5 85.6
White/multiracial AIAN D 23.6 8.1 5.2 55.4
Region
West 35.2 – 0 1
Midwest 18.1 – 0 1
South 36.7 – 0 1
Northeast 9.8 – 0 1
Logged population 12.8 1.2 10.4 16.8
Percent urban 77.6 14.9 33.0 100.0
Percent elderly 13.5 3.4 6.5 27.5
Percent single-race AIAN 2.8 7.2 0.1 75.5
Percent homeowners 65.8 5.4 50.0 78.7
Percent female-headed households 19.0 3.5 9.9 33.1
Military quarters population 220.8 786.9 0.0 9392.4
Median home construction year* 1976.3 8.3 1953 1994
Income ratio* 0.7 0.2 0.2 1.8
Education ratio* 0.5 0.2 0.1 1.7
Percent manufacturing* 10.2 4.6 0.9 26.3
Percent FIRE* 6.2 1.9 3.1 17.0
Percent education* 6.1 1.3 3.8 12.4
4. Results
Table 2 reports the average D values for the full sample and the metropolitan-only sample. Single-race AIANs are more residentially segregated from non-Hispanic whites than multiracial AIANs: 31.8 compared to 23.6, respectively. Limiting the sample to metropolitan areas only shows a similar pattern.
Table 2: Average D values for the full sample and the metropolitan-only sample
Full sample (n = 264 metropolitan and micropolitan statistical areas) Group Average D
Single-race AIANs 31.8 Multiracial AIANs 23.6
Metropolitan statistical areas only (n = 219 metropolitan statistical areas)
Single-race AIANs 33.2 Multiracial AIANs 25.1
Table 3 shows the five most and least segregated MSAs for each of the groups. For both single-race AIANs and multiracial AIANs, the least segregated MSAs are micropolitan areas in Oklahoma, Oregon, and California. Most of these areas have substantial AIAN populations, but none are majority AIAN. (Only one MSA in the sample – the Gallup, NM Micro Area – has a majority single-race AIAN population.) Restricting the sample to metropolitan areas only, the least segregated MSAs are relatively small metropolitan areas, primarily in the West and Midwest. The most segregated MSAs for both groups are primarily large MSAs in the Northeast and Midwest as well as MSAs in Washington, Minnesota, and, especially, Arizona.
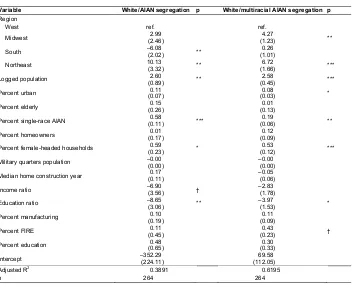
The results of the multivariate analysis are shown in Table 4. Conditional on other variables in the model, single-race AIANs are least segregated from non-Hispanic whites in the South and most segregated from non-Hispanic whites in the Northeast. The Midwest is not statistically significantly different from the West. Regional patterns are somewhat different for multiracial AIANs, with the South not statistically significantly different from the West and both the Midwest and Northeast more segregated than the West.
Demographic Research: Volume 40, Article 33
white education ratio is associated with statistically significantly lower segregation values. The only other coefficient that is statistically significant at the p < 0.05 level is the MSA ‘percent urban’ for multiracial AIANs, which is modestly and positively associated with segregation scores. Two other coefficients reach marginal statistical significance (p < 0.10): A higher single-race AIAN/non-Hispanic white income ratio is associated with lower segregation scores for single-race AIANs, and the MSA ‘percent employed in finance, insurance, and real estate’ is associated with higher segregation scores for multiracial AIANs.
Sensitivity analyses (not shown) suggest some sensitivity to the exclusion of micropolitan areas for both groups.
Table 3: D values for the most and least segregated MSAs in the full sample and metropolitan-only sample
Full sample (n = 264 metropolitan and micropolitan statistical areas) Single-race AIANs
Most segregated Least segregated
Show Low, AZ Micro Area 85.6 Miami, OK Micro Area 6.5
Bemidji, MN Micro Area 68.5 Tahlequah, OK Micro Area 6.9
New York–Northern New Jersey–Long Island, NY–NJ–PA Metro Area
67.8 Muskogee, OK Micro Area 7.5
Flagstaff, AZ Metro Area 65.9 Ada, OK Micro Area 8.0
Yakima, WA Metro Area 65.7 Grants Pass, OR Micro Area 10.4
Multiracial AIANs
Most segregated Least segregated
New York–Northern New Jersey–Long Island, NY–NJ–PA Metro Area
55.4 Red Bluff, CA Micro Area 5.2
Show Low, AZ Micro Area 50.5 Ada, OK Micro Area 6.6
Bridgeport–Stamford–Norwalk, CT Metro Area 44.3 Tahlequah, OK Micro Area 7.6 Milwaukee–Waukesha–West Allis, WI Metro Area 43.0 Duncan, OK Micro Area 7.8 Philadelphia–Camden–Wilmington,
PA–NJ–DE–MD Metro Area
40.9 Albany–Lebanon, OR Micro Area 7.9
Metropolitan statistical areas only (n = 219 metropolitan statistical areas) Single-race AIANs
Most segregated Least segregated
New York–Northern New Jersey–Long Island,
NY–NJ–PA Metro Area 67.8 Jacksonville, NC Metro Area 13.0
Flagstaff, AZ Metro Area 65.9 Joplin, MO Metro Area 13.0
Yakima, WA Metro Area 65.7 Springfield, MO Metro Area 14.3
Tucson, AZ Metro Area 62.3 Medford, OR Metro Area 15.0
Farmington, NM Metro Area 62.2 Eugene–Springfield, OR Metro Area 15.1
Multiracial AIANs
Most segregated Least segregated
New York–Northern New Jersey–Long Island, NY–NJ–PA Metro Area
55.4 Medford, OR Metro Area 10.9
Bridgeport–Stamford–Norwalk, CT Metro Area 44.3 Crestview–Fort Walton Beach–Destin, FL Metro Area 11.5 Milwaukee–Waukesha–West Allis, WI Metro Area 43.0 Missoula, MT Metro Area 11.9 Philadelphia–Camden–Wilmington,
PA–NJ–DE–MD Metro Area 40.9 Joplin, MO Metro Area 12.0
Table 4: OLS regression results predicting index of dissimilarity values
Variable White/AIAN segregation p White/multiracial AIAN segregation p
Region
West ref. ref.
Midwest (2.46)2.99 (1.23)4.27 **
South –6.08(2.02) ** (1.01)0.26
Northeast 10.13(3.32) ** (1.66)6.72 ***
Logged population (0.89)2.60 ** (0.45)2.58 ***
Percent urban (0.07)0.11 (0.03)0.08 *
Percent elderly (0.26)0.15 (0.13)0.01
Percent single-race AIAN (0.11)0.58 *** (0.06)0.19 **
Percent homeowners (0.17)0.01 (0.09)0.12
Percent female-headed households (0.23)0.59 * (0.12)0.53 ***
Military quarters population –0.00(0.00) –0.00(0.00)
Median home construction year (0.11)0.17 –0.05(0.06)
Income ratio –6.90(3.56) † –2.83(1.78)
Education ratio –8.65(3.06) ** –3.97(1.53) *
Percent manufacturing 0.10
(0.19)
0.11 (0.09)
Percent FIRE (0.45)0.11 (0.23)0.43 †
Percent education (0.65)0.48 (0.33)0.30
Intercept –352.29
(224.11)
69.58 (112.05)
Adjusted R2 0.3891 0.6195
n 264 264
Note:*** p < .001; ** p < .01; * p < .05; † p < .1.
5. Limitations and future directions
Demographic Research: Volume 40, Article 33
(e.g., block groups or blocks) or different aggregate units (e.g., limiting to principal cities or other places within MSAs).
Second, other MSA-level factors not considered here may help explain segregation for AIANs. The characteristics included here are based on past research primarily conducted on other racial/ethnic groups; factors unique to, or more salient for, the AIAN population, such as tribal gaming income or changes in racial/ethnic identity (which could be context-dependent [Light and Iceland 2016]), might be relevant to explaining segregation patterns for this group.
Third, a more extensive investigation should be made into the differing segregation patterns for specific multiracial and tribal groups. Specific multiracial groups (e.g., those who identify as both AIAN and African American) may have unique segregation patterns that are obscured by combining all multiracial AIANs into a single group. There could also be differences across AIAN tribal groups (Huyser, Takei, and Sakamoto 2014) and between those who do and do not assert a tribal affiliation (Liebler, Bhaskar, and Porter 2016).
Fourth, examining segregation in non-MSA areas may be particularly important for AIANs relative to other racial/ethnic minorities due to the forced relocation of AIAN populations to rural reservations by European settlers. Although the AIAN population has become more urbanized in recent decades (Fixico 2000) and my sample covers the majority of the 2010 population of the relevant groups, substantial non-MSA populations of AIANs remain, and their distribution and degree of segregation are an important part of explaining overall levels of segregation for this group (Lichter et al. 2007).
Finally, it is important to consider change in segregation over time. This is complicated by changes in tract and MSA boundaries, and particularly complicated in the case of AIANs due to the large-scale shifts in racial identity described above. Some evidence suggests that segregation levels for this group are declining modestly (Iceland, Weinberg, and Steinmetz 2002), but this does not take into account individual-level changes in racial identity. Trends in segregation may be driven by residential mobility, changes in racial identification, fertility and mortality, and changing patterns of mixed-race household formation (Ellis et al. 2012).
6. Acknowledgments
Demographic Research: Volume 40, Article 33
References
Bennett, P.R. (2011). The social position of multiracial groups in the United States:
Evidence from residential segregation. Ethnic and Racial Studies 34(4): 707–
729.doi:10.1080/01419870.2010.527355.
Davis, J.J., Roscigno, V.J., and Wilson, G. (2016). American Indian poverty in the
contemporary United States. Sociological Forum 31(1): 5–28. doi:10.1111/
socf.12226.
Ellis, M., Holloway, S.R., Wright, R., and Fowler, C.S. (2012). Agents of change: Mixed-race households and the dynamics of neighborhood segregation in the
United States.Annals of the Association of American Geographers 102(3): 549–
570.doi:10.1080/00045608.2011.627057.
Fixico, D.L. (2000).The urban Indian experience in America. Albuquerque: University
of New Mexico Press.
Huyser, K.R., Sakamoto, A., and Takei, I. (2010). The persistence of racial disadvantage: The socioeconomic attainments of single-race and multi-race
Native Americans. Population Research and Policy Review 29(4): 541–568.
doi:10.1007/s11113-009-9159-0.
Huyser, K.R., Takei, I., and Sakamoto, A. (2014). Demographic factors associated with
poverty among American Indians and Alaska Natives. Race and Social
Problems 6(2): 120–134.doi:10.1007/s12552-013-9110-1.
Iceland, J., Weinberg, H., and Steinmetz, E. (2002). Racial and ethnic residential segregation in the United States: 1980–2000. Washington, D.C.: US Census Bureau (CENSR-3).
Lee, B.A., Reardon, S.F., Firebaugh, G., Farrell, C.R., Matthews, S.A., and O’Sullivan, D. (2008). Beyond the census tract: Patterns and determinants of racial
segregation at multiple geographic scales.American Sociological Review 73(5):
766–791.doi:10.1177/000312240807300504.
Lichter, D.T., Parisi, D., Grice, S.M., and Taquino, M.C. (2007). National estimates of
racial segregation in rural and small-town America. Demography 44(3): 563–
581.doi:10.1353/dem.2007.0030.
Liebler, C., Bhaskar, R., and Porter, S.R. (2016). Joining, leaving, and staying in the American Indian/Alaska Native race category between 2000 and 2010.
Liebler, C. and Ortyl, T. (2014). More than one million new American Indians in 2000:
Who are they?Demography 51(3): 1101–1130.doi:10.1007/s13524-014-0288-7.
Light, M.T. and Iceland, J. (2016). The social context of racial boundary negotiations: Segregation, hate crime, and Hispanic racial identification in metropolitan
America.Sociological Science 3(4): 61–84.doi:10.15195/v3.a4.
Massey, D.S. and Denton, N.A. (1988). The dimensions of residential segregation.
Social Forces67(2): 281–315.doi:10.1093/sf/67.2.281.
Norris, T., Vines, P., and Hoeffel, E. (2012). The American Indian and Alaska Native population: 2010. Washington, D.C.: US Census Bureau (C2010BR-10). Passel, J.S. (1997). The growing American Indian population, 1960–1990: Beyond
demography. Population Research and Policy Review 16(1–2): 11–31.
doi:10.1023/A:1005724610787.
Reardon, S.F. and Townsend, J.B. (2018). SEG: Stata module to compute multiple-group diversity and segregation indices [software]. Boston: Boston College
Department of Economics.https://ideas.repec.org/c/boc/bocode/s375001.html.
Roberto, E. and Hwang, J. (2017).Barriers to integration: Institutionalized boundaries
and the spatial structure of residential segregation. Paper presented at the
Annual Meeting of the Population Association of America, Chicago, Illinois, April 27–29, 2017.
Rugh, J. and Massey, D. (2014). Segregation in post-civil rights America: Stalled
integration or end of the segregated century? Du Bois Review 11(2): 205–232.
doi:10.1017/S1742058X13000180.
Snipp, C.M. (1989).American Indians: The first of this land. New York: Russell Sage.
Snipp, C.M. (1992). Sociological perspectives on American Indians.Annual Review of
Sociology18: 351–371.doi:10.1146/annurev.so.18.080192.002031.
Thornton, R. (1997). Tribal membership requirements and the demography of ‘old’ and
‘new’ Native Americans.Population Research and Policy Review 16(1–2): 33–
42.doi:10.1023/A:1005776628534.
Wilkes, R. (2003). The residential segregation of Native Americans in US metropolitan
areas. Sociological Focus 36(2): 127–142. doi:10.1080/00380237.2003.
10570720.
Wilkes, R. and Iceland, J. (2004). Hypersegregation in the twenty-first century.