Available Online at www.ijpret.com 284
INTERNATIONAL JOURNAL OF PURE AND
APPLIED RESEARCH IN ENGINEERING AND
TECHNOLOGY
A PATH FOR HORIZING YOUR INNOVATIVE WORK
QUANTIFICATION AND IDENTIFICATION OF VITREOUS HEMORRHAGE
DISEASEUSING DIGITAL IMAGE PROCESSING BY OTSU METHOD
VIVEK J. NAGALKAR
M.E.in Computer Science and Engineering
Accepted Date: 05/03/2015; Published Date: 01/05/2015
\
Abstract: The Diabetic retinopathy can be find out using the Otsu method. The Otsu method can be used on the fundus images which are taken for the detection of the Vitreous Hemorrhage. The Fundus images taken are used for finding the Vitreous Hemorrhage which is caused by delicate new blood vessels bleed into the vitreous. The detection of the Vitreous Hemorrhage is manually by the retina specialist without any software support; hence the detection accuracy depends on the experience of the retina specialist himself. This Technique will help doctors to find the Vitreous Hemorrhage with the maximum accuracy.
Keywords: Diabetic retinopathy, Fundus Images, Vitreous Hemorrhage.
Corresponding Author: MR. VIVEK J. NAGALKAR
Access Online On:
www.ijpret.com
How to Cite This Article:
Available Online at www.ijpret.com 285 INTRODUCTION
Diabetic Retinopathy
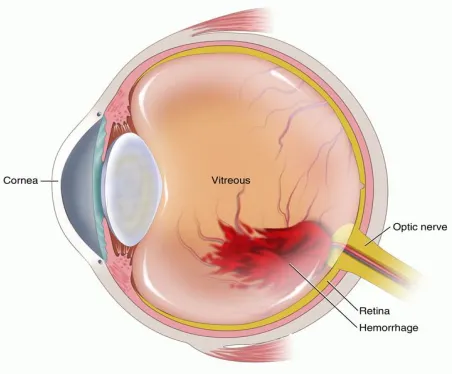
Diabetic related eye diseases are the commonest cause of vision defects and blindness in the developed countries. Monitoring the health of the retina is important for those people with signs of diabetic retinopathy (DR). Vitreous Hemorrhage delicate new blood vessels bleed into the vitreous of abnormal retinas and are one of the most prevalent lesions at the early stages of diabetic retinopathy. Color fundus images are used to detect Vitreous Hemorrhage in retinal images. Figure 1.1 shows a unhealthy retina with its main features and Hemorrhage.
Manual detection of Hemorrhage by retinopathy specialist doctors as they have to spend a great deal of time in the analysis and diagnosis of retinal photographs. The technique for Hemorrhage detection has great significance in saving cost, time and labor. Image processing techniques for Hemorrhage detection can help in extracting the location, size and severity grade of Hemorrhage in the retinal images.
Diabetic retinopathy, the most common diabetic eye disease, occurs when blood vessels in the retina change. Sometimes these vessels swell and leak fluid or even close off completely. In other cases, abnormal new blood vessels grow on the surface of the retina. Diabetic retinopathy usually affects both eyes. People who have diabetic retinopathy often don't notice changes in their vision in the disease's early stages. But as it progresses, diabetic retinopathy usually causes vision loss that in many cases cannot be reversed [7].
Available Online at www.ijpret.com 286 Proliferative diabetic retinopathy (PDR), it is type of Diabetic Retinopathy, mainly occurs when many of the blood vessels in the retina close, preventing enough blood flow. In an attempt to supply blood to the area where the original vessels closed, the retina responds by growing new blood vessels.
The Vitreous Hemorrhage it is type of Proliferative diabetic retinopathy (PDR), it delicate new blood vessels bleed into the vitreous the gel in the center of the eye preventing light rays from reaching the retina. If the vitreous hemorrhage is small, you may see a few new, dark floaters. A very large hemorrhage might block out all vision, allowing you to perceive only light and dark. Vitreous hemorrhage alone does not cause permanent vision loss. When the blood clears, your vision may return to its former level unless the macula has been damaged.
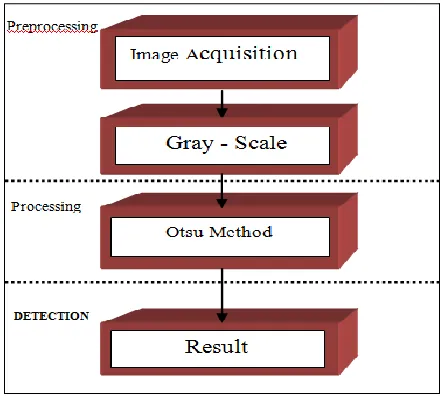
2. FLOW CHART
Figure 2.1:- Flow Chart
3. EXPERIMENTAL DETAILS
The proposed system is based on the following three parts that are as follows
1. Preprocessing 2. Processing 3. Detection
3.1 Preprocessing
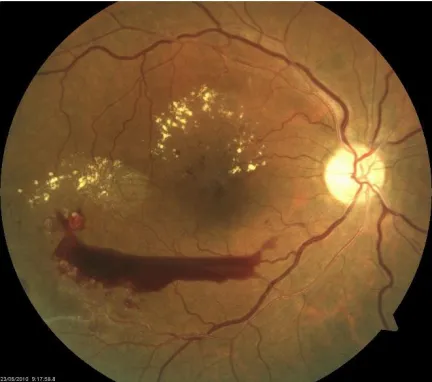
Available Online at www.ijpret.com 287 Image is acquired from fundus camera. Fundus photography, the creation of a photograph of the interior surface of the eye, including the retina, optic disc, macula, and posterior pole. Here, database images are used.
3.1.2 Gray-Scale Image:-
The images received from the Fundus Camera must be converted to the Gray scale image because though the images are in gray matter the Red Green Blue components are not visible in the image. Thus removing of this RGB component will help to perform the operations easily. This RGB images are converted to grayscale images by eliminating the hue and saturation information while retaining the luminance. Thus making the property of the image 2196 x 1958 x 3 to 2196 x 1958.
3.2Processing
3.2.1 Otsu Method:-
Otsu's method is used to automatically perform histogram shape based image thresholding, or the reduction of a graylevel image to a binary image. The algorithm assumes that the image to be thresholded contains two classes of pixels or bi-modal histogram then calculates the optimum threshold separating those two classes so that their combined spread is minimal. Thresholding is a simple but effective method to separate objects from the background.
[2] [3] [4] [5] Otsu’s thresholding technique is based on a discriminate analysis which partitions the image into two classes C1and C2 at gray level t such that C1={0,1,2,..t} and C2 = {t +1,t + 2, L
-1}, where L is the total number of the gray levels of the image. Let the number of pixels at the ith gray level be , and n be the total number of pixels in a given image. The probability of occurrence of gray level i is defined as
C1 and C2 are normally corresponding to the object of interested and the background, the probabilities of the two classes are and
Available Online at www.ijpret.com 288 Let and be the between-class variance and total variance respectively. An optimal threshold t can be obtained by maximizing the between-class variance.
Where, the between class variance and total variance are defined as:
The total mean of the whole image is defined as:
An equivalent, but simpler formula for obtaining optimal threshold is as follows:
Otsu’s method of thresholding gray level images is efficient for separating an image into two classes where two types of fairly distinct classes exist in the image.
3.3Detection
Available Online at www.ijpret.com 289 Figure 3.3.1(a) Input Image
Figure 3.3.1(b) Histogram of image
Available Online at www.ijpret.com 290 4. Conclusion
The Vitreous Hemorrhage can be found precisely according to the length, breadth and the exact position of the infected area by the Otsu method. This technique can help the doctors for the analysis of Vitreous Hemorrhage.
REFERENCES
1. Hans S.A., Bawab S.Y., Woodhouse M. “Vitreous strain during saccadic movements in an infant eye computational model”, 4th International Conference Biomedical Engineering and Informatics (BMEI), (2011).
2. Jun Zhang, Jinglu Hu “Image Segmentation based on 2D Otsu Method with Histogram analysis”, International Conference on Computer Science and Software Engineering (2008).
3. Chen Yu, Chen Dian-ren, Yang Xu, Chen Lei “Otsu's thresholding method based on gray level-gradient two-dimensional histogram” 2nd International Asia conference on Informatics in Control, Automation and Robotics ( 2010 ).
4. Zhexue Li, Sangwoon Kim “A modification of Otsu's method for detecting eye positions”, 3rd International Congress on Image and Signal Processing (CISP), 2010
5. Liu Jianzhuang, Li Wenqing, Tian Yupeng “Automatic thresholding of gray-level pictures using two-dimension Otsu method”, International Conference on Circuits and Systems, ( 1991).
6. Brigitta Nagy, Balint Antal, Balazs Harangi, Andras Hajdu, “Ensemble-based exudate detection in color fundus Images”, 7th International Symposium on Image and Signal Processing and Analysis (ISPA 2011).
7. Clara I. S´anchez, Meindert Niemeijer, Thessa Kockelkorn, Michael D. Abr`amoff, Bram van Ginneken, “Active Learning Approach for Detection of Hard Exudates, Cotton Wool Spots and Drusen in Retinal Images”(2011).
8. Juszczak, P., Learning to recognise, PhD thesis, Delft University, the Netherlands (2006).
9. World Health Organization (WHO) report, “Strategic Plan for Vision 2020: The Right to sight”www.searo.who.int/linkfiles/publications_sea-ophthal-117.pdf (2000).
Available Online at www.ijpret.com 291 11.Rudra Pratap, “Getting Started with MATLAB 7: A Quick Introduction for Scientists and Engineers”, Oxford University Press, USA, 04-Aug-2005.
12.“Understanding eye conditions related to diabetes”, RNIB Publishing.
13.Joes Staal, Associate Member, IEEE, Michael D. Abràmoff, Member, IEEE, Meindert Niemeijer, Max A. Viergever, Member, IEEE, and Bram van Ginneken, Associate Member, IEEE, “ Ridge-Based Vessel Segmentation in Color Images of the Retina”, IEEE TRANSACTIONS ON MEDICAL IMAGING, VOL. 23, NO. 4, APRIL 2004.