Abstract
The objective of many laboratory-germination experiments is to develop insight into the process of field establishment. It is relatively difficult, however, to infer potential field response from laboratory data given the enormous spatial and temporal variability in seedbed microclimate. Previous studies have attempted to survey large numbers of alternat- ing day/night temperature regimes in order to estimate ger- mination response to potential conditions of field microcli- mate. The objectives of this study were to estimate the errors associated with prediction of variable-temperature germina- tion response from fewer, constant-temperature germination data. Non-dormant seeds of thickspike wheatgrass [Elymus lanceolatus (Scribn. and J.G. Smith) Gould], bluebunch wheatgrass [Pseudoroegneria spicata (Pursh) Löve], Sandberg bluegrass (Poa sandbergii Vasey), and bottlebrush squirreltail [Elymus elymoides (Raf.) Swezey] were germinated under constant, alternating-constant and sine-wave temperature regimes. Predicted and measured cumulative-germination response generally coincided to within a day for most temper- ature treatments except for the most slowly germinating sub- populations of seeds. Thermal response models can be para- meterized from relatively few experimental data but provide predictive inferences relevant to a wide number of variable- temperature conditions.
Key Words: seed, model, rate
Most research concerning germination response of cool- season range grasses has been conducted under either con- stant or alternating-constant temperature conditions (Wester 1991). Alternating-constant temperature experi- ments can mimic diurnal temperature fluctuation in the seedbed but a comprehensive survey of potential germina- tion response requires that a large number of treatment combinations be tested (Young and Evans 1982). An alter-
native approach is to develop predictive models for esti- mating variable-temperature germination response (Garcia- Huidobro et al. 1982b, Benech Arnold et al. 1990, Roundy and Biedenbender 1996). Such models can be developed from constant-temperature germination data if it is assumed that instantaneous germination rate is independent of diurnal temperature pattern (Garcia-Huidobro et al.
1982b, Benech Arnold et al. 1990). This assumption may not be correct for species that require fluctuating-tempera- ture conditions to release dormancy (Thompson 1974, Thompson and Grime 1983, Murdoch et al. 1989, Benech Arnold et al. 1990). Application of thermal response mod-
J. Range Manage.
52:83–91 January 1999
Predicting variable-temperature response of non-dormant seeds from constant-temperature germination data
STUART P. HARDEGREE, STEVEN S. VAN VACTOR, FREDERICK B. PIERSON AND DEBRA E. PALMQUIST
Authors are plant physiologist, hydrologist, and hydrologist, USDA-ARS, Northwest Watershed Research Center, 800 Park Blvd., Plaza IV, Suite 105, Boise, Ida. 83712 and mathematician, USDA-ARS, Landscape Ecology of Rangelands Research Unit, 920 Valley Rd., Reno, Nev. 89512.
Resumen
El objetivo de muchos estudios de germinación conducidos en laboratorio es desarrollar una visión del proceso de establecimiento en el campo. Sin embargo, debido a la gran variabilidad espacial y temporal del microclíma de la cama de siembra, es relativamente díficil predicir la respuesta potencial en campo a partir de información de laboratorio.
Estudios previos han intentado investigar un gran número de rgimenes de temperaturas alternantes, día noche, para esti- mar la respuesta de germinación a las condiciones potenciales del microclíma en el campo. Los objetivos del presente estu- dio fueron estimar los errores asociados con la predicción de la respuesta de la germinación a temperaturas variables a partir de unos pocos datos de germinación a temperatura constante. Semillas no dormantes de Thickspike wheatgrass [Elymus lanceolatus (Scrinbn. and J.G. Smith)Gould], blue- bunch wheatgrass [Pseudoroegneria spicata (Pursh ) Löve ], sandberg bluegrass (Poa sandbergii Vasey.), y bottlebrush squirreltail [Elymus elymoides (Raf) Swezey ] fueron germi- nadas bajo régimenes de temperatura constante, constante- alternante y seno-onda. La respuesta predicha y medida de germinación acumulativa generalmente coinciden dentro de un dia para la mayoría de tratamientos de temperatura, excepto para la mayoría de subpoblaciones de semillas de muy lenta germinación. Los par metros para desarrollar los modelos de respuesta a la temperatura pueden ser obtenidos a partir de relativamente poca información experimental y pueden proveer inferencias predictivas relevantes de un amplio nmero de condiciones variables de temperatura.
Funding provided in part by the Bureau of Land Management, Intermountain Greenstripping and Rehabilitation Research Project, under interagency agreement USDI/BLM 60-91H2-8-0020. Mention of a trademark name or proprietary product does not constitute endorsement by the USDA and does not imply its approval to the exclusion of other products that may also be suitable.
Manuscipt accepted 23 May 1998.
els to rangeland grass species has received relatively little attention in the literature (Jordan and Haferkamp 1989, Roundy and Biedenbender 1996). Roundy and Biedenbender (1996) used constant-temperature ger- mination data to predict median ger- mination response of 8 warm-season grasses under 3 variable-temperature regimes. Predicted and measured median germination times in their study averaged within 0.6, 1.3, and 3.6 days for thermal regimes representa- tive of summer, spring, and winter, respectively.
The purpose of this study was to evaluate variable-temperature effects on the cumulative-germination response of 4 cool-season range grass- es. We hypothesized that cumulative- germination response under alternat- ing-constant and sine-wave tempera- ture patterns could be predicted from constant-temperature germination data. Calibration of thermal models would make it possible to predict cumulative-germination response under a wide number of potential field-temperature regimes without having to survey large numbers of alternative thermal treatments. The species in question, thickspike wheat- grass [Elymus lanceolatus (Scribn.
and J.G. Smith) Gould], bluebunch wheatgrass [Pseudoroegneria spicata (Pursh) Löve], Sandberg bluegrass (Poa sandbergii Vasey) and bottle- brush squirreltail [Elymus elymoides (Raf.) Swezey], were selected because they have been identified by the United States Department of the Interior, Bureau of Land Management as high-priority species for restoration of deteriorated rangelands in the Great Basin and Columbia Plateau.
Materials and Methods
Seeds for this experiment were pur- chased from Stevenson seed company (Ephraim, Ut.) which collected the seeds in 1991. Air-dry seeds were stored in cloth bags at room tempera- ture during the course of the study.
Two experiments were conducted to evaluate variable-temperature effects on germination response. Experiment
1 was conducted between Oct. 1992 and Feb. 1993 to measure germination response under constant, alternating- constant and sine-wave temperature patterns. Experiment 2 was conducted between July 1993 and Nov. 1993 to measure germination response at con- stant temperature and under sine-wave temperature patterns of different amplitude.
Germination experiments were con- ducted inside 15 programmable envi- ronmental chambers (Hardegree and Burgess 1995). These chambers con- sisted of small refrigerators that were enhanced with incandescent and fluo- rescent lights, fans, and electrical resistance heaters. An electronic data acquisition/control system maintained temperature control to within ± 0.5°C.
Chamber lights were programmed to have a 12 hour photoperiod. The tem- perature inside each box was moni- tored every 10 seconds for purposes of temperature control and an average temperature calculated and recorded for every 15 minute period.
In Experiment 1, separate environ- mental chambers were programmed to maintain constant temperatures in 5°
increments between 5 and 35°C; alter- nating-constant night/day temperature regimes of 5/15, 10/20, 15/25, 20/30, and 25/35°C; and sine-wave patterns with an amplitude of 10°C and mean daily temperatures of 10, 15, 20, 25, and 30°C. In Experiment 2, environ- mental chambers were programmed to simulate constant temperatures in 5°
increments between 5 and 35°C; and sine-wave patterns with a mean tem- perature of either 15, 20, or 25°C and temperature amplitudes of either 5, 10, 15, or 20°C. Each thermal regime was replicated 3 times in different germi- nators. As there were 17 separate ther- mal regimes in Experiment 1 and 19 in Experiment 2, all replicate treat- ments could not be evaluated simulta- neously. Treatment order was random- ized and treatments were evaluated in groups of 15 until all had been repli- cated 3 times.
Seeds were germinated on a cellu- lose dialysis membrane at the bottom of germination cups that were in con- tact with a water reservoir inside a clear-plastic snap-top vial (Hardegree
and Emmerich 1992). Free water on top of the membrane was kept to a minimum by controlling the height of water in the reservoir and by daily suction when necessary.
One vial of each species was arranged randomly within each of 6 replicated blocks inside each germina- tion chamber. Thirty seeds of each species (35 seeds for Sandberg blue- grass) were placed in each germina- tion cup and dusted with Daconil fungicide (2,4,5,6-tetrachloro-1,3-ben- zenedicarbonitrile, wettable powder) at the beginning of a given experimen- tal run. Additional fungicide was applied if the seeds developed fungal growth during the experiment.
Germination vials were monitored daily for 21 days and seeds counted and removed when they exhibited radicle extension ≥2 mm.
Characterization of Subpopulation Germination Rates at Constant Temperature
The constant-temperature germina- tion data were used to develop regres- sion equations for estimating germina- tion response under the alternating- constant and sine-wave temperature regimes. Cumulative-germination per- centages were calculated for every combination of species and treatment for every day. The cumulative data were numerically transformed by dividing germination percentages by a scaling factor (Ellis et al. 1986). The scaling factor was equal to the maxi- mum-mean-germination percentage achieved in the most favorable tem- perature treatment for that species.
This transformation adjusted germina- tion percentages for each species to a common scale with a maximum value of 100%. The scaling factors were 0.95 for thickspike wheatgrass, 0.91 for bluebunch wheatgrass, 0.82 for Sandberg bluegrass and 0.86 for bot- tlebrush squirreltail. Germination counts were pooled by species within each germinator box and the 3 within- box averages considered treatment replicates for model development and analysis.
For modeling purposes, the seed population was considered to be com- posed of subpopulations based on rel-
ative germination rate (Garcia- Huidobro et al. 1982a). Days required to achieve 5, 10, 15, 20, 25, 30, 35, 40, 45, 50, 55, 60, 65, 70, 75, 80, 85, 90 and 95% germination were calcu- lated for each species and treatment by interpolating between points on the cumulative-germination curves (Covell et al. 1986). It was assumed that the seeds in a given population germinate in the same relative order, regardless of thermal environment (Garcia-Huidobro et al. 1982a).
Inverse days required to achieve a given germination percentile, there- fore, was considered to equal the per- day germination rate of the subpopula- tion represented by the percentile ranking (Garcia-Huidobro et al.
1982a).
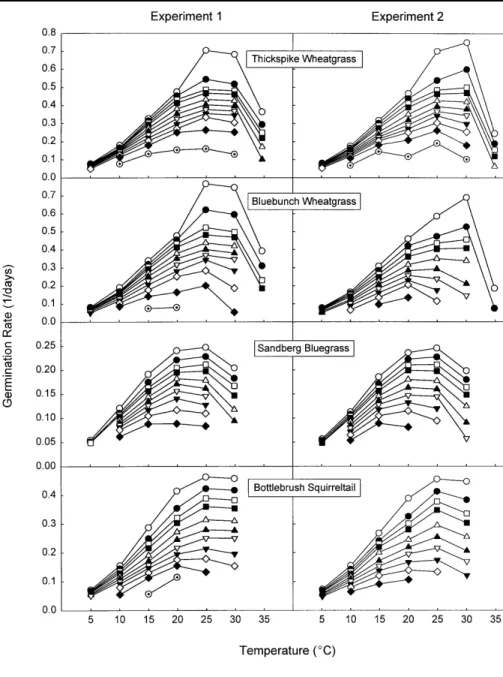
Germination rates for each species and subpopulation were plotted as a function of temperature (Fig. 1). The relationship between germination rate and temperature appeared to be rela- tively linear for most species and sub- populations in the suboptimal temper- ature range of 5 to 20°C. The excep- tion was for Sandberg bluegrass which exhibited nonlinearity in the slower germinating subpopulations above 15°C. Linear equations were calculat- ed from the suboptimal temperature data relating germination rate (day-1) to temperature for all species and sub- populations. Suboptimal linear regres- sions were extrapolated to the x-axis to obtain a value for the base tempera- ture at which subpopulation germina- tion rate was estimated to be zero (Arnold 1959).
Germination rate could not be calcu- lated for subpopulations that exhibited zero germination during the 21-day test period. Lack of data for many sub- populations made it difficult to devel- op a uniform approach to characteriz- ing supraoptimal temperature response. Supraoptimal temperature response, however, was clearly non- linear (Fig. 1). Thermal response above 20°C (15°C for Sandberg blue- grass) was characterized by a series of linear equations used to interpolate between constant-temperature germi- nation rates in 5°C increments.
Estimation of Variable-Temperature Response
A hypothetical example illustrates the procedure used to estimate cumula- tive-germination response in the vari- able-temperature treatment regimes. If subpopulation “a” requires 10 days to germinate at 10°C then its per-day germination rate will be 0.1 day-1 and it will progress 10% of the way toward germination for every day that it spends at 10°C. If the per-day ger- mination rate at 10°C is 0.1 day-1then the germination rate for a 15-minute
period is equal to the per-day rate divided by 96 (the number of 15- minute intervals in a day). Sub- population “a” would, therefore, progress 1.042% toward germination during a 15-minute interval at 10°C. If one assumes that the instantaneous ger- mination rate of a given subpopulation is independent of thermal history, then progress toward germination can be predicted by the running sum of germi- nation rate estimates for each 15- minute interval. Germination of the subpopulation should occur when the
Fig. 1. Germination rate as a function of species, experiment, temperature and subpopulation for the constant-temperature treatments. For clarity only the 5 (❍), 10 (●), 15 (❒), 20 (■), 30 (∆), 40 (▲), 50 (∇∇), 60 (▼), 70 (◊◊), 80 (♦♦) and 90% (⊕⊕) subpopulations are represented.
running sum of these values reaches 1.
All environmental chambers were programmed to repeat the same tem- perature pattern every day. Average temperature over a given 21-day ther- mal treatment was calculated for each 15-minute interval of the diurnal tem- perature cycle. The germination rate for each 15-minute temperature inter- val was calculated for each species and subpopulation from the appropri- ate regression equations that were derived from the constant-temperature data. These 15-minute rate estimates were aggregated to produce a total daily (per-day, day-1) germination rate for each combination of species, sub- population, and variable-temperature thermal regime. The predicted time of germination (days) was determined to be the inverse of the aggregated per- day germination rate (Roundy and Biedenbender 1996). Some of the variable-temperature treatments over- lapped temperature ranges for which constant-temperature germination was equal to zero. Germination times were not predicted for subpopulation-treat- ment combinations that were outside of the modeled-temperature range.
Results
Per-day germination rate across all subpopulations followed a general pat- tern. Germination rates were low at 5°C, increased with increasing tem- perature to a maximum in the 20–30°C range, and showed a rela-
tively rapid decline at supraoptimal temperatures (Fig. 1). Peak germina- tion rates tended to occur at relatively higher temperatures for the more rapidly germinating subpopulations.
All subpopulations exhibited approxi- mately linear, suboptimal temperature response over the temperature range of 5 to 20°C except for Sandberg blue- grass. Linear regression equations were derived for the data in this tem- perature range (5 to 15°C for Sandberg bluegrass) and base temper- atures calculated by extrapolation to the temperature at which germination rate was estimated to be zero. Base temperature estimates tended to decrease with subpopulation but became highly variable for the most slowly germinating seeds (Fig. 2).
Suboptimal linearization of tempera- ture response resulted in a general lack of model fit for the 5° constant-tem- perature treatments (Fig. 3). We believe that this lack of fit was caused by non-linearity of germination rate response at low temperature. The sub- optimal-temperature models were recalculated using the same piece-wise linear interpolation procedure that was used for the supraoptimal temperature range. This approach greatly improved model fit for temperature regimes that included time spent in the 5 to 10°C
Fig. 2. Base temperature of thickspike wheatgrass [Expt. 1 (❍), Expt. 2 (●)], bluebunch wheat- grass [Expt. 1 (❒), Expt. 2 (■)], Sandberg bluegrass [Expt. 1 (∆), Expt. 2 (▲)] and bottlebrush squirreltail [Expt. 1 (◊◊), Expt. 2 (♦♦)] as a function of subpopulation. Base temperatures were estimated by extrapolation of suboptimal germination rates (Fig. 1) to the temperature at which germination rate was estimated to be zero.
Fig. 3. Measured days to germinate (∆), predicted days to germinate in the constant –5 ˚C treat- ment for thickspike wheatgrass from the suboptimal-linear model (❒), and predicted days to germinate form the piecewise-linear model (❍). Error bars represent ±1 standard error.
range (Fig. 3). All further analyses were conducted on data residuals cal- culated from the piece-wise linear approach.
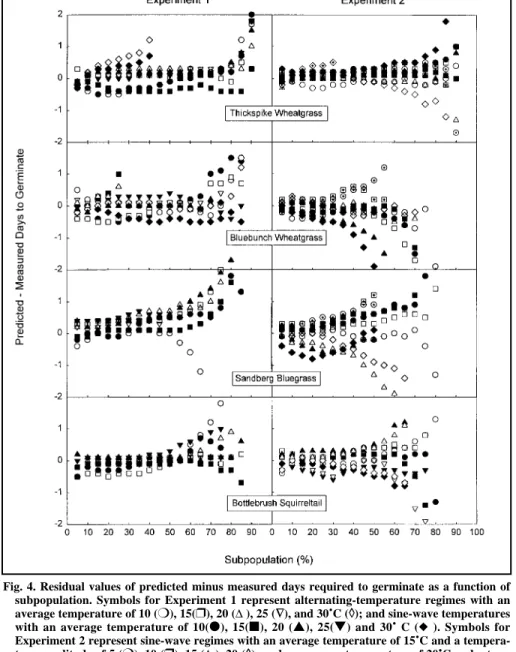
The residual values for predicted minus measured cumulative-germina- tion response across all species, vari- able-temperature treatments and sub- populations are shown in Figure 4.
The majority of predicted germination times corresponded to within a day of measured values. Model fit decreased in some of the slower-germinating subpopulations (Fig. 4, Tables 1, 2).
Tables 1 and 2 present mean residual values for germination time (days) averaged across subpopulations in the 5–50% and >50% subpopulation ranges. Mean model fit for most species and treatments was less than
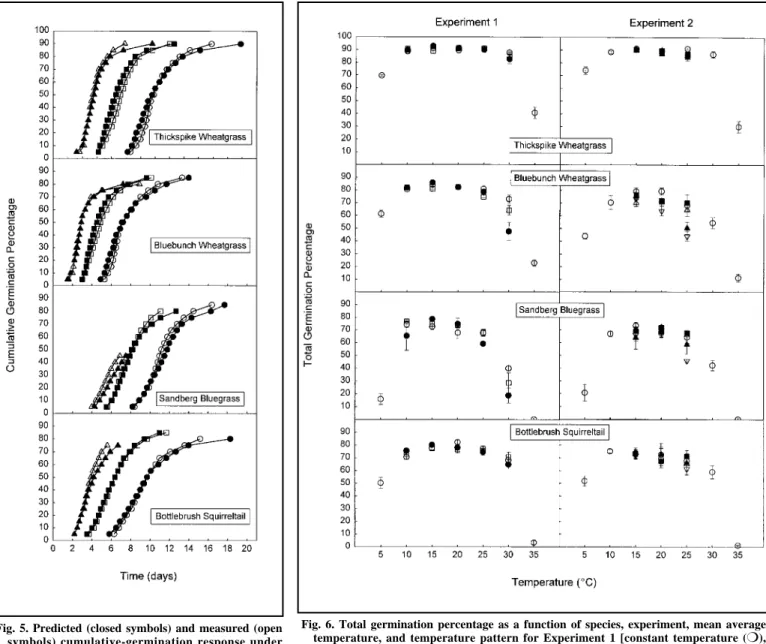
0.5 days for subpopulations in the 5–50% range but was as much as sev- eral days for some species and treat- ments in the later-germinating subpop- ulations. Figure 5 shows a graphical comparison of predicted and actual cumulative-germination response of some of the alternating-constant tem- perature treatments in Experiment 1.
Total germination percentage after 21 days as a function of temperature followed a similar pattern for all species and treatments (Fig. 6). A rela- tively high percentage of seeds germi- nated across the intermediate tempera- ture range with reduced germination in the extreme high and low-tempera- ture treatments. Some of the variable- temperature treatments of bluebunch wheatgrass and Sandberg bluegrass
exhibited reduced germination for some of the higher average-tempera- ture treatments (Fig. 6).
Discussion
Models for calculating thermal response of seed germination have been developed for many agricultural species but there has been little model validation under variable-temperature conditions (Garcia-Huidobro et al.
1982b). Thermal response models have been used to compare germina- tion response of several rangeland species but not for the specific pur- pose of predicting the time course of cumulative germination under variable temperature regimes (Jordan and
Table 1. Mean residual (predicted - measured) values of germination time (days) for Experiment 1 as a function of species, temperature pattern and average temperature. Residual values were averaged separately for subpopulations ≤50% and subpopulations > 50%. Positive values indicate that measured germination was faster than predicted. Values in parentheses represent 1 standard error of the mean.
Species Temp Average Temperature (˚C)
Pattern 10 15 20 25 30 10 15 20 25 30
(5-50% Subpopulations) (50% + Subpopulations) --- (days) --- --- (days) --- Thickspike alt –0.4(0.05) 0.1(0.02) 0.2(0.04) 0.1(0.04) 0.5(0.14) 0.5(0.20) 0.3(0.22) 0.3(0.10) 0.6(0.23) –
sin –0.3(0.03) -0.3(0.04) 0.1(0.03) 0.0(0.02) 0.3(0.10) 0.4(0.24) -0.2(0.08) 0.5(0.17) 0.4(0.21) – Bluebunch alt –0.3(0.05) 0.1(0.06) 0.2(0.06) 0.1(0.01) 0.3(0.20) 0.8(0.22) 0.5(0.36) 0.0(0.09) 0.6(0.43) – sin –0.3(0.06) –0.3(0.05) 0.0(0.03) –0.1(0.02) 0.3(0.10) 0.4(0.16) –0.4(0.05) 0.2(0.17) –0.2(0.29) –
Sandberg alt –0.1(0.05) 0.4(0.02) 0.4(0.08) 0.3(0.03) – –1.7(0.71) 1.5(0.46) 1.2(0.22) – –
sin 0.1(0.09) 0.0(0.03) 0.4(0.04) 0.5(0.04) – 0.9(0.19) 0.6(0.23) 1.5(0.28) – –
Squirreltail alt –0.1(0.06) –0.4(0.04) 0.0(0.02) 0.0(0.02) – 1.5(0.72) 0.6(0.53) 0.7(0.27) 0.1(0.03) –
sin –0.2(0.04) –0.1(0.01) 0.1(0.01) 0.1(0.03) – 0.9(0.46) –0.2(0.09) 0.2(0.08) 0.7(0.10) –
Table 2. Mean residual (predicted - measured) values of germination time (days) for Experiment 2 as a function of species, average temperature and temperature amplitude. Residual values were averaged separately for subpopulations ≤50% and subpopulations > 50%. Positive values indicate that measured germination was faster than predicted. Values in parenthese represent 1 standard error of the mean. An asterick indicates a single subpopulation reporting.
Species Avg. Temperature Amplitude (˚C) Temp.
(˚C) 5 10 15 20 5 10 15 20
(5-50% Subpopulations) (50% + Subpopulations) --- (days) --- --- (days) ---
Thickspike 15 –0.2(0.02) 0.0(0.01) 0.0(0.01) 0.0(0.04) 0.0(0.07) 0.3(0.12) –0.3(0.15) –0.8(0.26)
20 0.2(0.02) 0.1(0.02) 0.1(0.01) 0.2(0.03) 0.4(0.10) 0.1(0.04) 0.2(0.09) 1.5(0.76)
25 0.1(0.01) 0.2(0.02) 0.0(0.07) 0.3(0.08) 0.1(0.26) –0.5(0.78) – –
Bluebunch 15 –0.3(0.02) –0.1(0.03) 0.0(0.01) –0.1(0.06) –0.5(0.29) –2.0(0.97) –0.4(0.08) –0.1(0.07)
20 –0.1(0.02) 0.0(0.02) –0.5(0.09) –0.7(0.18) –0.7(0.29) –0.5(0.28) –1.5(*) –2.5(*)
25 0.3(0.08) 0.3(0.05) –0.1(0.08) 0.2(0.12) 1.1(*) 0.2(*) – –
Sandberg 15 –0.1(0.03) 0.2(0.03) –0.6(0.10) –0.3(0.09) –0.3(0.21) 0.7(0.16) –3.1(0.92) –1.8(0.39)
20 0.3(0.05) 0.4(0.06) –0.4(0.06) –0.4(0.09) 1.0(0.20 1.2(0.35) – –
25 0.5(0.08) 0.5(0.11) – – – – – –
Squirreltail 15 0.1(0.07) –0.1(0.03) –0.3(0.04) –0.2(0.07) 0.0(0.26) 0.6(0.17) –0.3(0.03) –1.0(0.33)
20 0.1(0.02) 0.2(0.03) –0.2(0.05) –0.1(0.05) –0.3(0.29) 0.5(0.08) –0.7(0.10) –0.5(0.10)
25 0.3(0.03) 0.2(0.04) – – 1.0(0.18) 0.8(0.17) – –
Haferkamp 1989, Romo and Eddleman 1995, Roundy and Biedenbender 1996). Wester’s (1991) survey of the range literature on seed germination documents a previous emphasis on the calculation of germi- nation indices for treatment compar- isons rather than predictive inference.
Young and Evans (1982) summarized an extensive body of their previous work measuring germination response of range grass species to alternating- temperature regimes but their data emphasizes total germination percent- age rather than germination rate.
Thermal response models of the type
described in the current study could be used to expand our level of inference to predict differences in cumulative germination under an unlimited num- ber of potential field temperature sce- narios (Garcia-Huidobro et al. 1982a).
The germination-rate response to temperature found in our study con- forms to the general pattern found in previous experiments (Garcia- Huidobro 1982a, Covell et al. 1986, Benech Arnold et al. 1990).
Subpopulation-germination rates tend- ed to increase in a relatively linear fashion up to an optimal temperature, above which they declined rapidly
(Fig. 1). Our data are also similar to those shown in previous studies in that optimal temperatures for maximum germination rate tended to decrease for later-germinating subpopulations (Covell et al. 1986, Garcia-Huidobro et al. 1982a).
Previous authors have accepted sev- eral assumptions about thermal- response data in order to simplify analysis and to facilitate comparisons among seedlots. Common assump- tions include the following: subpopu- lations within a given seedlot share the same base temperature; germination rate response is linear over the subop- timal temperature range; germination rate response is linear over the supraoptimal temperature range;
instantaneous germination rate is inde- pendent of temperature pattern; instan- taneous germination rate is indepen- dent of thermal history; and subpopu- lations maintain their relative germi- nation rate regardless of the thermal environment to which they are sub- jected (Garcia-Huidobro et al. 1982a, Covell et al. 1986, Benech Arnold et al. 1990, and Probert 1992).
We found significant differences in base temperature estimates as a func- tion of subpopulation (Fig. 2).
Previous studies have measured the same phenomenon (Garcia-Huidobro et al. 1982a) but most conclude that the assumption of a common base temperature is still useful (Covell et al. 1986, Carberry and Campbell 1989, Benech Arnold et al. 1990). A common base temperature makes it possible to develop a single equation for predicting the thermal-time requirements of all subpopulations in the suboptimal temperature range (Washitani 1985, Covell et al. 1986, Ellis et al. 1987, Benech Arnold et al.
1990). Equation coefficients can then be used as an objective tool for com- paring seedlots (Covell et al. 1986, Ellis et al. 1986). If the base tempera- ture assumption is false, however, thermal accumulation for a given tem- perature regime must be calculated separately for each subpopulation.
Temperatures near the base tempera- ture have a relatively large influence on germination times as the tempera- tures above the base are inversely
Fig. 4. Residual values of predicted minus measured days required to germinate as a function of subpopulation. Symbols for Experiment 1 represent alternating-temperature regimes with an average temperature of 10 (❍), 15(❒), 20 (∆), 25 (∇∇), and 30˚C (◊◊); and sine-wave temperatures with an average temperature of 10(●), 15(■), 20 (▲), 25(▼) and 30˚ C (◆ ). Symbols for Experiment 2 represent sine-wave regimes with an average temperature of 15˚C and a tempera- ture amplitude of 5 (❍), 10 (❒), 15 (∆), 20 (◊◊); and an average temperature of 20˚C and a tem- perature amplitude of 5(●), 10 (■), 15 (▲) and 20 (♦♦) ˚C; and an average temperature of 25˚C and a temperature amplitude of 5 ( ⊕⊕), 10 ( ), 15 ( ) and 20 ( ) ˚C.
related to germination rate (Bierhuizen and Wagenvroot 1974).
We chose not to accept the common- base-temperature assumption because model fit was more important than computational efficiency.
Many previous models assume lin- earity of germination rate at both sub- and supraoptimal temperatures.
Acceptance of this assumption simpli- fies the experimental design for obtaining model data (Covell et al.
1986, Ellis et al. 1986, 1987). We did not have enough data points in the supraoptimal temperature range to test linear thermal-time models but found that a linear model for the suboptimal
range tended to underestimate germi- nation rate in some low-temperature treatments (Fig. 3). Similar results in previous studies have been attributed to errors in temperature control, and to the relative sensitivity of germination rate to temperatures near the base tem- perature (Covell et al. 1986, Carberry and Campbell 1989). We believe that our model-prediction errors were caused by nonlinearity in germination response at low temperature rather than random or systematic errors in the experimental design. These errors disappeared when we replaced the suboptimal linear equations over the 5–20°C range with separate equations
for each 5° temperature increment (Fig. 3).
A common assumption of thermal- germination models is that the instan- taneous germination rate is indepen- dent of temperature pattern (Garcia- Huidobro et al. 1982a, Probert 1992).
This assumption has been shown to be invalid for species that remain dor- mant in a constant temperature envi- ronment (Thompson 1974, Thompson and Grime 1983, Murdoch et al.
1989). Models derived from constant- temperature data tend to underestimate variable-temperature germination response for these species (Garcia- Huidobro et al. 1982b, Benech Arnold
Fig. 5. Predicted (closed symbols) and measured (open symbols) cumulative-germination response under alternating-constant temperature regimes with an average temperature of 10˚C (circles), 15˚C (squares), and 20˚C (triangles) from Experiment 1.
Fig. 6. Total germination percentage as a function of species, experiment, mean average temperature, and temperature pattern for Experiment 1 [constant temperature (❍), alternating temperature (●), sin-wave pattern (❒)], and Experiment 2 [constant tem- perature (❍), and sine-wave patterns with temperature amplitudes of 5˚ (■), 10˚ (∆), 15˚ (▲) and 20˚C (∇∇)]. Error bars represent ±1 standard error.
et al. 1990). Our data do not show any stimulation of total germination per- centage in alternating-constant and sine-wave temperature regimes (Fig.
6). The general conformity between predicted and measured germination times in our study also suggests that fluctuating temperatures did not increase germination rate except per- haps for some of the slowest subpopu- lations (Figs. 4, 5).
Another common assumption of ger- mination-response models is that ger- mination rate is independent of ther- mal history (Benech Arnold et al.
1990, Garcia-Huidobro et al. 1982a).
This assumption is counter-intuitive and may only apply to the suboptimal temperature range. Germination shares a common temperature response with many other types of physiological processes. Suboptimal temperature response is generally attributed to the increased thermal activity of the mole- cules involved in metabolic reactions (Monteith 1977, Garcia-Huidobro et al. 1982a, 1982b, Probert 1992).
Supraoptimal temperature response, however, is generally attributed to molecular dysfunction caused by membrane degradation, denaturation of enzymes and other, relatively irre- versible, degenerative processes (Bewley and Black 1994). One would, therefore, not expect seeds to regain germinability after significant time spent at supraoptimal temperature (Garcia-Huidobro et al. 1982b, Ojeda and Trione 1990). This hypothesis is supported by our observation that ungerminated seeds in the low-tem- perature treatments would quickly ger- minate at the end of the experiment when germination vials were returned to room temperature. Ungerminated seeds in the high temperature treat- ments, however, did not germinate when temperatures were subsequently lowered. If the thermal-history assumption is false, one would expect total germination percentage to be lower than predicted for treatments that overlap both the suboptimal and supraoptimal temperature ranges. Our data show this phenomenon for blue- bunch wheatgrass and Sandberg blue- grass for some of the higher-tempera- ture treatments (Fig. 6). When this
occurred, the effect was greater at alternating-constant temperatures than in sine-wave regimes that had equiva- lent mean daily temperature. This would be expected as the seeds in alternating-constant temperature regimes spend relatively more time at the maximum treatment temperature.
The decline in germination rates at supraoptimal temperature was very rapid in our study and may not have been adequately characterized by a 5°
temperature increment. Future studies using a smaller constant-temperature interval and inclusion of some treat- ments with a greater diurnal amplitude could be used to more rigorously test this assumption.
An additional assumption of ther- mal-response models is that the rela- tive ranking of germination rate among subpopulations remains the same regardless of the thermal regime (Garcia-Huidobro et al. 1982a, Benech Arnold et al. 1990). There is no reason to expect that subpopulations adapted to germinate rapidly at low tempera- tures are the same subpopulations that are adapted to germinate rapidly at high temperatures. Violation of this assumption would also cause an underestimation of cumulative-germi- nation rate in regimes that overlapped both high and low temperature ranges.
This response was not apparent from our data but our experimental design did not allow for rigorous testing of the assumption.
Conclusions
Rangeland systems exhibit high spa- tial and temporal variability of seedbed microclimate (Pierson and Wight 1991). Field-planting trials inte- grate complex combinations of envi- ronmental variables, but statistical inference is limited by the unique set of conditions present during a given test (Hurlbert 1984). Laboratory experiments are easier to control and replicate but inferences are limited by the artificiality of the treatment envi- ronment. Previous studies have attempted to bridge the gap between the laboratory and field approaches by testing seeds under a large number of
alternating-temperature scenarios (Young and Evans 1982). Our study showed that for the seedlots tested in this experiment, cumulative germina- tion under a large number of variable- temperature regimes could be predict- ed from data generated by relatively few, constant-temperature experimen- tal treatments. Future studies might, therefore, adopt a simplified experi- mental design for seedlots that do not have a dormancy response to fluctuat- ing temperature regimes. Data from some previous constant-temperature experiments could perhaps be reevalu- ated and the data used to predict popu- lation-germination response to poten- tial field-variable temperature regimes.
The variable-temperature treatments tested in this experiment differ from true field regimes in that diurnal tem- perature patterns were constant.
Actual field regimes would vary in diurnal temperature range, temperature pattern, and longer-term trends in mean-daily temperature (Hardegree and Burgess 1995). Our experiment also ignored the effects of other abiotic and biotic seedbed variables (Hegarty 1973). Soil water availability is often the limiting factor for seedling estab- lishment in the Intermountain West (Roundy and Call 1988). Hydrothermal modeling approaches have been devel- oped for predicting the interactive effects of temperature and water stress on seed germination (Gummerson 1986, Bradford 1990) and these models have recently been applied to the pre- diction of dormancy release in the win- ter-annual weed Bromus tectorum L.
(Christensen et al. 1996). Thermal and hydrothermal-response models, howev- er, require additional validation under field-variable temperature and moisture conditions.
Literature Cited
Arnold, C.Y. 1959. The determination and significance of the base temperature in a linear heat unit system. J. Amer. Soc. of Hort. Sci. 74:430–445.
Benech Arnold, R.L., C.M. Ghersa, R.A.
Sanchez, and P. Insausti. 1990.
Temperature effects on dormancy release and germination rate in Sorghum
halepense (L.) Pers. seeds: a quantitave analysis. Weed Res. 30:81–89.
Bewley, J.D. and M. Black. 1994. Seeds:
physiology of development and germina- tion. Plenum Press, New York.
Bierhuizen, J.F. and W.A. Wagenvoort.
1974. Some aspects of seed germination in vegetables. 1. The determination and application of heat sums and minimum temperature for germination. Sci Hort.
2:213–219.
Bradford, K.J. 1990. A water relations analysis of seed germination rates. Plant Physiol. 94:840–849.
Carberry, P.S. and L.C. Campbell. 1989.
Temperature Parameters Useful for model- ing the germination and emergence of pearl millet. Crop Sci. 29:220–223.
Christensen, M., S.E. Meyer, and P.S.
Allen. 1996. A hydrothermal time model of seed after-ripening in Bromus tectorum L. Seed Sci. Res. 6:155–163.
Covell, S., R.H. Ellis, E.H. Roberts, and R.J. Summerfield. 1986. The influence of temperature on seed germination rate in grain legumes. I. A comparison of chick- pea, lentil, soybean and cowpea at con- stant temperatures. J. Exp. Bot.
37:705–715.
Ellis, R.H., S. Covell, E.H. Roberts, and R.J. Summerfield. 1986. The influence of temperature on seed germination rate in grain legumes. II. Intraspecific variation in chickpea (Cicer arietiinum L.) at constant temperatures. J. Exp. Bot. 37:1503–1515.
Ellis, R.H., G. Simon, and S. Covell. 1987.
The influence of temperature on seed ger- mination rate in grain legumes. III. A com- parison of five faba bean genotypes at con- stant temperatures using a new screening method. J. Exp. Bot. 38:1033–1043.
Garcia-Huidobro, J., J.L. Monteith, and G.R. Squire. 1982a. Time, temperature and germination of pearl millet (Pennisetum typhoides S. & H.). I.
Constant temperature. J. Exp. Bot. 33:
288–296.
Garcia-Huidobro, J., J.L. Monteith, and G.R. Squire. 1982b. Time, temperature and germination of pearl millet (Pennisetum typhoides S. & H.). II.
Alternating temperature. J. Exp. Bot. 33:
297–302.
Gummerson, R.J. 1986. The effect of con- stant temperatures and osmotic potentials on the germination of sugar beet. J. Exp.
Bot. 37:729–741.
Hardegree, S.P. and M.D. Burgess. 1995.
Datalogger control of environmental chambers for variable-temperature germi- nation experiments. J. Range Manage.
48:554–556.
Hardegree, S.P. and W.E. Emmerich, 1992. Effect of matric-priming duration and priming water potential on germina- tion of four grasses. J. Exp. Bot.
43:233–238.
Hegarty, T.W. 1973. Temperature relations of germination in the field. In: Heydecker, W. (ed.). Seed Ecology. Butterworths, London. p. 411–432.
Hurlbert, S.H. 1984. Pseudoreplication and the design of ecological field experiments.
Ecol. Monogr. 54:187–211.
Jordan, G.L. and M.R. Haferkamp. 1989.
Temperature response and calculated heat units for germination of several range grasses and shrubs. J. Range Manage.
42:41–45.
Monteith, J.L. 1977. Climate, p. 1-25. In: P.
de T. Alvim and T.T. Kozlowski (eds.), Ecophysiology of tropical crops.
Academic Press, New York.
Murdoch, A.J., E.H. Roberts, and C.O.
Goedert. 1989. A model for germination responses to alternating temperatures.
Ann. Bot. 63:97–111.
Ojeda, H. and S.O. Trione. 1990. Effect of high temperature on germination of Guayule seeds. Seed Sci. Tech.
18:681–691.
Pierson, F.B. and J.R. Wight. 1991.
Variability of near-surface soil tempera- ture on sagebrush rangelands. J. Range Manage. 44:491–496.
Probert, R.J. 1992. The role of temperature in germination ecophysiology, p. 285–325.
In: M. Fenner (ed.), Seeds: the Ecology of Regeneration in Plant Communities.
C.A.B. Internat., Oxon.
Romo, J.T. and L.E. Eddleman. 1995. Use of degree-days in multiple-temperature experiments. J. Range Manage.
48:410–416.
Roundy, B.A. and S.H. Biedenbender.
1996. Germination of warm-season grass- es under constant and dynamic tempera- tures. J. Range Manage. 49:425–431.
Roundy, B.A. and C.A. Call. 1988.
Revegetation of arid and semiarid range- lands, p. 607-635. In: P.T. Tueller (ed.), Vegetation science applications for range- lands analysis and management. Kluwer Acad. Pub., London.
Thompson, P.A. 1974. Effect of fluctuating temperatures on germination. J. Exp. Bot.
25:164–175.
Thompson, K. and J.P. Grime. 1983. A comparative study of germination respons- es to diurnally-fluctuating temperatures. J.
Appl. Ecol. 20:141–156.
Washitani, I. 1985. Germination-rate depen- dency on temperature of germanium car- olinianum seeds. J. Exp. Bot. 36:330–337.
Wester, D.B. 1991. A summary of range plant seed germination research. ICAS- ALS Pub. 91-2. Texas Tech Univ., Lubbock, Tex.
Young, J.A. and R.A. Evans. 1982.
Temperature profiles for germination of cool season range grasses. USDA, ARS, ARR-W-27, Oakland, Calif.
![Fig. 2. Base temperature of thickspike wheatgrass [Expt. 1 ( ❍ ), Expt. 2 ( ● )], bluebunch wheat- wheat-grass [Expt](https://thumb-us.123doks.com/thumbv2/123dok_us/1835040.1237529/4.864.74.584.72.426/base-temperature-thickspike-wheatgrass-expt-expt-bluebunch-wheat.webp)