Formulation Evaluation and Optimization of Proniosome Based Transdermal Patches
of Ketorolac
Behin Sundara Raj
1*, Vidya
2, Punitha Isaac Samraj
31School of Pharmacy, Curtin University, Bentley, Perth, Western Australia – 6102
2Department of Pharmaceutics, Shree Devi college of Pharmacy, Airport Road, Kenjar, Mangalore, Karnataka, India – 574 142
3
Department of Pharmacognosy, Shree Devi college of Pharmacy, Airport Road, Kenjar, Mangalore, Karnataka, India – 574 142
Article Information Received 10 Nov 2015
Received in revised form 4 Feb 2016 Accepted 6 Feb 2016
Abstract
Proniosomes are dry detailing of water-solvent bearer particles that are covered with surfactant
and can be apportioned as required and dried out to frame niosomal scattering promptly before
use on brief disturbance in hot fluid media inside of minutes. They have potential applications in
the conveyance of hydrophobic and hydrophilic medications. Diverse clusters of proniosomes of
Ketorolac tromethamine were readied by coacervation stage detachment strategy with distinctive
proportions of polymers and surfactants. The physicochemical similarity of the medication and
the polymers was considered by FTIR and DSC. The outcomes acquired demonstrated no
physical-compound incongruently between the medication and the polymers. The readied
frameworks were portrayed for embodiment effectiveness, shape, size and in vitro medication
discharge. Release study was completed to research the draining of medication from the
proniosomal framework amid capacity. On the premise of results acquired the gel KP 4 was
upgraded and further utilized for the creation of transdermal patches with a backing layer (4%
PVA) and a suitable rate controlling film. Distinctive rate controlling layers were readied with
Eudragit RS-100 (ERS), Eudragit RL-100 (ERL) by mercury substrate method. The formulations
were created and subjected to different physicochemical assessments and in vitro study. The
patch manufactured with ERS (KTP 1) as rate controlling film was advanced as the best fix and
further assessed for in vivo pervasion in rats. Investigation was completed to guarantee the
connection between the in vitro and in vivo discharge design. The study exhibited
that proniosomal transdermal patch in view of the ERS layer controlled discharge framework has
the potential to deliver ketorolac tromethamine. Keywords:
Proniosome,
Ketorolac tromethamine, Encapsulation, Eudragit RS, Eudragit RL
Corresponding Author: E-mail: [email protected] Mob. : +61-0406307140
1 Introduction
Ordinary medication conveyance frameworks are known not a brief
arrival of medication, to accomplish and additionally to keep up the
medication fixation inside the restoratively successful extent
required for treatment, it is regularly important to take this sort of
medication conveyance framework a few times each day. These
outcomes in a critical vacillation in medication levels, furthermore
has a noteworthy downside like poor bioavailability because of
hepatic digestion system (first pass)1. But late specialized
progressions have brought about new procedures for medication
conveyance, which will enhance the restorative viability and security
of medications by more exact (i.e. site particular), spatial and worldly
arrangement inside of the body consequently decreasing both the
size and number of doses2. Colloidal particulate transporters, for
example, liposomes or niosomes has been broadly utilized in
medication conveyance frameworks and delivering them from
proniosomes gives an unmistakable point of interest. These
transporters can go about as medication repositories and change of
their arrangement or surface can confirm the medication discharge
rate and/or the proclivity for the objective site. Proniosomes offers an
adaptable vesicle drug conveyance idea with potential for
conveyance of medications by means of transdermal course3, 4.
UK Journal of Pharmaceutical and Biosciences
Available at www.ukjpb.com
UK J Pharm & Biosci, 2016: 4(2); 2 Transdermal course of medication conveyance has numerous focal
points as it dodges first-pass gut and hepatic digestion system and
diminished symptoms and relative simplicity of the medication info
end in hazardous cases5, 6, 7. The vesicular medication conveyance is
gainful as vesicles tend to circuit and stick to the cell surface. This is
accepted to expand the thermodynamic movement angle of the
medication at vesicle-stratum corneum interface hence prompting
improved saturation rate.
Ketorolac (KT), a powerful pain relieving with moderate mitigating
movement with antipyretic properties, used to treat osteoarthritis and
control intense agony. It is directed by intramuscular and oral course
in isolated numerous measurements for transient administration of
post-agent pain8, 9. This incessant dosing is because of the short
half-existence of medication, which brings about inadmissible patient
consistence. Transdermal conveyance unquestionably gives off an
impression of being an alluring course of organization to keep up the
medication blood levels of KT for a developed timeframe. In this
work, an endeavor was made to give proniosome based transdermal
medication conveyance of KT.
2 Materials and Methods
2.1 Materials
Ketorolac Tromethamine was provided as gift sample by Ranbaxy
Labs Limited, Goa, India. Eudragit was purchased from Evonik
Degussa, Mumbai, India. Ethanol was procured from Poly Pharma
Laboratories, Gujarat. Ethyl cellulose was purchased from High
purityLab Chemicals, Mumbai. All other chemicals and reagents
used were of laboratory or analytical grade.
2.2 Methods
2.2.1 Preformulation studies 10, 11
2.2.1.1 Melting point determination
Melting point of the drug was determined by taking small amount of
drug in a capillary tube closed at one end and placed in a melting
point apparatus and the temperature at which the drug melts was
recorded. The experiment was performed in triplicate, and average
value was noted.
2.2.1.2 UV spectroscopy
Ketorolac was accurately weighed and dissolved in distilled water to
a concentration 1 mg/ml. This solution was then suitably diluted to
100 ml using distilled water to a final solution of concentration 100 μg/ml. UV spectrum was recorded in the wavelength range 200- 400
nm12.
2.2.1.3 Determination of solubility of Ketorolac
Excess drug (50 mg) was added to 15 ml of each fluid taken in a 25
ml stoppered conical flask, and the mixtures were shaken for 24 h at
room temperature (28±1oC) on Rotary Flask Shaker. After 24 h of
shaking, 2 ml aliquots were withdrawn at 2 h interval and filtered immediately using a 0.45 μ disk filter. The filtered samples were
diluted suitably and assayed for Ketorolac by measuring absorbance
at 322 nm. Shaking was continued until two consecutive estimations
are the same. The solubility experiments were replicated for four
times each (n=4).
2.2.1.4 Determination of Partition coefficient
30 ml of water and 30 ml of n-octanol solution was taken in the
separating funnel. 100 mg of Ketorolac was added and shaken for 1
h. 1 ml of aqueous layer was removed and transferred into a 100 ml
standard flask and made up to the mark with water. The absorbance
was measured at 322 nm by using water as the blank13.
2.2.1.5 Drug lipid compatibility studies
Prior to formulation, to study the physical and chemical
compatibilities of the drug with the lipids (Cholesterol and Lecithin)
the following studies were conducted on the drug and lipid in the
ratio 1:1. The physical mixtures were stored for 7 days at 50 °C
before study. FTIR spectra of the mixture of drug and lipid were
compared with the spectra of individual components14, 15.
The DSC thermogram of the physical mixture of drug and lipid (1:1
ratio) was obtained and compared with that of pure drug. 5 mg
Samples were accurately weighed, sealed in an aluminium pan of 40
µL capacity and equilibrated at 25 °C, subjected to the DSC run over
the temperature range of 25 to 200°C at the heating rate of 5 °C/min.
2.2.2 Formulation development of Ketorolac proniosomes
Proniosomes were prepared using coacervation phase separation
method14, 16, 17. Using a wide-mouth glass tube, 100 mg of Ketorolac
with surfactant (span 60 or tween 80), lecithin, and cholesterol were
mixed with 2.5 ml of absolute ethanol. The open end of the glass
tube was covered with a lid and the tube was warmed in a water bath
at 65± 8 oC for 5 min. 1.6 ml of PBS was added, and the mixture was
further warmed in the water bath for about 2 min so that a clear
solution was obtained. The mixture was allowed to cool to room
temperature until the dispersion was converted to proniosomal gel.
Table 1 explains the formulation of Ketorolac proniosomes.
2.2.2.1 Evaluation of Proniosomes
2.2.2.1.1 Measurement of Proniosomal gel pH and viscosity
The pH of the gel was measured using pH meter before and after
incorporation of the drug. Viscosity of the gel was determined using a
Brook field viscometer16.
2.2.2.1.2 Determination of encapsulation efficiency
0.2 g of proniosome gel was weighed in a glass tube; 10 ml of pH 7.4
UK J Pharm & Biosci, 2016: 4(2); 3 aqueous suspension was sonicated in a sonicator bath. The
Ketorolac containing niosomes was separated from untrapped drug
by centrifugation at 25,000 rpm at 20 0C for 30 min. The supernatant
was recovered and assayed spectrophotometrically at 322 nm14.
The percentage of drug encapsulation (EP (%)) was calculated by
the following equation:
EP (%) = [(Ct –Cr)/Ct] X 100%
Where
Ct is the concentration of total Ketorolac
Cr is the concentration of free Ketorolac
Table 1: Preparation of proniosomal formulation
Proniosomal
code Drug
Span 60
Tween
80 Lecithin Cholesterol
KP1 100 - 1500 1500 200
KP2 100 1500 - 1500 200
KP3 100 - 1500 750 200
KP4 100 1500 - 750 200
KP5 100 - 1500 750 400
KP6 100 1500 - 750 400
KP7 100 - 1500 1500 400
KP8 100 1500 - 1500 400
2.2.2.1.3 Optical microscopy and vesicle size determination
A drop of niosomal dispersion prepared from proniosomes was
spread on a glass slide and examined for the vesicle structure and
presence of insoluble drug crystals under the light microscope with
varied magnification16.
The proniosomal gel (100 mg) was hydrated with PBS (10 ml) in a
small test tube by manual shaking for 5 min and the resulting
niosomes were observed under an optical microscope at 100 X
magnification. The average size of 100 vesicles was measured using
calibrated ocular and stage micrometer in the microscope.
2.2.2.1.4 In vitro release study
In vitro diffusion study of proniosomal gel was performed in Franz
diffusion cell that has a receptor compartment with an effective
volume, approximately 25 ml and an effective surface area of
permeation of 3.14 sq cms10, 16. The egg membrane or cellulose
membrane was mounted between the donor and receptor
compartment. A weighed amount of proniosomal gel was placed on
one side of the skin, and the receptor medium was phosphate buffer
pH 7.4. The receptor compartment was surrounded by a water
jacket to maintain the temperature at 37±0.5 0C. Heat was provided
using a thermostatic hot plate with a magnetic stirrer. The receptor
fluid was stirred by a teflon coated magnetic bead fitted to a
magnetic stirrer. At each sampling interval, sample was withdrawn
and replaced by equal volume of fresh receptor fluid. Samples were
analyzed spectrophotometrically at 322 nm.
2.2.2.1.5 Stability studies
The stability studies were conducted according to ICH guidelines18-20.
The stability of vesicles to retain the drug was assessed by keeping
the proniosomal gel at different temperature conditions like
refrigeration temperature (4-8 0C), room temperature (25±2 0C) in
aluminium foil sealed glass vials. The samples were withdrawn at
different time intervals over a period of one month. They were
observed visually and under the optical microscope for the change in
consistency and appearance of drug crystals upon storage point and
drug leakage from the formulations by analyzing drug content.
2.2.2.1.6 Optimization of prepared proniosomes
Optimization of proniosomes was done based on the evaluated
parameters such as particle size, %EE, drug release profile and
stability study. One of the criteria in optimizing proniosome was a
drug release, i.e., the proniosomes with high cumulative drug release
will be selected as the best batch.
2.2.3 Formulation and evaluation of transdermal patches by using
optimized ketorolac proniosomal gel
2.2.3.1Development of membrane controlled transdermal systems 21 -
23
2.2.3.1.1 Backing Layer
4 gm of Poly vinyl alcohol was dissolved in 100 ml water, and the
solution was poured on to the mercury surface and dried at 60°C for
6 h.
2.2.3.1.2 Rate Controlling Membrane
ERL and ERS rate controlling membranes were prepared by
dissolving 300 mg of respective polymers in 5 ml solvent
(Chloroform). Di-n-Butyl phthalate (30% w/w of polymer) was used
as the plasticizer to optimize the best rate controlling membrane with
UK J Pharm & Biosci, 2016: 4(2); 4
2.2.3.1.3 Fabrication of Proniosome drug reservoir
2×3 cm backing membrane was cut out; three edges of the backing
layer were then sealed with the edges of rate controlling membrane
using adhesive tape. The weighed quantity (1 g) of gel was
transferred into the reservoir patch. After filling, the unsealed edge
was sealed using adhesive tape. The obtained reservoir patch was
then pasted to an adhesive plaster (The backing layer should face to
the plaster). A release liner was placed over the adhesive coated
rate controlling membrane.
2.2.4 Evaluation of patches
2.2.4.1 Percentage of moisture content
The films were weighed individually and stored in dessicator
containing activated silica at room temperature for 24 h. Individual
films were weighed repeatedly until they showed a constant weight.
The percentage of moisture content was calculated as the difference
between initial and final weight with respect to final weight.
2.2.4.2 Percentage moisture uptake
The films were weighed accurately and placed in the desiccators
containing 100 mL of saturated solution of potassium chloride, which
maintains 80-90% RH. After 3 days, the films were taken out and
weighed. The study was performed at room temperature. The
percentage moisture absorption was calculated using the formula:
% moisture absorption = Final weight− Initial weight / Initial weight
×100
2.2.4.3 Mass Variation
The patches were subjected to mass variation by individually
weighing 10 randomly selected patches.
2.2.4.4 In vitro drug release study 23-26
In vitro drug diffusion study was carried out by using Franz- diffusion
cell. In this method pre hydrated cellophane was used as the model
membrane. The membrane was placed between the donor
compartment and the reservoir compartment (phosphate buffer
pH7.4). The patch was placed on the membrane, and the
compartments clamped together. The receptor compartment was
filled with phosphate buffer pH 7.4 and hydrodynamics in the
receptor compartment was maintained by stirring with a magnetic
bead at 100 rpm. Samples were withdrawn and replaced with
receptor medium and assayed spectrophotometrically at 322 nm and
the amount of drugs released at various time intervals were
calculated.
2.2.4.5 Optimization of Ketorolac patches
Optimization of the best patch was done based on the drug release
profile i.e, the patch with the highest cummulative drug release in 24
h in a controlled manner and also based on other evaluated
parameters such as moisture absorption, moisture loss and mass
variation.
2.2.5 Curve fitting analysis7
In order to understand the mechanism of drug release, in vitro drug
release data were treated to kinetic models such as zero order, first order, Higuchi model and Korsemeyerpeppa‟s model.
2.2.5.1 Zero order kinetics
It describes the system where the drug release rate is independent
of its concentration of the dissolved substance. A graph was plotted
between time taken on x-axis and the cumulative percentage of drug
release on y-axis, if the plot is linear then the data obeys zero- order
kinetics. The equation for zero order release is
Qt=Q0+K0 t
Q0=initial amount of drug, Qt=cumulative amount of drug release at
time “t”, K0=zero order release constant, t=time in hours.
2.2.5.2 First order Kinetics
A graph was plotted between the time taken on x-axis and the log
cumulative percentage of drug remaining to be released on y-axis, if
it yields a straight line, it indicates that the release follows first order kinetics. The constant „k‟ can be obtained by multiplying 2.303 with
the slope values. The first order release equation is
LogQt= Log Q0 +Kt /2.303
Q0=initial amount of drug, Qt=cumulative amount of drug release at
time “t”, K=first order release constant, t=time in hours.
2.2.5.3 Higuchi model
The Higuchi equation suggests that the drug release mechanism is
diffusion. A graph was plotted between the square root of time taken
on x-axis and cumulative percentage of drug release on y-axis. If it
yields a straight line, indicates that the drug was released by diffusion mechanism. The slope is equal to „K‟. The Higuchi release
equation is
Q =KH t1/2
Q= cumulative amount of drug release at time “t”, KH= Higuchi
constant, t=time in hours.
2.2.5.4 Korsemeyerpeppa’s equation model
To the study the mechanism of drug release from the formulation,
the released data were fitted to exponential equation which is often
used to describe the drug release behavior from polymeric system.
F= (Mt/M) =Km tn
F=fraction of drug released at time„t‟, Mt=amount of drug released at
UK J Pharm & Biosci, 2016: 4(2); 5 n = diffusion exponent (related to mechanism of release) and t=time
in hours.
A graph was plotted between the log time taken on x-axis and the log
cumulative percentage of drug release on y-axis, yields a straight
line with a slope equal to „n‟ and the „K‟ can be obtained from y
intercept.
2.2.6 In vivo drug release study
To find out the systemic bioavailability of formulated transdermal
patches, 6 Male Wistar rats were selected. Rats were fasted
overnight. The dorsal surface of the rat was clean shaved, and the
optimized transdermal patch was fixed. Blood samples (200 µl) were
drawn by retro-orbital plexus puncture with the aid of the capillary
tube at 1, 2, 4, 6, 8, 12, 16, 20 and 24 h. The samples were collected
in heparinized eppendorff tubes containing 3.8% trisodium citrate
(100 µl) which acts as a complexing agent and centrifuged at 5000
rpm for 6 min, and collected the plasma and stored at -20ᴼ C until
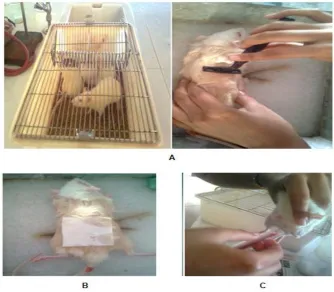
analysis (Fig-1).
Fig 1: Different stages of animal study (A-Shaved to remove the dorsal hair, 2- Adhered patch on dorsal skin, 3- Retro orbital blood collection)
The plasma samples were taken in a centrifuge tube containing
equivalent quantity of 10M K2CO3, in order to precipitate the whole
blood proteins, and centrifuged again at 5000 rpm for 6 min. 2 ml of
ethyl acetate was added to the supernatant and centrifuged again at
5000 rpm for 5 min. The separated organic phase was transferred
into clean glass tubes in order to evaporate from the organic
solvent by keeping it inside a vacuum oven. After the organic phase
was completely evaporated, about 300 µl of phosphate buffer pH 7.4
was added and centrifuged at 6000 rpm for 5 min. The supernatant
solution was analyzed at 322 nm.
Institution Animal Ethics committee Approval Number:
SDCP/IAEC-07/2011-12
3 Results and Discussions
3.1 Preformulation studies of ketorolac
3.1.1 Melting point determination
The melting point of unadulterated ketorolac tromethamine was
resolved utilizing melting point contraption and was observed to be
163-1670 C.
3.1.2 UV Spectroscopy
The λmax of ketorolac was determined by using UV
spectrophotometer. The λmax was found out to be 322 nm, similar to
the previous reported literature.
3.1.3 Determination of solubility of Ketorolac
Ketorolac was freely soluble in water & methanol, slightly soluble in
tetrahydrofuran and insoluble in acetone & toluene.
UK J Pharm & Biosci, 2016: 4(2); 6 The partition coefficient was found to be 2.32
3.1.5 Drug- Excipient compatibility studies
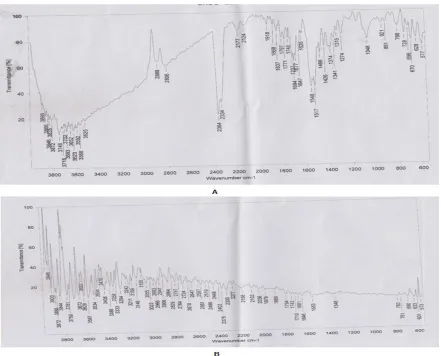
Infrared spectra of Ketorolac as well as its proniosome showed
characteristic peaks at 1699 cm-1(C=O stretch in acid), 3299 cm-1(OH
in acid), 3504cm-1 (NH stretch), and 1646cm-1 (diaryl ketone). There
were no changes in the major peaks of Ketorolac in the presence of
lecithin and cholesterol. So the drug and the excipients are
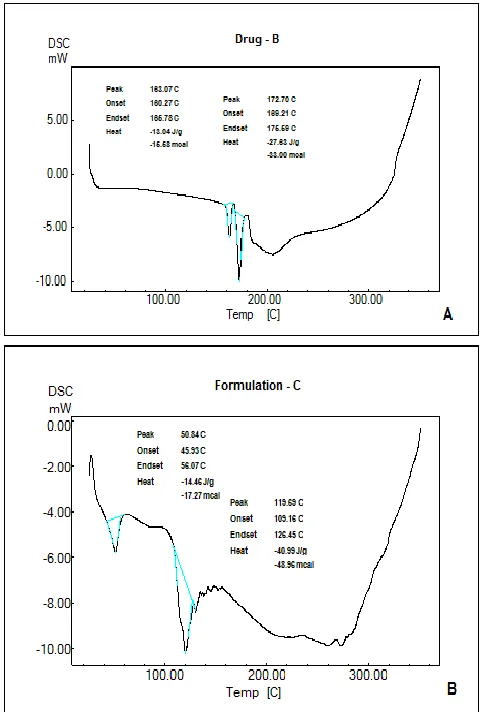
compatible with each other. The FTIR and DSC results are shown in
figure 2-4. DSC bend for the medication demonstrates an
endothermic crest at 163 ºC identified with medication dissolving
point. The nonattendance of a liquefying crest of the medication in
the proniosomes was taken as a sign that the medication was
entangled by the polymer. Similar result was reported by Nanda27
exhibiting the endothermic peak at 161.39˚C.
Fig 2: A) FTIR spectrum of pure Ketorolac tromethamine B) Ketorolac+cholesterol
3.2 Evaluation of proniosomes
The formulations were studied for physical characteristics like colour
and appearance, determination of viscosity and were found to be
within the acceptable limits as indicated in table 2.
3.2.1 Colour and appearance
All the formulations had a yellowish brown to slight yellow colour
and had semisolid consistency. The gel definitions displayed great
spreadability and thickness.
3.2.2 Optical microscopy and vesicle size determination
The span of 100 particles was dictated by optical microscopy, and
the particles uncovered unilamellar vesicles with no agglomeration
or total. The mean particle size was in the range of 2.98 to 5.01 µm.
The mean particle sizes of all the hydrated proniosomal formulations
showed that the niosomes prepared with Tween 80 were
significantly larger than those prepared with Span 60. The
relationship saw between niosome size and Traverse hydrophobicity
has been ascribed to the decline in surface vitality with expanding
hydrophobicity, bringing about the littler vesicles. This would likewise
clarify the vast vesicle size of niosomes arranged with Tween which
has a much lower hydrophobicity than spans. It was observed that
the gel formulation showed good spreadability, and viscosity.
3.2.3 Determination of encapsulation efficiency
The encapsulation efficiency of the formulated proniosomes were
determined and tabulated in table 2. The EE were determined for all
proniosomal formulations stored at 4-8 oC and 25±2 oC,
UK J Pharm & Biosci, 2016: 4(2); 7 formulations after the one-month period. Thus, both Span 60 and
Tween 80 based proniosomes of ketorolac seemed to exhibit good
stability at low temperatures. The entrapment efficiency of our
proniosomes ranged between 80-90% compared to the 40-70%
reported by Mishra 29 for proniosomes of Naproxen.
Fig 3: A) FTIR spectrum of Ketorolac+lecithin; B) Formulatio
3.2.4 In vitro release study
The in vitro releases from ketorolac proniosomes were investigated
by using Franz- diffusion cell. The percentage of the drug released
after 24 h from the proniosomal vesicles are shown in table 3. In vitro
diffusion studies of proniosomal transdermal gel studies showed the
cumulative percentage permeation 79.66%, 82.02%, 87.01%,
91.73%, 70.56%, 74.65%, 67.03%, 77.84% in 24 h from the
formulations KP I, KP 2, KP 3, KP 4, KP 5, KP 6, KP7 and KP8
respectively.
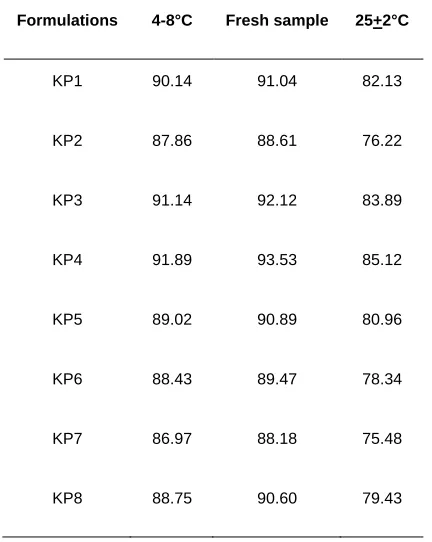
3.2.5 Stability studies
Physical stability of proniosomal formulations were studied for a
period of one month. The EE were determined (table 4) for all
proniosomal formulations stored at 4-8 °C and 25±2°C, which
indicates insignificant decrease in EE of proniosomes stored at 4-8
°C. Thus, both tween 80 and Span 60 proniosomes of ketorolac
seemed to exhibit good stability. The result is similar to proniosomal
transdermal system of granisetrone hydrochloride stable at 4-8˚C,
reported by Patil 28.
3.2.6 Optimization of Proniosome Gel
KP4 was optimized by considering particle size (2.98±0.45), % EE
(93.53), % CDR (91.73) and stability. Therefore KP 4 was selected
for fabricating transdermal patches.
3.3 Evaluation of transdermal patches of ketorolac
Two formulations of Ketorolac transdermal patches were formulated
using KP 4 as optimized proniosome gel and ERL & ERS as rate
controlling membranes. The prepared transdermal patches were
transparent, smooth, and uniform.
3.3.1 Percentage moisture content
The percentage moisture content was found to be 5.13% and 6.96%
for KTP1 and KTP2 respectively. The lowest percentage moisture
loss was found in patches fabricated with ERS as rate controlling
UK J Pharm & Biosci, 2016: 4(2); 8 Fig 4: A) DSC of Ketorolac tromethamine; B) Formulation
3.3.2 Percentage moisture uptake
The percentage moisture uptake was found as 1.76% and 2.48% for
KTP 1 and KTP 2 respectively. The lowest percentage moisture
uptake was found in patches fabricated with ERS as rate controlling
membrane.
3.3.3 Mass variation
The mass was found to be uniform in the prepared batches and
varied from 0.063%±0.07 mg to 0.068%±0.09.
3.3.4 In vitro study
Table 5 explains the % CDR of patches after 24 h. KPT1 was the
best with 88% drug release compared to 82% of KPT2.
3.3.5 Optimization of best patch
Out of two formulations KTP 1(ERS as RC membrane) exhibited
good mechanical properties and release pattern. Hence KTP 1 had
been optimized as the best patch.
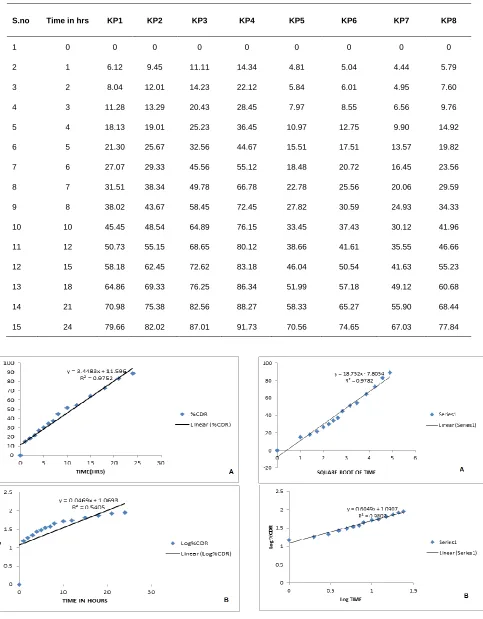
3.4 Curve fitting analysis
In this study, two formulations released variable amounts of
ketorolac through semi permeable membrane in the in vitro fluid. To
examine the drug permeation kinetics and mechanism, the data of
KTP 1 were fitted to models representing zero-order, first-order,
Higuchi and Korsemeyer-Peppas. The graphs are shown in figure 5
and 6.
Table 2: characterization of ketorolac proniosomal gel
Formulation
code pH Viscosity
Vesicle size in µm
Encapsulation efficiency (%)
KP1 4.8 1352.21 5.01±1.20 91.04±0.18
KP2 5.2 1896.45 4.31±1.17 88.61±0.21
KP3 4.8 1438.78 3.32±0.59 92.12±0.15
KP4 4.6 1723.96 2.98±0.45 93.53±0.13
KP5 5.1 1665.19 4.6 ±2.07 90.89±0.20
KP6 5.1 2012.88 3.03±0.5 89.47±0.11
KP7 4.9 1974.65 4.09±1.56 88.18±0.16
KP8 4.7 2234.37 3.44±0.91 90.60±0.22
Results are mean±SD (n=3)
3.4.1 Zero order kinetics of KTP 1
It was found that 88.91% of drug was released within 24 h from
KTP-1 (ERS as rate-controlling membrane) and 82.323% of drug released
from KTP2 after 24h. A higher drug release pattern was exhibited by
KTP 1 at each time intervals. This release is optimum and significant
and followed zero-order kinetics (By Zero order plot). The zero-order
plot of KTP 1 was found to be fairly linear and had high regression
values. Therefore, the drug permeation from this formulation could
follow zero-order kinetics.
3.4.2 First order kinetics of KTP 1
The log % CDR at 24 h was 1.948951 %
3.4.3 Higuchi model
By plotting Higuchi‟s plot, it was found that the release obeys
diffusion mechanism. The square root time of 88.91% CDR was
4.898979
3.4.4 Korsemeyerpeppa’s model
Hence, to confirm the exact mechanism of drug permeation from
these patches, the data were fitted according to the
Korsmeyer-Peppas model indicated by R2 value closer to 1(0.98) and the n<1.0
confirmed that the drug permeation from transdermal patches
followed diffusion and Non-Fickian transport. The log time was
UK J Pharm & Biosci, 2016: 4(2); 9 Table 3: % CDR of proniosomes of KP1 - KP8
S.no Time in hrs KP1 KP2 KP3 KP4 KP5 KP6 KP7 KP8
1 0 0 0 0 0 0 0 0 0
2 1 6.12 9.45 11.11 14.34 4.81 5.04 4.44 5.79
3 2 8.04 12.01 14.23 22.12 5.84 6.01 4.95 7.60
4 3 11.28 13.29 20.43 28.45 7.97 8.55 6.56 9.76
5 4 18.13 19.01 25.23 36.45 10.97 12.75 9.90 14.92
6 5 21.30 25.67 32.56 44.67 15.51 17.51 13.57 19.82
7 6 27.07 29.33 45.56 55.12 18.48 20.72 16.45 23.56
8 7 31.51 38.34 49.78 66.78 22.78 25.56 20.06 29.59
9 8 38.02 43.67 58.45 72.45 27.82 30.59 24.93 34.33
10 10 45.45 48.54 64.89 76.15 33.45 37.43 30.12 41.96
11 12 50.73 55.15 68.65 80.12 38.66 41.61 35.55 46.66
12 15 58.18 62.45 72.62 83.18 46.04 50.54 41.63 55.23
13 18 64.86 69.33 76.25 86.34 51.99 57.18 49.12 60.68
14 21 70.98 75.38 82.56 88.27 58.33 65.27 55.90 68.44
15 24 79.66 82.02 87.01 91.73 70.56 74.65 67.03 77.84
Fig 5: Graph indicating A) Zero order kinetics B) First order kinetics of KPT1
UK J Pharm & Biosci, 2016: 4(2); 10 Table 4: Entrapment efficiency of formulations in various
temperatures after 1 month
Formulations 4-8°C Fresh sample 25+2°C
KP1 90.14 91.04 82.13
KP2 87.86 88.61 76.22
KP3 91.14 92.12 83.89
KP4 91.89 93.53 85.12
KP5 89.02 90.89 80.96
KP6 88.43 89.47 78.34
KP7 86.97 88.18 75.48
KP8 88.75 90.60 79.43
3.5 In vivo Study
KTP 1 (with ERS rate controlling membrane) exhibited good
mechanical properties and optimum release after in vitro release
study. So the bioavailability study was conducted with KTP 1 in 6
Male wistar rats. Blood samples were analyzed UV
spectrophotometrically at 322 nm. Table 6 explains the % CDR of
samples 1-6 after 24 h. The in vitro and in vivo correlation of
formulation KTP1 after 24 h is shown in figure 7.
The system shows 78.66% of drug release in in vivo method and
then to determine the correlation between the in vitro data the
release pattern analysis was carried out, which revealed that they
were well related and followed zero order release in a biological
system also.
4 Conclusions
Ketorolac (KT), presently controlled by intramuscular and oral
course in partitioned various measurements for transient
administration of post-agent agony makes inadmissible patient
consistence. So in this work an endeavor was made to give
proniosome based transdermal medication conveyance. Ketorolac
was effectively ensnared inside of the lipid bilayers of the vesicles
with high effectiveness and displays noteworthy in vitro discharge
example and great steadiness too. The detailing having best
attributes was chosen to manufacture transdermal patch utilizing
ERS and ERL as RC films.
Table 5: % CDR of Formulated patches after 24 hrs
S. No Time in hr KPT1 KPT2
1 0 0 0
2 1 14.98 7.92
3 2 18.23 10.08
4 3 21.56 16.79
5 4 26.82 21.46
6 5 30.12 24.57
7 6 34.23 31.24
8 7 37.23 36.11
9 8 44.74 39.97
10 10 51.28 45.52
11 12 54.32 51.18
12 15 64.34 60.63
13 18 72.91 67.13
14 21 83.24 75.43
15 24 88.91 82.323
The patch with ERS as RC film demonstrated great mechanical
properties and ideal medication discharge pattern. The active
information investigation uncovered that the defined TDDS takes
after zero request discharge energy. Higuchi's plot for the plan
demonstrated that the overwhelming component of medication
discharge is dispersion, and the information were fitted by
Korsmeyer-Peppas model showed that the medication penetration
from transdermal patches took after dissemination and Non-Fickian
transport. The in vivo discharge example indicated the relationship
with the in vitro discharge design. The above result prompts the
UK J Pharm & Biosci, 2016: 4(2); 11 Table 6: %CDR of sample 1-6 after 24 hrs
S. No Time (hrs) Sample 1 Sample 2 Sample 3 Sample 4 Sample 5 Sample 6
1 0 0 0 0 0 0 0
2 1 8.02 8.98 10.08 7.61 6.96 9.82
3 2 14.85 15.71 17.26 13.58 11.77 16.60
4 3 17.76 18.52 20.13 16.35 14.47 19.42
5 4 21.16 22.47 25.29 18.53 16.71 23.62
6 5 26.63 27.42 28.56 24.02 23.55 28.09
7 6 27.69 28.95 31.88 26.64 24.66 30.45
8 7 33.84 35.06 36.78 32.42 30.75 35.93
9 8 36.87 37.71 41.25 35.18 34.39 39.30
10 10 44.28 45.36 47.47 42.18 40.66 45.84
11 12 51.42 52.28 53.09 50.23 49.84 53.65
12 15 59.62 61.17 60.22 58.88 57.73 60.86
13 18 63.73 65.11 63.96 62.15 61.04 64.03
14 21 74.32 75.48 77.04 73.29 71.03 76.75
15 24 77.36 79.51 82.48 76.25 75.69 80.66
Fig 7: Graph indicating in vitro and in vivo correlation of KTP 1 after 24 hrs
5 Acknowledgements
The authors would like to thank Shree Devi Education Trust,
Mangalore for providing the necessary facilities to carry out the
research work.
6 Conflicts of interests
The authors declare that they have no competing interests.
7 Authors contributions
BS and PIS carried out literature review and preparation of the
manuscript. Vidya participated in the collection of data. All authors
read and approved the final manuscript.
8 References
1. Chein YW. Novel drug delivery system: Drugs and
pharmaceutical sciences. 2nd ed. New York: Marcel Dekker;
1987.
2.
http://www.pharmainfo.net/reviews/transdermal-drug-delivery-systems-review.
3. Deepthi A, Madhukar RE, Jukanti R, Bandari S, Prabhakar
RV. Provesicular drug delivery systems: An overview and
UK J Pharm & Biosci, 2016: 4(2); 12 4. Waghmode M, Ashar S. Proniosomal drug delivery systems:
An overview. Int J Pharm Che Sci 2012; 1(3):695-707.
5. Finnin BC, Morgan TM. Trasndermal penetration. J Pharm
Sci 1999; 88(10):955-58.
6. Allen L V, Popovich N G, Ansel H C, Ansel‟s Pharmaceutical
Dosage Forms and Drug Delivery Systems, 8th ed, Lippincott
Williams and wilkins; 2005.
7. Jain NK. Controlled and novel drug delivery. 1st ed New
Delhi: CBS Publishers; 1997.
8. Tripathi KD. Essentials of Medical Pharmacology. 6th ed New
Delhi: Jaypee Brothers Medical Publisers (P)Ltd; 2003.
9. http://www.drugbank.ca/drugs/DB00465.
10. Rishu K, Rao R, Dahiya NK, Nanda S. Formulation and
characterization of valsartan proniosomes. Maejo Int J Sci
Technol2011; 5(1):146-58.
11. Sankar V, Ruckmani K, Durga S, Jailani S. Proniosomes as
drug Carriers. Pak J Pharm Sci 2010; 23(1):103-7.
12. Gandhi LR. Absorption ratio method for the estimation of
moxifloxacin HCl and ketorolac tromethamine in their
combined dosage form by uv-visible spectroscopy. Int J
Pharm Res Dev 2011; 3(7):21-6.
13. Kevin C, Anil JS, Pratik HS. Formulation and in vitro
characterization of monolithic matrix transdermal systems
using HPMC/Eudragit S 100 polymer blends. Int J Pharm
Pharm Sci 2009; 1:108-120.
14. Ibrahim A, Alsarra, AA, Bosela SM, Ahmed and Mahrous
GM. Proniosomes as a drug carrier for transdermal delivery
of ketorolac. Eur J Pharm Biopharm 2005; 59: 485–90.
15. Pintu KD, Subrata, Biswajit M, Sagar S, Pattnaik S,
Chakraborty S. Optimization of in vitro permeation pattern of
ketorolac tromethamine transdermal patches. Iran J
Pharm.Res 2011; 10(2):193-201.
16. Shamsheer AS, Sabareesh M, Khan PR, Sai KP, Sudheer B.
Formulation and evaluation of lisinopril dihydrate transdermal
proniosomal gels. J Appl Pharm Sci 2011; 1(8):181-5.
17. Mahrous GM. Proniosomes as a drug carrier for transdermal
delivery of meloxicam. Bull Pharm Sci 2010; 33(2):131-40.
18. Ashish K, Goudanavar P, Hiremath D, Reddy SR.
Development and characterization of perindopril erbumine
loaded proniosomal gel. Asian J Pharm Tech 2012;
2(2):54-8.
19. Walve JR, Bakliwal SR, Rane BR, Gujrathi NA, Pawar SP.
Design, development and evaluation of a proniosomal
transdermal drug delivery system for diclofenac . Int J Pharm
Inv 2012; 2(4):6-15.
20. Prajapati SK, Kumar S, Sahu VK, Prakash G. Proniosomal
gel of flurbiprofen: formulation and evaluation. J Drug
Delivery Ther 2012; 2(1):1-5.
21. Bhavana V, Ajay JK, Jain NK. Proniosome based
transdermal delivery of levonorgestrel for effective
contraception. J Con Rel 1998; 54: 149-65.
22. Jayaprakash S, Halith MS, Firthouse PUM, Yasmin, M
Nagarajan. Preparation and evaluation of celecoxib
transdermal patches. Pak J Pharm Sci 2010; 23(3): 279-83.
23. Srinivas M, Nayanabhirama U. Formulation development, in
vitro and in vivo evaluation of membrane controlled
transdermal systems of glibenclamide. J Pharm Pharm Sci
2005; 8(1):26-38.
24. Parthasarathy G, Bhaskar RK, Prasanth VV. Formulation and
characterization of transdermal patches of naproxen with
various polymers such as ethylcellulose and hydroxy propyl
methyl cellulose polymer in various concentrations.
Pharmacie Globale 2011; 6(7):1-3.
25. Gowda DV, Rajesh N, Somashekhara C, Siddaramaiah.
Development and evaluation of aceclofenac loaded
transdermal film. Int J PharmTech Res 2010; 2(4):2224-33.
26. Patel RP, Patel G, Baria A. Formulation and evaluation of
transdermal patch of aceclofenac. Int J Drug Deliv 2009;
1:41-51.
27. Nandha S, Saroha K, Sharma B. Formulation, evaluation
and optimization of transdermal gel of ketorolac
tromethamine using face centered central composite design.
IJPPS 2014; 6:4.
28. Patil BA, Puranik PK, Pol SD, Khobragade PK, Ramteke PS,
Palasakar RG, Patil NR. Formulation and development of
industry feasible proniosomal transdermal drug delivery
system of granisetron hydrochloride. Asian Journal of
Pharmaceutics 2015; 113-119.
29. Mishra S, Vasistha P, Sachdeva M, Sara UVS. International
Journal of Universal Pharmacy and Life sciences 2013; 3(3):