R E S E A R C H
Open Access
Complement
C3
gene polymorphisms are
associated with lipid levels, but not the risk
of coronary artery disease: a case-control
study
Gaojun Cai
1*†, Li Li
1†, Yifei Chen
2, Haomin Huang
1, Lei Yu
1and Lianhong Xu
3Abstract
Background:Coronary artery disease (CAD) is the leading cause of mortality and morbidity worldwide. Previous studies have shown that complement component 3 (C3) is associated with atherosclerosis and cardiovascular risk factors.
Methods:We conducted this study to evaluate the associations between tagSNPs in theC3gene locus and the CAD susceptibility and lipid levels in the Chinese population. A hospital-based case-control study, including 1017 subjects (580 CAD patients and 437 non-CAD controls), was conducted. TagSNPs in theC3gene were searched and genotyped by using the polymerase chain reaction-ligase detection reaction method.
Results:The C3 levels were positively associated with the low-density lipoprotein cholesterol (LDL-C) levels (r = 0.269, P= 0.001). Compared with those in controls, the serum C3 levels in CAD patients were significantly higher (Control: 0.94 + 0.14 g/l; CAD: 1.10 + 0.19 g/l,P< 0.001). No significant differences in genotype or allele frequencies were observed between CAD patients and controls. The minor T allele of rs2287848 was associated with low apolipoprotein A1 (ApoA1) levels in controls (Bonferroni corrected P, Pc = 0.032). Linkage disequilibrium and haplotype analysis established two haplotype blocks (Block1: rs344555-rs2277984, Block 2: rs2287848-rs11672613) and six haplotypes. No significant associations between haplotypes and the risk of CAD were observed (all Pc > 0.05).
Conclusions:The results revealed thatC3gene polymorphisms were associated with the lipid levels, but not CAD susceptibility in the Chinese population.
Keywords:Coronary artery disease, Complement C3, Gene, Polymorphism, Haplotype
Introduction
Coronary artery disease (CAD) is the leading cause of mortality and morbidity in developed countries, as well as in developing countries [1]. China is representative of a developing country. Recently, a report on cardiovascu-lar disease (CVD) revealed that approximately one in five Chinese adults is afflicted by CVD, and that the number of CAD patients is more than 11 million [2]. With the increasing trend of aging in China, the incidence of
CAD is bound to increase. Growing evidence suggests that CAD is a multi-factorial condition that is deter-mined by environmental and genetic factors [3].
In recent years, studies have found that activation of complement system plays an important role in the pathogenesis of CAD [4]. The third complement compo-nent (C3), mainly secreted by liver and adipose tissue, is the central component of the complement system and plays a crucial role in the immune system. Activation of C3 is the most important step for the biological activity of the complement system. A high fish oil diet promotes the production of the membrane attack complex and in-creases the levels of various complement proteins in vivo, including C3 [5]. Previous studies have shown
© The Author(s). 2019Open AccessThis article is distributed under the terms of the Creative Commons Attribution 4.0 International License (http://creativecommons.org/licenses/by/4.0/), which permits unrestricted use, distribution, and reproduction in any medium, provided you give appropriate credit to the original author(s) and the source, provide a link to the Creative Commons license, and indicate if changes were made. The Creative Commons Public Domain Dedication waiver (http://creativecommons.org/publicdomain/zero/1.0/) applies to the data made available in this article, unless otherwise stated.
* Correspondence:[email protected]
†Gaojun Cai and Li Li contributed equally to this work.
1Department of Cardiology, Wujin hospital affiliated with Jiangsu University,
the Wujin Clinical college of Xuzhou Medical University, Changzhou, Jiangsu Province 213017, China
that C3 is associated with atherosclerosis and cardiovas-cular risk factors. Increased deposition of C3 within the intima of atherosclerotic lesions suggests that comple-ment may play a direct functional role in atherosclerosis. Preclinical and clinical evidence suggested that comple-ment C3 might be a biomarker of insulin resistance and cardio-metabolic diseases [6–8]. Bratti et al. revealed that the C3 level was positively correlated with body mass index and significantly decreased with weight loss after bariatric surgery. Jiang et al. found that in CAD pa-tients, serum C3 was significantly higher than in con-trols, and was positively associated with the severity of CAD [9,10].
The C3 gene is located in human chromosome 19p13.3–2 and contains 41 exons. Although the relation-ship between gene polymorphisms and CAD risk has been investigated extensively, studies focused on C3 variants were relatively few and the results were incon-sistent. A mutation in theC3gene could result in an in-crease in circulating C3 concentrations and was related to dyslipidaemia and cardiovascular disease [11]. In 2015, Nsaiba et al. found that schizophrenic patients with the rs2230199 GG genotype had higher total chol-esterol (TC) and, lower density lipoprotein cholchol-esterol (LDL-C) and C3 levels compared with those with the CC genotype [11]. In addition, a strong positive correl-ation was found between the C3 polymorphism and myocardial infarction in a Tunisian population [12].
To the best of our knowledge, no study has thoroughly investigated the effect of C3 gene polymorphisms on CAD and lipid profiles in Chinese population. Therefore, we performed this hospital-based case-control study to explore the relationship between C3 tagSNPs and the lipid levels and CAD risk in a Chinese population.
Methods Subjects
From October 2012 to July 2017, a total of 1017 unre-lated adult subjects were enrolled in this hospital-based case-control study from the Department of Cardiology in Wujin Hospital affiliated with Jiangsu University. Of the 1017 subjects, 580 were CAD patients (410 males and 170 females, mean age of 64.16 ± 9.93 years) and 437 were non-CAD controls (227 males and 210 females, mean age of 61.26 ± 9.35 years). All participants were Chinese and underwent a coronary angiography examin-ation. Coronary angiograms were evaluated by at least two experienced cardiologists. CAD was defined as a stenosis diameter greater than 50% in at least one major coronary vessel (left main, left anterior descending, left circumflex, right coronary artery, and large branches). Non-CAD controls, selected from individuals admitted to the hospital to rule out CAD, also underwent a cor-onary angiography examination. The luminal stenosis of
all of the major coronary arteries must be less than 50%. Diagnoses of EH and DM were described in a previous study [13]. In addition, individuals with rheumatic dis-ease, asthma, infection, malignancy, serious kidney or hepatic disease were excluded from this study.
Written informed consent was obtained from all in-cluded participants. The study protocol conformed to the ethical guidelines of the Declaration of Helsinki and was approved by the Ethics Committee of Wujin Hospital affiliated with Jiangsu University.
Selection of C3 gene polymorphisms
TagSNPs of the C3 gene were searched in the Inter-national HapMap Project database (http://hapmap.ncbi. nlm.nih.gov/cgi-perl/gbrowse/hapmap3r2_B36/). The de-tailed strategy was as follows: Population: CHB; Pairwise methods: Tagger Pairwise; RSquare cut off: 0.80; and MAF cut off: 0.10. In total, eight SNPs met the requirements and were included in the present study (rs2250656, rs344555, rs11672613, rs2287848, rs7257062, rs2230205, rs2277984, and rs2241393). The detailed information of the eight SNPs is shown in Additional file1: Table S1.
DNA genotyping
Serum lipid and C3 levels
The lipid level detection methods, including TC, trigly-ceride (TG), high density lipoprotein cholesterol (HDL-C) and LDL-C, apolipoprotein A1 (Apo A1) and Apo B, were described in our previous study [15]. The serum C3 levels were detected by the radio-immunoassay method, according to the instructions for the kit (Roche Diagnosis Co., Ltd., German).
Statistical analysis
Continuous variables with normal distribution were pre-sented as the means ± standard deviation (SD) and com-pared with an independent-sample t-test or ANOVA test, otherwise presented as median [quartile ranges (QR)] and compared by using Mann–Whitney U or Kruskal-Wallis H test among groups. Hardy-Weinberg equilibrium was calculated by the Chi-square (χ2) test. The differences of allelic and genotypic frequencies be-tween CAD patients and controls were also examined by the Chi-square test. Codominant, dominant and reces-sive models were used for multiple comparisons. In mul-tiple comparisons, Bonferroni correction was performed to assess the effect of genetic polymorphisms on CAD (Bonferroni corrected P, Pc = P*8) and lipid profiles (Pc = P*16). The association between the genotypes and CAD risk was evaluated by calculating the values of the odds ratios (ORs) and 95% confidence intervals (CIs). Unconditional logistic regression analysis, with adjust-ment for risk factors of CAD (age, gender, smoking, EH, DM and dyslipidaemia), was also used to analyse the as-sociation between the risk for CAD and tagSNPs. Link-age disequilibrium analysis and haplotype analysis were assessed by Haploview 4.2 software package (version 4.2). All statistical analyses were performed with SPSS software (version 17.0, SPSS Inc., Chicago, Illinois, USA). A two-sidedPvalue less than 0.05 was considered as statistically significant.
Results
Clinical characteristics of subjects
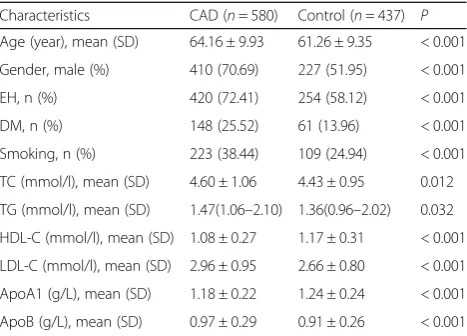
The clinical characteristics of CAD patients and controls are summarized in Table1. In comparison with controls, patients were older. The prevalence of males and rates of essential hypertension (EH), diabetes mellitus (DM) and smoking were higher among patients than among controls. In lipid profiles, CAD patients had higher TC, triglyceride (TG), LDL-C and ApoB levels than controls. On the contrary, high-density lipoprotein cholesterol (HDL-C) and ApoA1 levels were lower in patients than in controls.
Serum C3 levels and the risk of CAD
A total of 143 samples including 73 controls (43 males and 30 females, mean age of 62.49 ± 8.43 years) and 70
CAD patients (47 males and 23 females, mean age of 65.00 ± 10.24 years) were randomly selected to detect the serum C3 levels. There were no significant differences in the ages and gender between the two groups (P> 0.05). The C3 levels were positively associated with the LDL-C levels (r = 0.269,P= 0.001). Compared with those in con-trols, the C3 levels in CAD patients were significantly higher (Control: 0.94 + 0.14 g/l; CAD: 1.10 + 0.19 g/l, t = 5.910, P< 0.001). Logistic regression analysis, with ad-justment for gender, age, smoking, EH, DM and lipid profiles, showed that the C3 levels remained significantly associated with the risk of CAD (P< 0.001).
Association ofC3tagSNPs and the risk of CAD
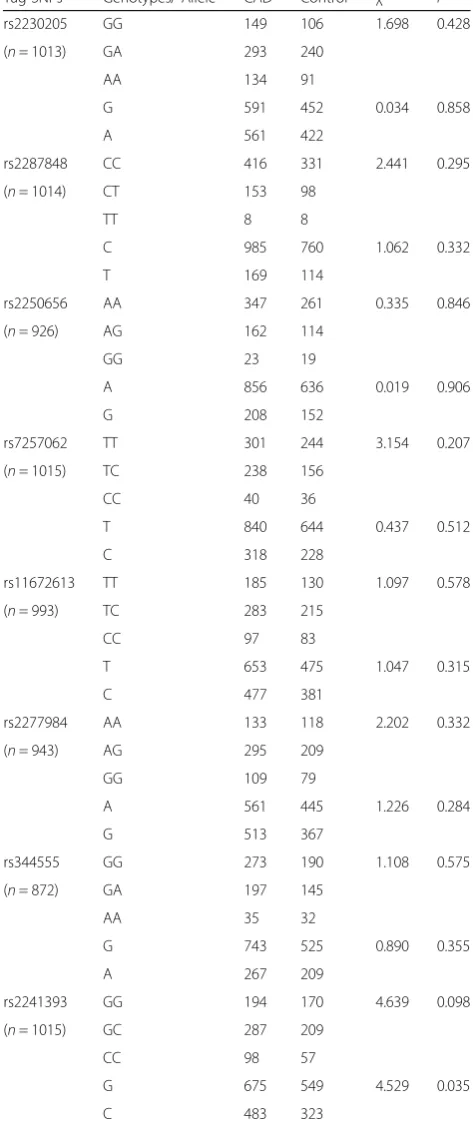
All genotypic frequencies in controls, except rs2230205, were in accordance with Hardy-Weinberg equilibrium. The distributions of the allelic and genotypic frequencies of C3 polymorphisms in CAD patients and controls are shown in Table2. No significant differences in the geno-type and allele frequencies were observed between pa-tients and controls (Bonferroni corrected P, Pc > 0.05). Codominant, dominant and recessive models were used for multiple comparisons. In multiple comparisons, no significant association of C3 tagSNPs and CAD risk was found after adjusting for age, gender, EH, DM, smoking and lipid profiles (Additional file1: Table S4).
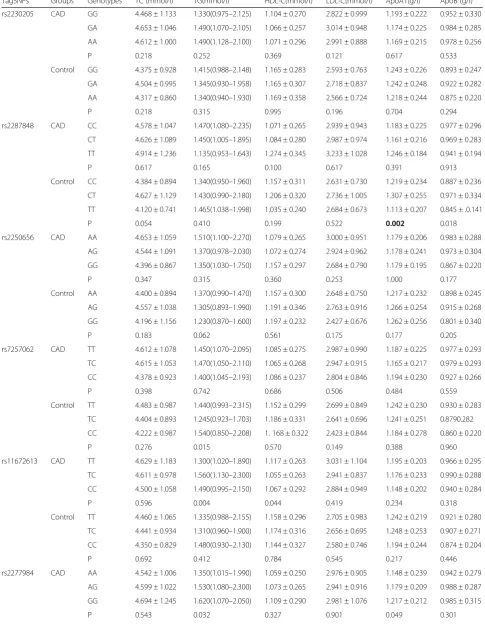
Association ofC3tagSNPs and lipid profiles
Table 3 shows the association of C3 tagSNPs and lipid profiles, after Bonferroni correction of P-values, the minor T allele of rs2287848 was associated with low ApoA1 levels in controls (Pc = 0.032).
Table 1Clinical characteristics between CAD and control groups
Characteristics CAD (n= 580) Control (n= 437) P
Age (year), mean (SD) 64.16 ± 9.93 61.26 ± 9.35 < 0.001 Gender, male (%) 410 (70.69) 227 (51.95) < 0.001 EH, n (%) 420 (72.41) 254 (58.12) < 0.001 DM, n (%) 148 (25.52) 61 (13.96) < 0.001 Smoking, n (%) 223 (38.44) 109 (24.94) < 0.001 TC (mmol/l), mean (SD) 4.60 ± 1.06 4.43 ± 0.95 0.012 TG (mmol/l), mean (SD) 1.47(1.06–2.10) 1.36(0.96–2.02) 0.032 HDL-C (mmol/l), mean (SD) 1.08 ± 0.27 1.17 ± 0.31 < 0.001 LDL-C (mmol/l), mean (SD) 2.96 ± 0.95 2.66 ± 0.80 < 0.001 ApoA1 (g/L), mean (SD) 1.18 ± 0.22 1.24 ± 0.24 < 0.001 ApoB (g/L), mean (SD) 0.97 ± 0.29 0.91 ± 0.26 < 0.001
Association of andC3tagSNPs and serum C3 levels No significant association between C3 tagSNPs and C3 levels was found in the whole population (data not shown). Stratified analyses suggested that C3 polymor-phisms were not associated with C3 levels in either cases or controls.
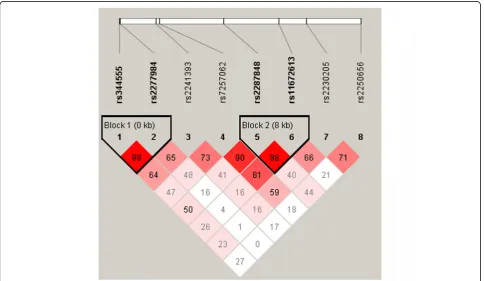
Linkage disequilibrium and haplotype analysis
Additional file 1 Table S5 lists the result of the linkage disequilibrium and haplotype analyses. A total of two haplotype blocks (Block1: rs344555-rs2277984, Block 2: rs2287848-rs11672613) and six haplotypes were estab-lished (Fig. 1). Haplotype analysis indicated that there were no significant associations between haplotypes and the risk of CAD (all Pc > 0.05).
Discussion
To our knowledge, this is the first study to evaluate the relationship between tagSNPs in the C3 gene and the lipid levels and CAD risk in a Chinese population. In the present study, we found thatC3polymorphisms were as-sociated with lipid levels, but not the risk of CAD.
Complement activation is fundamental to the immune defence of the host. But if the complement component becomes excessive activation, it can lead to various eases including inflammatory and cardiovascular dis-eases. C3 has been identified as the central component of the complement system and plays an important role in the pathogenesis of cardiovascular diseases [8]. Co-hort studies of the general population demonstrated that high concentrations of complement C3 were associated with diabetes incidence and an increased risk of diabetic microvascular disease [16, 17]. In a case-control study, the serum levels of C3 and C4 were significantly in-creased in acute myocardial infarction patients and stable angina patients compared with controls [18]. Dys-lipidemia, such as high LDL-C and low HDL-C, plays a crucial role in the occurrence and development of CAD and, has been widely accepted. In recent years, numer-ous studies have demonstrated that C3 is strongly asso-ciated with lipid levels and CAD risk [18,19]. Inhibiting the interaction between C3 and fibrinogen could reduce cardiovascular events in diabetic patients [20]. In our study, we found that the C3 level was positively associ-ated with the LDL-C levels and risk of CAD, which was consistent with previous results.
Recently, studies suggested that variations in the C3 gene could result in a change in the C3 concentration [21]. In 2009, Phillips detected 11 tagSNPs in C3 in French people with metabolic syndrome. They found that rs2250656 A allele carriers had obviously higher C3 levels than those with the GG genotype [22]. Another study conducted in European systemic lupus erythema-tosus families revealed that the rs344555 polymorphism Table 2Distribution of the allelic and genotypic frequencies of
C3polymorphisms in CAD and controls
Tag SNPs Genotypes/ Allele CAD Control χ2
P
rs2230205 GG 149 106 1.698 0.428 (n= 1013) GA 293 240
AA 134 91
G 591 452 0.034 0.858 A 561 422
rs2287848 CC 416 331 2.441 0.295 (n= 1014) CT 153 98
TT 8 8
C 985 760 1.062 0.332 T 169 114
rs2250656 AA 347 261 0.335 0.846 (n= 926) AG 162 114
GG 23 19
A 856 636 0.019 0.906 G 208 152
rs7257062 TT 301 244 3.154 0.207 (n= 1015) TC 238 156
CC 40 36
T 840 644 0.437 0.512 C 318 228
rs11672613 TT 185 130 1.097 0.578 (n= 993) TC 283 215
CC 97 83
T 653 475 1.047 0.315 C 477 381
rs2277984 AA 133 118 2.202 0.332 (n= 943) AG 295 209
GG 109 79
A 561 445 1.226 0.284 G 513 367
rs344555 GG 273 190 1.108 0.575 (n= 872) GA 197 145
AA 35 32
G 743 525 0.890 0.355 A 267 209
rs2241393 GG 194 170 4.639 0.098 (n= 1015) GC 287 209
CC 98 57
Table 3Associations of the tag SNPs genotypes and serum lipid levels in the CAD patients and controls
TagSNPs Groups Genotypes TC (mmol/l) TG(mmol/l) HDL-C(mmol/l) LDL-C(mmol/l) ApoA1(g/l) ApoB (g/l) rs2230205 CAD GG 4.468 ± 1.133 1.330(0.975–2.125) 1.104 ± 0.270 2.822 ± 0.999 1.193 ± 0.222 0.952 ± 0.330
GA 4.653 ± 1.046 1.490(1.070–2.105) 1.066 ± 0.257 3.014 ± 0.948 1.174 ± 0.225 0.984 ± 0.285 AA 4.612 ± 1.000 1.490(1.128–2.100) 1.071 ± 0.296 2.991 ± 0.888 1.169 ± 0.215 0.978 ± 0.256 P 0.218 0.252 0.369 0.121 0.617 0.533 Control GG 4.375 ± 0.928 1.415(0.988–2.148) 1.165 ± 0.283 2.593 ± 0.763 1.243 ± 0.226 0.893 ± 0.247
GA 4.504 ± 0.995 1.345(0.930–1.958) 1.165 ± 0.307 2.718 ± 0.837 1.242 ± 0.248 0.922 ± 0.282 AA 4.317 ± 0.860 1.340(0.940–1.930) 1.169 ± 0.358 2.566 ± 0.724 1.218 ± 0.244 0.875 ± 0.220 P 0.218 0.315 0.995 0.196 0.704 0.294 rs2287848 CAD CC 4.578 ± 1.047 1.470(1.080–2.235) 1.071 ± 0.265 2.939 ± 0.943 1.183 ± 0.225 0.977 ± 0.296
CT 4.626 ± 1.089 1.450(1.005–1.895) 1.084 ± 0.280 2.987 ± 0.974 1.161 ± 0.216 0.969 ± 0.283 TT 4.914 ± 1.236 1.135(0.953–1.643) 1.274 ± 0.345 3.233 ± 1.028 1.246 ± 0.184 0.941 ± 0.194 P 0.617 0.165 0.100 0.617 0.391 0.913 Control CC 4.384 ± 0.894 1.340(0.950–1.960) 1.157 ± 0.311 2.631 ± 0.730 1.219 ± 0.234 0.887 ± 0.236
CT 4.627 ± 1.129 1.430(0.990–2.180) 1.206 ± 0.320 2.736 ± 1.005 1.307 ± 0.255 0.971 ± 0.334 TT 4.120 ± 0.741 1.465(1.038–1.998) 1.035 ± 0.240 2.684 ± 0.673 1.113 ± 0.207 0.845 ± .0.141 P 0.054 0.410 0.199 0.522 0.002 0.018 rs2250656 CAD AA 4.653 ± 1.059 1.510(1.100–2.270) 1.079 ± 0.265 3.000 ± 0.951 1.179 ± 0.206 0.983 ± 0.288
AG 4.544 ± 1.091 1.370(0.978–2.030) 1.072 ± 0.274 2.924 ± 0.962 1.178 ± 0.241 0.973 ± 0.304 GG 4.396 ± 0.867 1.350(1.030–1.750) 1.157 ± 0.297 2.684 ± 0.790 1.179 ± 0.195 0.867 ± 0.220 P 0.347 0.315 0.360 0.253 1.000 0.177 Control AA 4.400 ± 0.894 1.370(0.990–1.470) 1.157 ± 0.300 2.648 ± 0.750 1.217 ± 0.232 0.898 ± 0.245
AG 4.557 ± 1.038 1.305(0.893–1.990) 1.191 ± 0.346 2.763 ± 0.916 1.266 ± 0.254 0.915 ± 0.268 GG 4.196 ± 1.156 1.230(0.870–1.600) 1.197 ± 0.232 2.427 ± 0.676 1.262 ± 0.256 0.801 ± 0.340 P 0.183 0.062 0.561 0.175 0.177 0.205 rs7257062 CAD TT 4.612 ± 1.078 1.450(1.070–2.095) 1.085 ± 0.275 2.987 ± 0.990 1.187 ± 0.225 0.977 ± 0.293
TC 4.615 ± 1.053 1.470(1.050–2.110) 1.065 ± 0.268 2.947 ± 0.915 1.165 ± 0.217 0.979 ± 0.293 CC 4.378 ± 0.923 1.400(1.045–2.193) 1.086 ± 0.237 2.804 ± 0.846 1.194 ± 0.230 0.927 ± 0.266 P 0.398 0.742 0.686 0.506 0.484 0.559 Control TT 4.483 ± 0.987 1.440(0.993–2.315) 1.152 ± 0.299 2.699 ± 0.849 1.242 ± 0.230 0.930 ± 0.283
TC 4.404 ± 0.893 1.245(0.923–1.703) 1.186 ± 0.331 2.641 ± 0.696 1.241 ± 0.251 0.8790.282 CC 4.222 ± 0.987 1.540(0.850–2.208) 1. 168 ± 0.322 2.423 ± 0.844 1.184 ± 0.278 0.860 ± 0.220 P 0.276 0.015 0.570 0.149 0.388 0.960 rs11672613 CAD TT 4.629 ± 1.183 1.300(1.020–1.890) 1.117 ± 0.263 3.031 ± 1.104 1.195 ± 0.203 0.966 ± 0.295
TC 4.611 ± 0.978 1.560(1.130–2.300) 1.055 ± 0.263 2.941 ± 0.837 1.176 ± 0.233 0.990 ± 0.288 CC 4.500 ± 1.058 1.490(0.995–2.150) 1.067 ± 0.292 2.884 ± 0.949 1.148 ± 0.202 0.940 ± 0.284 P 0.596 0.004 0.044 0.419 0.234 0.318 Control TT 4.460 ± 1.065 1.335(0.988–2.155) 1.158 ± 0.296 2.705 ± 0.983 1.242 ± 0.219 0.921 ± 0.280
TC 4.441 ± 0.934 1.310(0.960–1.900) 1.174 ± 0.316 2.656 ± 0.695 1.248 ± 0.253 0.907 ± 0.271 CC 4.350 ± 0.829 1.480(0.930–2.130) 1.144 ± 0.327 2.580 ± 0.746 1.194 ± 0.244 0.874 ± 0.204 P 0.692 0.412 0.784 0.545 0.217 0.446 rs2277984 CAD AA 4.542 ± 1.006 1.350(1.015–1.990) 1.059 ± 0.250 2.976 ± 0.905 1.148 ± 0.239 0.942 ± 0.279
Table 3Associations of the tag SNPs genotypes and serum lipid levels in the CAD patients and controls(Continued)
TagSNPs Groups Genotypes TC (mmol/l) TG(mmol/l) HDL-C(mmol/l) LDL-C(mmol/l) ApoA1(g/l) ApoB (g/l) Control AA 4.424 ± 1.090 1.320(0.905–1.945) 1.174 ± 0.316 2.704 ± 0.982 1.242 ± 0.240 0.907 ± 0.289
AG 4.420 ± 0.882 1.340(0.975–1.965) 1.178 ± 0.332 2.623 ± 0.694 1.245 ± 0.244 0.890 ± 0.245 GG 4.533 ± 0.939 1.450(0.940–2.170) 1.150 ± 0.256 2.708 ± 0.758 1.228 ± 0.241 0.929 ± 0.262 P 0.646 0.538 0.790 0.585 0.875 0.537 rs344555 CAD GG 4.600 ± 0.990 1.440(1.075–2.070) 1.075 ± 0.276 2.973 ± 0.873 1.168 ± 0.213 0.974 ± 0.287
GA 4.541 ± 0.988 1.560(1.045–2.300) 1.071 ± 0.260 2.883 ± 0.896 1.179 ± 0.220 0.962 ± 0.273 AA 5.517 ± 31.687 1.490(1.190–2.390) 1.141 ± 0.274 3.261 ± 1.491 1.267 ± 0.223 1.115 ± 0.438 P 0.005 0.272 0.355 0.084 0.041 0.017 Control GG 4.406 ± 1.029 1.305(0.938–2.013) 1.152 ± 0.296 2.681 ± 0.895 1.224 ± 0.239 0.895 ± 0.275
GA 4.440 ± 0.828 1.320(0.970–1.945) 1.203 ± 0.355 2.643 ± 0.677 1.252 ± 0.238 0.880 ± 0.213 AA 4.334 ± 0.898 1.260(0.948–1.930) 1.102 ± 0.367 2.584 ± 0.720 1.171 ± 0.264 0.908 ± 0.252 P 0.838 0.772 0.158 0.785 0.200 0.790 rs2241393 CAD GG 4.661 ± 0.989 1.530(1.128–2.233) 1.078 ± 0.260 3.001 ± 0.944 1.200 ± 0.238 0.994 ± 0.303
GC 4.571 ± 1.126 1.440–2.060 1.076 ± 0.291 2.958 ± 1.010 1.157 ± 0.211 0.966 ± 0.290 CC 4.535 ± 0.988 1.415(0.960–2.280) 1.077 ± 0.224 2.861 ± 0.765 1.195 ± 0.216 0.959 ± 0.267 P 0.541 0.227 0.995 0.496 0.076 0.494 Control GG 4.511 ± 1.031 1.405(0.970–2.115) 1.157 ± 0.295 2.742 ± 0.895 1.250 ± 0.232 0.928 ± 0.280
GC 4.362 ± 0.887 1.330(0.985–2.045) 1.171 ± 0.332 2.581 ± 0.720 1.236 ± 0.243 0.889 ± 0.261 CC 4.464 ± 0.955 1.360(0.850–1.910) 1.168 ± 0.292 2.670 ± 0.754 1.201 ± 0.266 0.903 ± 0.203 P 0.313 0.511 0.902 0.146 0.421 0.354
CADCoronary artery disease,TCTotal cholesterol,TGTriglyceride,HDL-CHigh density lipoprotein cholesterol,LDL-CLow density lipoprotein cholesterol
was strongly related to the level of C3 and that the rs2277984 polymorphism was weakly correlated with C3 level [23]. Moreover, the variants in the C3 gene might influence the activation pathway by changing the mo-lecular structure of C3, in addition to changing the C3 level [24]. Eight SNPs were selected as tagSNPs in our study. Interestingly, no association betweenC3 polymor-phisms and the C3 level was found in the study, which was inconsistent with previous studies. The reasons for this discrepancy might be partly due to the different eth-nicities, environmental factors and our relatively small sample size. In addition, a GWAS on complement ac-tivation (defined as serum C3d-to-C3 ratio) had been published in patients with AMD recently [25]. It might be interesting to look if C3 polymorphisms were related to the C3d-to-C3 ratio and the CAD risk in our next study.
Previous studies have shown that complement C3 SNPs were significantly associated with the lipid levels and risk of CAD in different populations [11,22,26]. In 2009, Phillips et al. revealed that the polymorphism rs2250656 (in the 2nd intron) was associated with meta-bolic syndrome and lipid levels. Individuals with a C-allele had lower HDL-C levels and higher TG levels than those with a GG genotype [22]. As early as 1972, Dissing et al. found that theC3 gene polymorphism was associ-ated with atherosclerotic disease in the elderly in a population in Copenhagen [26]. Kristensen et al. [27] found that C3F polymorphisms were associated with the incidence of CAD in patients with high blood pressure and suggested that the C3F allele might speed up the process of artery hardening in hypertension patients. C3 gene polymorphisms might effect on the express of C3, which interferes with the metabolism of lipids, and leads to the presence of CAD.
Although many studies on the relationship between
C3 polymorphisms and CAD susceptibility have been conducted to date, the results are inconsistent. Some studies suggested that the C3F polymorphism was not associated with CAD risk [28]. In the present study, we explored the relationship between variants of the C3 gene and the susceptibility to CAD and lipid levels by tagSNPs in a Chinese population. In recent years, two studies were conducted to explore the association be-tween polymorphisms of the Complement 3 gene and diseases in Chinese Han populations [29, 30]. We found the frequencies of alleles in controls in the present study were similar to those in their studies. The results of the present study revealed that C3 polymorphisms were as-sociated with lipid levels, but the genotype and allele dis-tributions inC3 tagSNPs were not significantly different between CAD patients and controls.
There were several potential limitations in the present study. First, the tagSNPs were selected using MAF≥0.1
and r2≥0.8 as a cutoff, these thresholds might omit some significant but rare variations. Second, the sample size was relatively small. Therefore, future studies with a larger sample size should be conducted to confirm the findings of the current study. Third, diagnosis of control subjects was mainly according to the results of coronary angiography, potentially resulting in selection bias. Fur-ther studies are needed to evaluate the effect ofC3SNPs and serum C3 levels and their contribution to CAD.
Conclusions
The study evaluated the relationship between tagSNPs in C3 gene and lipid levels and CAD risk. The results showed that C3 gene polymorphisms were associated with lipid levels, but not CAD susceptibility in the Chin-ese population.
Supplementary information
Supplementary informationaccompanies this paper athttps://doi.org/10. 1186/s12944-019-1163-8.
Additional file 1: Table S1.TagSNPs inC3gene summary of all study participants.Table S2.Primers ofC3tagSNPs used in the PCR.Table S3. Probes ofC3tagSNPs used in the LDR.Table S4.Associations ofC3
tagSNPs and CAD risk in different comparison models.Table S5.Haplotype analyses in CAD patients and controls.
Abbreviations
Apo:Apolipoprotein; CAD: Coronary artery disease; DM: Diabetes mellitus; EH: Essential hypertension; HDL-C: High density lipoprotein cholesterol; LDL-C: Low density lipoprotein cholesterol; TLDL-C: Total cholesterol; TG: Triglyceride
Acknowledgments
We thank all our colleagues at the Department of Cardiology, Wujin Hospital, affiliated with Jiangsu University.
Authors’contributions
GC conceived and designed the experiments; LL, LY, HH, and LX performed the experiments; GC, YC and LL analyzed the data; GC contributed reagents/ materials/analysis tools; GC, LL and YC wrote the paper. All authors read and approved the final manuscript
Funding
This study was supported by Jiangsu Youth Medical Talents Project (QNRC2016310) and Clinical Medical Science and Technology Development Foundation of Jiangsu University (Grant No. 2018:94).
Availability of data and materials
The datasets used and/or analyzed during the current study are available from the corresponding author on reasonable request.
Ethics approval and consent to participate
This study was performed in accordance with the Declaration of Helsinki and approved by the Ethics Committee of Jiangsu University. All participants signed an informed consent.
Consent for publication Not applicable.
Competing interests
Author details
1Department of Cardiology, Wujin hospital affiliated with Jiangsu University,
the Wujin Clinical college of Xuzhou Medical University, Changzhou, Jiangsu Province 213017, China.2Department of Emergency, the affiliated hospital of Yangzhou university, Yangzhou, Jiangsu Province 225001, China.
3Department of laboratory, Wujin hospital affiliated with Jiangsu University,
the Wujin Clinical college of Xuzhou Medical University, Changzhou, Jiangsu Province 213017, China.
Received: 8 October 2019 Accepted: 29 November 2019
References
1. Nowbar AN, Gitto M, Howard JP, Francis DP, Al-Lamee R. Mortality from ischemic heart disease. Circ Cardiovasc Qual Outcomes. 2019;12(6):e005375 [PMID:31163980].
2. National Center for Cardiovascular Diseases, China. Report on Cardiovascular Diseases in China. Beijing: Encyclopedia of China Publishing House; 2018; 2019.
3. Ellis KL, Hooper AJ, Pang J, Chan DC, Burnett JR, Bell DA, Schultz CJ, Moses EK, Watts GF. A genetic risk score predicts coronary artery disease in familial hypercholesterolaemia: enhancing the precision of risk assessment. Clin Genet. 2019. p. 1–7. [Epub ahead of print]. [PMID:31571196]. 4. Shields KJ, Mollnes TE, Eidet JR, Mikkelsen K, Almdahl SM, Bottazzi B, Lyberg
T, Manzi S, Ahearn JM, Hollan I. Plasma complement and vascular complement deposition in patients with coronary artery disease with and without inflammatory rheumatic diseases. PLoS One. 2017;12(3):e0174577 [PMID:28362874].
5. Jin H, Yan C, Xiao T, Yan N, Xu J, Zhou L, Zhou X, Shao Q, Xia S. High fish oil diet promotes liver inflammation and activates the complement system. Mol Med Rep. 2018;17(5):6852–8 [PMID:29512716].
6. Bratti LOS. Do Carmo ÍAR, Vilela TF, Wopereis S, de Moraes ACR, Borba BGM, Souza LC, Filippin-Monteiro FB. Complement component 3 (C3) as a biomarker for insulin resistance after bariatric surgery. Clin Biochem. 2017; 50(9):529–32 [PMID:28188738].
7. RM AIHA, HA AI-D. Complement 3 serum levels as a pro-inflammatory biomarker for insulin resistance in obesity. Diabetes Metab Syndr. 2017; 11(Suppl 1):S229–32. [PMID:28017633].
8. Ursini F, Abenavoli L. The emerging role of complement C3 as a biomarker of insulin resistance and cardiometabolic diseases: preclinical and clinical evidence. Rev Recent Clin Trials. 2018;13(1):61–8 [PMID:29189176]. 9. Jiang H, Guo M, Dong L, Cao C, Wang D, Liang X, Guo F, Xing Z, Bu P, Liu J.
Levels of acylation stimulating protein and the complement component 3 precursor are associated with the occurrence and development of coronary heart disease. Exp Ther Med. 2014;8(6):1861–6 [PMID:25371745]. 10. van Greevenbroek MM, Jacobs M, van der Kallen CJ, Blaak EE, Jansen EH,
Schalkwijk CG, Feskens EJ, Stehouwer CD. Human plasma complement C3 is independently associated with coronary heart disease, but only in heavy smokers (the CODAM study). Int J Cardiol. 2012;154(2):158–62 [PMID: 20926148].
11. Nsaiba MJ, Lapointe M, Mabrouk H, Douki W, Gaha L, Pérusse L, Bouchard C, Jrad BB, Cianflone K. C3 polymorphism influences circulating levels of C3, ASP and lipids in schizophrenic patients. Neurochem Res. 2015;40(5):906–14 [PMID:25720829].
12. Leban N, Jraba K, Chalghoum A, Hassine S, Elhayek D, Denden S, Lakhdhar R, Maatoug F, Gamra H, Braham H, Ben Chibani J, Khelil AH. Polymorphism of C3 complement in association with myocardial infarction in a sample of Central Tunisia. Diagn Pathol. 2013;8:93 [PMID:23764154].
13. Cai G, Shi G, Xue S, Lu W. The atherogenic index of plasma is a strong and independent predictor for coronary artery disease in the Chinese Han population. Medicine (Baltimore). 2017;96(37):e8058 [PMID:28906400]. 14. Cai G, Yu L, Huang Z, Li L, Fu X. Serum PCSK9 levels, but not PCSK9
polymorphisms, are associated with CAD risk and lipid profiles in southern Chinese Han population. Lipids Health Dis. 2018;17(1):213 [PMID:30205809]. 15. Cai G, Zhang B, Shi G, Weng W, Yang L, Xue S. Endothelial lipase genetic
polymorphisms and the lipid-lowering response in patients with coronary artery disease on rosuvastatin. Lipids Health Dis. 2016;15(1):148 [PMID:276 00285].
16. Borné Y, Muhammad IF, Lorés-Motta L, Hedblad B, Nilsson PM, Melander O, de Jong EK, Blom AM, den Hollander AI, Engström G. Complement C3 associates with incidence of diabetes, but no evidence of a causal
relationship. J Clin Endocrinol Metab. 2017;102(12):4477–85 [PMID:29029276 ].
17. Rasmussen KL, Nordestgaard BG, Nielsen SF. Complement C3 and risk of diabetic microvascular disease: a cohort study of 95202 individuals from the general population. Clin Chem. 2018;64(7):1113–24 [PMID:29523638]. 18. Yan W, Che L, Jiang J, Yang F, Duan Q, Song H, Liu X, Shen Y, Wang L.
Depletion of complement system immunity in patients with myocardial infarction. Mol Med Rep. 2016;14(6):5350–6 [PMID:27840920]. 19. Shao A, Qi X, Li Q, Jia W, Wei L, Hou W, Qi Y, Liu Y. Dynamic changes of
complement level in patients with acute coronary syndrome and its relationships with myocardial injury. Zhonghua Wei Zhong Bing Ji Jiu Yi Xue. 2017;29(6):515–9 [PMID:28625240].
20. King R, Tiede C, Simmons K, Fishwick C, Tomlinson D, Ajjan R. Inhibition of complement C3 and fibrinogen interaction: a potential novel therapeutic target to reduce cardiovascular disease in diabetes. Lancet. 2015;385(Suppl 1):S57 [PMID:26312879].
21. Chowdhury SJ, Karra VK, Gumma PK, Bharali R, Kar P. rs2230201 polymorphism may dictate complement C3 levels and response to treatment in chronic hepatitis C patients. J Viral Hepat. 2015;22(2):184–91 [PMID:24995942].
22. Phillips CM, Goumidi L, Bertrais S, Ferguson JF, Field MR, Kelly ED, Peloso GM, Cupples LA, Shen J, Ordovas JM, McManus R, Hercberg S, Portugal H, Lairon D, Planells R, Roche HM. Complement component 3 polymorphisms interact with polyunsaturated fatty acids to modulate risk of metabolic syndrome. Am J Clin Nutr. 2009;90(6):1665–73 [PMID:19828715]. 23. Rhodes B, Hunnangkul S, Morris DL, Hsaio LC, Graham DS, Nitsch D, Whittaker
JC, Vyse TJ. The heritability and genetics of complement C3 expression in UK SLE families. Genes Immun. 2009;10(5):525–30 [PMID:19387462].
24. Sfyroera G, Ricklin D, Reis ES, Chen H, Wu EL, Kaznessis YN, Ekdahl KN, Nilsson B, Lambris JD. Rare loss-of-function mutation in complement component c3 provides insight into molecular and pathophysiological determinants of complement activity. J Immunol. 2015;194(7):3305–16 [PMID:25712219].
25. Lorés-Motta L, Paun CC, Corominas J, Pauper M, Geerlings MJ, Altay L, Schick T, Daha MR, Fauser S, Hoyng CB, den Hollander AI, de Jong EK. Genome-wide association study reveals variants in CFH and CFHR4 associated with systemic complement activation: implications in age-related macular degeneration. Ophthalmology. 2018;125(7):1064–74 [PMID:29398083].
26. Dissing J, Lund J, Sorensen H. C3 polymorphism in a group of old arteriosclerotic patients. Hum Hered. 1972;22(5):466–72 [PMID:4670067]. 27. Kristensen BO, Petersen GB. Association between coronary heart disease and the C3F-gene in essential hypertension. Circulation. 1978;58(4):622–5 [PMID:688571].
28. Golabi P, Kshatriya GK, Kapoor AK. Association of genetic markers with coronary heart disease (myocardial infarction) - a case-control study. J Indian Med Assoc. 1999;97(1):6–7 [PMID:10549177].
29. Wu L, Tao Q, Chen W, Wang Z, Song Y, Sheng S, Li P, Zhou J. Association between polymorphisms of complement pathway genes and age-related macular degeneration in a Chinese population. Invest Ophthalmol Vis Sci. 2013;54(1):170–4 [PMID: 23233260].
30. Zhang S, Zhou N, Liu R, Rao W, Yang M, Cao B, Kang G, Kang Q, Zhu X, Li R, Yu Y, Yu Q. Association between polymorphisms of the complement 3 gene and schizophrenia in a Han Chinese population. Cell Physiol Biochem. 2018;46(6):2480–6 [PMID:29742493].
Publisher’s Note