DOI: 10.22075/JRCE.2018.12825.1226
journal homepage: http://civiljournal.semnan.ac.ir/
Fatigue Evaluation in Hot and Warm Mix Asphalts
Based on Dissipated Energy
S.R. Moafimadani1*, S. Hesami2 and K. Rahimov3
1. Assistant Professor, Department of Civil Engineering, Pooyesh Institute of Higher Education, Qom, Iran 2. Assistant Professor Department of Civil-Environmental Engineering, Babol Noshirvani University of Technology, Babol
3. Assistant Professor in Department of Civil Engineering, Payame Noor University, P.O. Box 19395-3697, Tehran, Iran
Corresponding author:[email protected]
ARTICLE INFO ABSTRACT
Article history:
Received: 25 October 2017 Accepted: 14 July 2018
Warm mix asphalts (WMA), because of their low production and compact temperatures, may have different behaviors in long term. In the present work, the energy-based criteria along with the 50% reduction in initial stiffness (Nf50%) using four-point bending test under controlled-strain conditions of 1000 microstrain were applied to compare the prepared two warm mix and HMA samples. All these criteria illustrate properly the effect of mix asphalt properties (additive type) on its fatigue performance. A noteworthy point in this regard is the difference between Nf50% values of the studied samples with the real failure point. For HMA and zycotherm WMA (ZWMA), loading cyclic number at the failure moment occurs almost 80% higher than the fatigue life estimated using Nf50% while for Sasobit WMA (SWMA) this value is declined to 28%. The RDEC method, compared to other methods, indicated the maximum fatigue life and consistency with the failure point. Comparing the energy-based methods with Nf50% method revealed that ERR, ERR&B, and ERP have the maximum consistency with fatigue life in terms of 50% reduction in initial stiffness. For SWMA, the fatigue life at Nf50% was larger than that of various energy-based methods but almost equal to that of the RDEC method. However, for two WMA mixes prepared using ZWMA and HMA, all energy methods revealed a fatigue life longer than that of Nf50%.
Keywords: Fatigue Life, Dissipated Energy, Rate of Dissipated Energy Change (RDEC),
50% Reduction in Initial Stiffness (Nf50%), Warm Mix, Warm Additive.
1. Introduction
Warm mix asphalt (WMA) is a novel asphalt production technology that can compete for
consumption, providing they have also a better long-term performance compared to HMAs.
Among other benefits of WMA are their improved working conditions for workers during the mixing and distribution process because of the reduced fume, pollutants, and odors, as well as the larger area of each workshop and, in turn, a lower number of workshops that consequently leads to less pollution because of the lower compact temperature and possibility to transport asphalt to more remote destinations. In the meanwhile, the lower production temperature results in the declined aging rate of the consumed bitumen, followed by its better cohesion and the reduced number of cracks [1, 2].
Many researchers have recently investigated the effect of warm additives on performance of WMA in aspects such as moisture sensitivity, permanent deformation potential, low-temperature fatigue and thermal cracking, and aging [3, 4, 5].
Considering the lower production temperature of WMA, the drop in production temperature and compaction reduces oxidation hardening and their negative effect on bitumen-aggregate cohesion. The reduced aging is the main cause of the prolonged fatigue life while the reduced cohesion temperature drop and presence of water are considered negative factors in the fatigue behavior of WMA due to the declining adhesion between bitumen and aggregates. Thus, there are two opposing parameters and it is not known which one is more effective. This ambiguity is also seen in the results reported by various researchers as for one warm additive they report different results. In recent research was conducted by Fan Yin et.al (2017), the effect of WMA technology on mixture stiffness evolution with field
ageing compared to HMA was categorized into three different scenarios:
(a) Scenario I: the stiffness of HMA cores was higher than WMA, but the difference in stiffness between these two mixtures reduced with field ageing;
(b) Scenario II: HMA had higher mixture stiffness compared to WMA at the initial ageing stage (i.e. construction cores), but the WMA stiffness was eventually equivalent to that of HMA after certain in-service times in the field;
(c) Scenario III: equivalent mixture stiffness was shown for construction cores between HMA and WMA, but higher stiffness for post-construction cores was observed for WMA versus HMA [6].
According to Ziari et al.(2016), Sasobit additive increases fatigue life up to 50% while Rheofalt leads to the reduced fatigue life of the produced specimens [9]. This result was showed in other researchers for Sasobit [10, 11].
Elsewhere, the fatigue behavior of HMA and WMA was evaluated based on complex modulus and indirect tensile stiffness. In this study, the damage was assessed based on 50% shear modulus and damage growth rate. The difference between the initial shear modulus at two test temperatures revealed that WMA specimens are stiffer than HMA ones. Such a difference is attributed to crystallization of synthetic was at temperatures below the melting point. [12] This explanation for the mix stiffening was also proved elsewhere [13, 14]. Based on the obtained results, the fatigue behavior of HMA and WMA mixes indicates a high correlation, meaning that this behavior depends on the initially exerted deformation level; which is consistent with results of other works [13]. This slight difference in the primary results may imply that addition of synthetic was for WMA production and lower temperatures do not weaken the shear fatigue response.
The results of Farinaz Safaei et al. (2014) showed that the HMA mixtures perform better than the WMA mixtures due to the superior performance of the HMA during the first two levels of ageing. They showed that at short-term ageing (STA) and long-term ageing in level 1 (LTA1), the HMA has superior fatigue performance compared with the WMA. However, at long-term ageing in level 3 (LTA3), the differences in fatigue performance between the WMA and HMA become negligible, indicating that the effects of reduced shortterm ageing in WMA compared with HMA diminish with
increasing LTA for this pavement structure [15].
2. Fatigue Criterion for Asphalt
Mixes
Studying fatigue phenomenon in flexible pavements has been originally conducted in 1940, as the number and an axial load of the vehicles increased drastically. Van der Pool and Nijboer showed that the cracks typically initiated since the end of paving life are developed due to the tensile stress created by vehicle tires. In this regard, Hveem studied the relationship between deformation and axial load in paving and showed that crack initiation is controlled by the magnitude of applied load and its cycles. The results reported by WASHO and AASHTO also confirm these statements [16].
Models for fatigue cracking used in asphalt pavement engineering generally can be divided into four categories:
1. The strain approach
2. The dissipated energy approach 3. The fracture mechanics approach; and 4. The continuum damage mechanics approach
In the strain approach, the fatigue resistance is expressed as the number of load applications to failure, which is related to the tensile strain by a regression function developed based on the test data. In the dissipated energy approach, similarly, the fatigue resistance is represented using a regression function between the dissipated energy and the number of load applications to failure.
Another important mechanics approach that studies cracking damage is continuum damage mechanics. Compared to fracture mechanics, it has the advantage of considering all cracks as damage and measures the damage by the effects of all cracks on the macroscopic response of the material (nonlinear stress-strain behavior and degradation of material stiffness) [17, 18]. In this study second method is used that more explanation is below.
Fatigue test is carried out on two controlled-stress and controlled-strain modes. According to Nonismith (1967), controlled-stress and controlled-strain tests are carried out for pavements thicker than 152 and 51 mm, respectively; while for the intermediate thicknesses, a combination of two modes is applied [19]. In this regard, Monismith and Deacon proposed a constant called as loading coefficient (M) for different loading modes [20].
Fatigue criterion is different when applying controlled-stress and controlled-strain modes, as in the former fatigue criterion is crack initiation in the test sample while in the latter defining failure point is difficult since the strain is constant during the test. In this connection, researchers have proposed different procedures: the common method is the failure point equivalent to 50% reduction in initial stiffness (Nf50%) which is proposed by Ponk et al. and Tayebali et al. [21, 22]. On the other hand, some other researchers propose an energy-based analysis for fatigue life determination [23, 24]. In SHRP report, the dissipated energy is applied for fatigue analysis. This energy in each cycle is obtained by measuring the area of the residual strain-stress curve. Similar to the stress-controlled case, the dissipated energy declines by a drop in loading cycles within the strain-controlled test [25].
Hopman et al. (1989) defined “energy ratio” for fatigue failure [26]. The energy ratio for constant strain equals the energy dissipated at cycle 1 (W1) multiplied by N all divided by the dissipated energy in Nth cycle (WN):
N
W W N
ER . 1 (1)
These authors plotted energy ratio (ERH) with a laoding cycles and defined crack initiation moment equivalent to the point at which curve gradient is changed.
Rowe (1993) presented a formula to determine fatigue life. Where E′′ is the decreased modulus value in the ith cycle [27].
" 1 ) 1 sin 1
( E
N E
N R
(2)
Rowe (1993) defined this parameter, as energy was the ratio (ERR). Based on this criterion, the change in the slope of energy ratio with corresponding test number is equivalent to crack initiation. This concept means that loading cycle for a 50% reduction in initial stiffness (failure moment) exceeds the loading cycle corresponding to the slope change point in the curve of energy decrease ratio versus loading cycles (crack initiation). In comparison, Alkhateeb et al. (2004) showed that fatigue life estimated using energy drop ratio does not follow this trend and exceeds the fatigue life equivalent to 50% reduction in initial stiffness [28].
Pronk (1997) defined energy ratio (ERP) as the ratio of cumulative dissipated energy until nth loading cycle to the wasted energy at nth cycle [29], as follows:
n n
i i
w
w
ER
1(3)
point is defined as a criterion of failure initiation point. At constant strain, the maximum value of this curve is equal to fatigue life. The shortcomings of the methods proposed by Row and Hopman also exist in this method.
To deal with these problems (the difference in loading mode), Rowe and Boulding (2000) presented energy ratio as Equation 4 [30]: 𝐸𝑅 = 𝑛 × 𝑠 (4)
Where, s is stiffness and n is loading cycles. In this method, for both controlled stress and controlled strain modes, by plotting the curve of energy ratio (ERR&B) versus loading cycles, the maximum energy ratio is defined as a criterion of cracking initiation. In this method, the probability of user’s effect in the determination of the corresponding point for crack initiation is almost zero. The results of this method show that fatigue life is 35 to 65% of the initial hardness.
Based on previous studies, the total dissipation energy and energy ratio cannot be appropriate criteria for determining the fatigue behavior of asphalt mixes. Thus, the RDEC method was proposed by Ghuzlan and Carpenter (2000) which is independent of testing conditions and loading mode. Based on this method, the RDEC in two successive cycles (rather than cumulative dissipated energy) is applied to estimate fatigue life using Eq. 5, where a and b are loading cycles with a difference not exceeding 100 [31, 32]. RDECa=
|DEa−DEb|
DEa×(b−a) (5)
Figure 1 illustrates the curve prepared for this method that consists of three distinct zones. In Zone 1, the slope is sharp and dissipated energy difference between the cycles is high due to the aggregate displacement. The variation rate of the dissipated energy in Zone 2 is horizontal and the vertical value in this zone is called as plateau value (PV). PV
is severely controlled by the initial loading conditions, stress, strain, and dissipated energy. Zone 3, similar to Zone 1, has a sharp slope where the specimen is failed.
Figure 1 illustrates the curve prepared for this method that consists of three distinct zones. In Zone 1, the slope is sharp and dissipated energy difference between the cycles is high due to the aggregate displacement. The variation rate of the dissipated energy in Zone 2 is horizontal and the vertical value in this zone is called as plateau value (PV). PV is severely controlled by the initial loading conditions, stress, strain, and dissipated energy. Zone 3, similar to Zone 1, has a sharp slope where the specimen is failed.
In this study conducted by Ghuzlan and Carpenter, it was found that there is a high correlation between PV and failure energy, which can be expressed as Equation 6 where c and d are regression constants [33].
𝑃𝑉 = cNfd (6) Similarly, the dissipated energy involves the viscoelastic dissipated energy and the failure induced by plastic deformation or crack growth. Hence, Equation 6 can be extended as follows:
𝑃𝑉 = cNfd = RDECa =
|DEa−DEb|
DEa×(b−a)=
Eaξ+Eη−Ebξ−Eη (Eaξ+Eη)×(b−a)≈
Eaξ−Ebξ (Eη)×(b−a)=
∆Eξ
Eη (7)
Equation 7 can be rewritten as follows (Equation 8):
𝑃𝑉 × 𝑁𝑓 = cNfd+1 =Etotal
ξ
Eη (8)
To make this approach independent of loading mode, PV × Nf must be a constant value; i.e., an increase in PV must lead to a decrease in Nf. Hence, it can be stated that the more PV is the longer mix life is. To make PV × Nf constant, d must be -1. Carpenter et al. (2006) reported d within -0.7 to -1.1, implying the higher independence percentage of this method [33].
Fig. 1. A general view of variation rate in
dissipated energy
In the present work, fatigue life was determined for HMA and two WMA with Sasobit and Zycotherm additives tested under controlled strain method using energy ratio and variation ratio of dissipated energy and comparing these criteria with 50% reduction in initial stiffness criterion.
3. The Materials and Preparation of
the Samples
3.1. Asphalt Binder
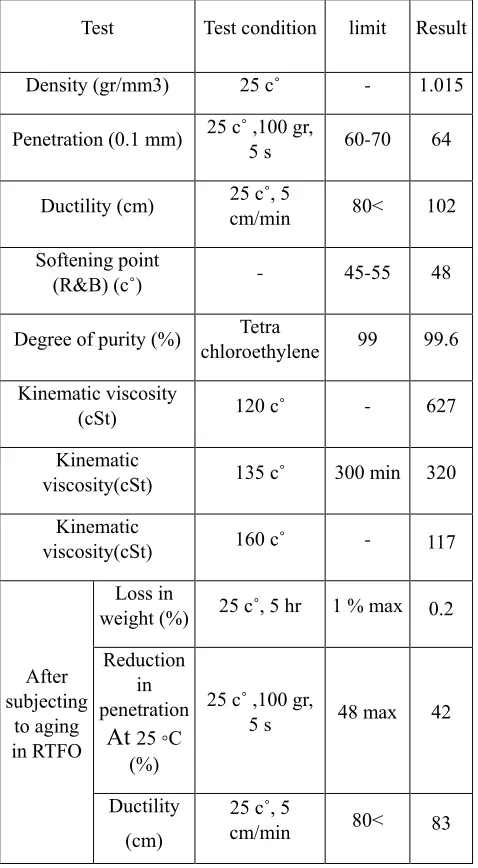
The bitumen used in the research is pure bitumen with penetration degree of 60/70 and performance grade of PG- 64-16 purchased from Pasargad Oil Company. The common tests of bitumen were carried out according to the ASTM standards. The results are shown in Table 1.
Table 1. Properties of the pure asphalt binder.
Test Test condition limit Result
Density (gr/mm3) 25 c˚ - 1.015
Penetration (0.1 mm) 25 c˚ ,100 gr,
5 s 60-70 64
Ductility (cm) 25 c˚, 5
cm/min 80< 102
Softening point
(R&B) (c˚) - 45-55 48
Degree of purity (%) Tetra
chloroethylene 99 99.6
Kinematic viscosity
(cSt) 120 c˚ - 627
Kinematic
viscosity(cSt) 135 c˚ 300 min 320
Kinematic
viscosity(cSt) 160 c˚ - 117
After subjecting
to aging in RTFO
Loss in
weight (%) 25 c˚, 5 hr 1 % max 0.2
Reduction in penetration
At 25 ◦C (%)
25 c˚ ,100 gr,
5 s 48 max 42
Ductility (cm)
25 c˚, 5
cm/min 80< 83
3.2. Additives
The most common and available additive is Sasobit, which is also called as Fisher-Tropsch wax. This additive is derived by heating coal or natural gas with water at 180 to 280℃ in the presence of a catalyst [34]. The effect of Sasobit on the rheological behavior of the modified bitumen depends on the content of this additive, test procedure, and production temperature.
family (Si-OH) which is synthesized by Zydex Company. This material develops a siloxane bond (Si-O-Si) with the surface of inorganic materials. These bonds are hydrophobic and are not washed because of their bonds with material surfaces. Bitumen contains molecular compounds containing carbon, oxygen, and hydrogen which the liquid additive makes bonds with its polar groups and make them bitumenophile by creating chemical bonds, leading to the enhanced adhesion of the bitumen to materials surface [35].
This additive also decreases the viscosity of bitumen and, consequently, it results in the better coating of the aggregates even at temperatures below production temperature of HMA. This liquid additive easily mixes with bitumen at temperatures above 115℃. Using this additive in HMA can reduce production temperature about 30 to 40 ℃, implying that mix temperatures below 140℃ can be achieved. The specifications of two Sasobit and liquid additives are presented in Table 2.
Table 2. Properties of WMA additives.
Properties Zycoth
erm
Sasobit Ingredients organosilane Aliphatic
polyethylene
hydrocarbon Physical
state
Liquid Pastille and Prill
Color Yellow White
Odor Light Odor Odorless
Bulk
density
1010 kg / m³ 590-622 kg / m³
Flash point 80ºC 290ºC
Solubility
in water
soluble Insoluble
Dosage 0.1-0.2 % 1-3 %
3.3. Modified Bitumen Preparation
To provide continuity in the molecular composition of the Zycotherm with bitumen, it must be added by a dropper to the hot bitumen while being stirred with an ordinary sitter and creating a vortex 2 to 3 cm in depth. After this step, the bitumen stirring continues for further 10 min to initiate the necessary reactions. Sasobit is added to the
hot bitumen in a way similar to that of the liquid additive, and then these two additives are mixed with an ordinary stirrer.
3.4. The Mix
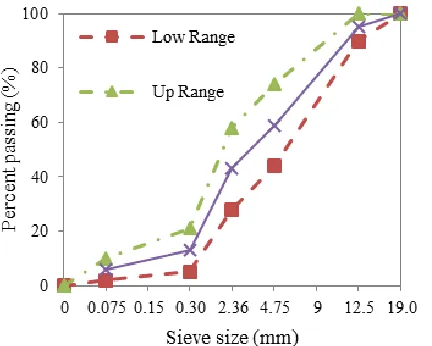
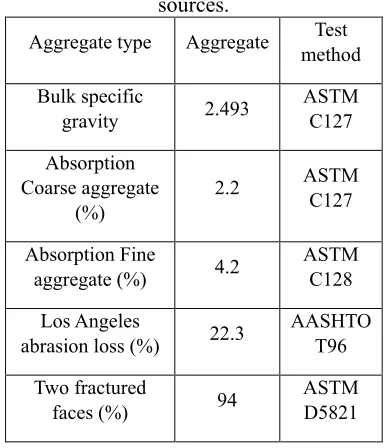
The samples needed for laboratory tests were prepared by adding 2 wt.% Sasobit and 0.10 wt.% Zycotherm to them (determined in bitumen laboratory) as 30 cm × 40 cm asphalt slabs using a rolling compactor [35]. Next, using the cutting instrument, asphalt slabs with a dimension of 5cm × 6cm × 38.5cm were prepared. From each compacted all 4 laboratory samples were prepared. The volumetric properties of the sample (which were all 4 ± 0.5) were measured for void control. The material for all samples was dolomitic limestone. The grain size distribution curves for the preparation of asphalt mixes and their other specifications are shown in Figure 2 and Table 2, respectively.
For the design of asphalt mixes, Gyratory method was applied. The laboratory samples were produced using the optimum bitumen content at 140 and 165℃ for WMA and HMA, respectively.
Table 3. Engineering properties of aggregate sources.
Aggregate type Aggregate Test method
Bulk specific
gravity 2.493
ASTM C127
Absorption Coarse aggregate
(%)
2.2 ASTM C127
Absorption Fine
aggregate (%) 4.2
ASTM C128
Los Angeles
abrasion loss (%) 22.3
AASHTO T96
Two fractured
faces (%) 94
ASTM D5821
4. Test Procedure
To carry out fatigue test, the four-point bending device manufactured by IPC Co. was utilized. The tests were performed according to AASHTO T321 standard at 20℃ with a simi sinusoidal loading at a 10 Hz frequency 1000 strain level. All samples were put for 5 hours in a tight heating container until reaching the required temperature. The temperature of container and surface and center of the specimens were measured as the reference temperature. The test started once the average of these three temperatures reached 20℃ ± 5%. The maximum stress and strain for the required measurements were recorded by the test apparatus. In this test, the moment the apparatus stops in strain-controlled mode is considered as the failure criterion for asphalt. The bending hardness (J/m3) of the fatigue beam sample is defined according to Equation (9):
𝑆 = (.357𝑃)/(𝑏ℎ)12𝛿ℎ
(3𝐿2−4𝑎2)
(5)
Where, P is the applied load (N); b is the mean sample width (m); h is the mean sample height (m); δ is the maximum deformation in the middle of beam (m); L is the distance between supports (typically 0.357 m); and a is the distance between loading jaws (typically 0.1185 m). The dissipated energy in each cycle (kpa) for fatigue beam is calculated using Equation 10.
𝐷 = 𝜋𝜎𝑡𝜀𝑡sin(∅) (10)
All parameters were defined earlier.
5. Results Analysis
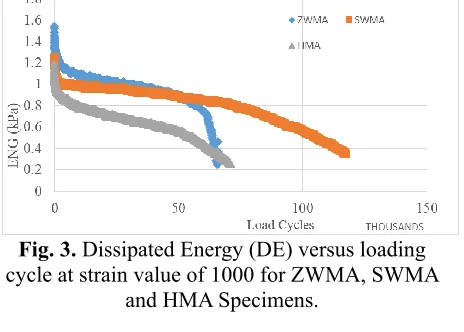
The four-point bending tests were carried out to determine parameters such as stiffness, the dissipated energy and accumulate dissipated energy in each cycle, phase angle, and stress; with the first two being as most important and practical parameters. The obtained results for dissipated energy variations and stiffness values are shown in Tables 3 and 4, respectively. As shown in Figure 3, an increase in loading cycle leads to the reduced dissipated energy. DE value is severely reduced at the beginning of the curve (Step 1). Next, this decreasing trend becomes linear (Step 2). Finally, the decreasing trend again becomes severe and the specimen is failed (Step 3). The high fall in DE at Step 1 generates considerable heating and results in materials compaction. Transfer of this heat leads to the increase in sample’s temperature and a decrease in its stiffness [24]The linear decrease in DE in Step leads to initiation of microcracks that result in utter failure of the sample in Step 3 [36].
than that of Zycotherm- warm mix asphalt (ZWMA). The dissipated energy trend for ZWMA and HMA are more severe than that of SWMA, implying the quicker changes and failure and microcrack growth inside the mix. According to Equations 7 and 8, the higher ∆E^ξ is the greater PV would be; indicating the reduced fatigue life of the specimen. Accordingly, the steeper slope of DE curve implies larger ∆E^ξ and, consequently, shorter fatigue life seen in ZWMA and HMA.
Figure 4 illustrates variations of bending stiffness for samples ZWMA, SWMA, and HMA at the initial 1000 microstrain. As shown in this figure, similar to DE diagram, the variations in bending stiffness with loading cycles can be separated into three distinct zones. Zone 1 has a steep slope where the increase in loading cycle accompanies severe changes in bending stiffness. Followed by this zone, Zone 2 starts with a gentle slope, where microcracks are initiated in the specimen. By further increasing the loading cycles, the testing sample is failed in Zone 3 [37].
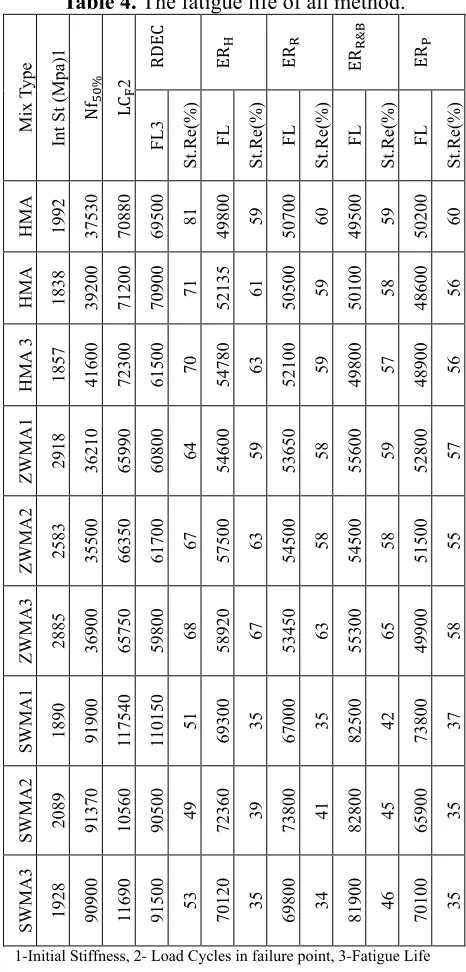
The fatigue life of prepared specimens based on Nf50% criterion is shown in Table 4. These results show that fatigue life of SWMA is longer than those of ZWMA and HMA and ZWMA has the shortest fatigue life; however, its difference with HMA is less than 10%. This observation is in agreement with the decreasing trend of dissipated energy. In this regard, ZWMA and HMA demonstrate a similar behavior, which is also observed for bending stiffness. Based on Figures 3 and 4, all plotted curves are different and indicate dependency to this method to mix type. Other researchers also reported similar results [38].
Fig. 3. Dissipated Energy (DE) versus loading
cycle at strain value of 1000 for ZWMA, SWMA and HMA Specimens.
Fig. 4. Bending stiffness versus loading cycle at
strain value of 1000 for ZWMA, SWMA and HMA Specimens.
was higher than 50% but it is below 50% for SWMA sample.
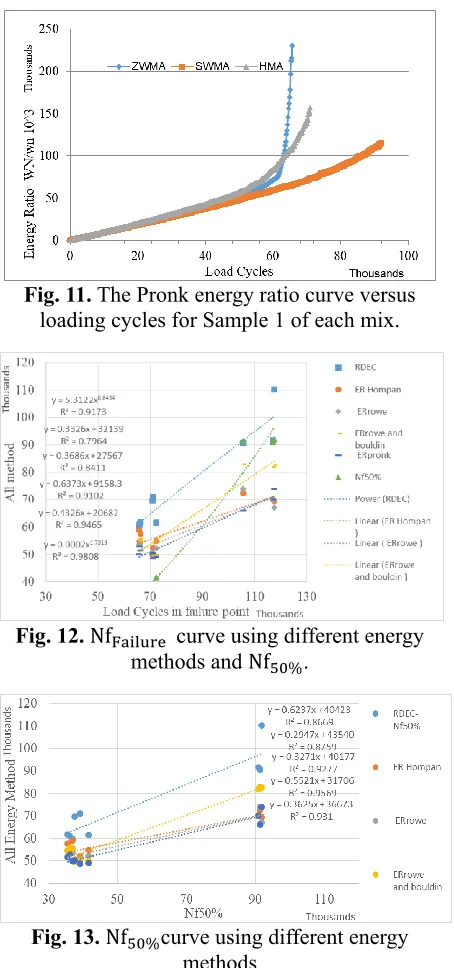
Figures 12 and 13 illustrate the relation between fatigue life based on failure point and Nf50% using various energy criteria. Among these methods, RDEC shows the maximum fitting with failure point, followed by ERR&B in the second place. In addition, comparing the energy-based methods with Nf50% method, ERR, ERR&B, and ERP indicates the maximum consistency with Nf50% method but present a longer fatigue life. Among these five analyses, ERH, ERR, and ERP indicate a similar consistency and result; unlike the two remaining analyses. Although it may seem that this 5 to 15% difference in stiffness value induced by the scattered data of fatigue tests and a wide range of coefficients used for converting laboratory to field results is negligible and Nf50% is a better criterion, having a look on the applied assumptions in definition of failure criteria reveals that this criterion is not suitable when applied on the basis of energy methods. The fatigue life equivalent to Nf50% is defined as the failure criterion of asphalt specimens; meaning that the loaded specimen cannot bear higher loads at this point. This definition is theoretically fitting with the definition of actual failure point. Conversely, ERH, ERR, ERR&B, and ERP are based on the assumption that the loading cycles corresponding to the point at which curve slope changes is the initiation point of cracking in asphalt specimens. Taking these assumptions into account, the fatigue life using these methods must be less than that obtained based on 50% reduction in initial stiffness while it is almost equal at the real failure point and Nf50%; however, the fatigue life obtained based on these two criteria are significantly different.
Accordingly, it can be stated that in HMA and ZWMA samples, the obtained fatigue life can give an appropriate warning before paving failure, unlike SWMA sample that is highly probable to be failed before its due prediction. This issue is of high significance in maintenance management of paving.
Table 4. The fatigue life of all method.
ER P ER R&B ER R ER H RDEC LC F 2 Nf 50% Int St ( Mpa) 1 Mix Type St.Re (%) FL St.Re (%) FL St.Re (%) FL St.Re (%) FL St.Re (%) FL 3 60 50200 59 49500 60 50700 59 49800 81 69500 70880 37530 1992 HMA 1 56 48600 58 50100 59 50500 61 52135 71 70900 71200 39200 1838 HM A 2 56 48900 57 49800 59 52100 63 54780 70 61500 72300 41600 1857 HM A 3 57 52800 59 55600 58 53650 59 54600 64 60800 65990 36210 2918 ZW MA 1 55 51500 58 54500 58 54500 63 57500 67 61700 66350 35500 2583 ZW MA 2 58 49900 65 55300 63 53450 67 58920 68 59800 65750 36900 2885 ZW MA 3 37 73800 42 82500 35 67000 35 69300 51 110150 117540 91900 1890 SWMA 1 35 65900 45 82800 41 73800 39 72360 49 90500 10560 91370 2089 SWMA 2 35 70100 46 81900 34 69800 35 70120 53 91500 11690 90900 1928 SWMA 3
1-Initial Stiffness, 2- Load Cycles in failure point, 3-Fatigue Life
life on the basis of energy criterion. Also, contrary to the results reported by other researchers, no considerable agreement was found between this criterion and the energy-based ones. Thus, it is recommended conducting a test for each mix until the failure point and then select the suitable criterion on its basis. The results show that Nf50% is an efficient criterion for SWMA but is presents underestimated values for HMA and ZWMA.
Moreover, it was found that for SWMA mix the actual failure point and Nf50% are close together; which is in agreement with the results of RDEC analytical method. In this connection, Daniel et al. (2004) also showed that the fatigue life determined using RDEC criterion is longer than that obtained using Nf50% or the one estimated using the viscoelastic theory [39].
Fig. 5. RDEC-loading cycle curve at strain value
of 1000 for HMA.
Fig. 6. RDEC-loading cycle curve at strain value
of 1000 for ZWMA.
Fig. 7. RDEC-loading cycle curve at strain value
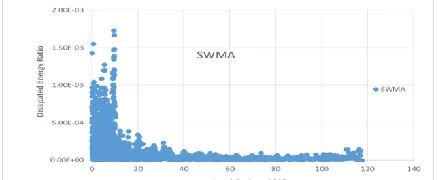
of 1000 for SWMA.
Fig. 8. The Rowe energy ratio curve versus
loading cycles for Sample 1 of each mix.
Fig. 9. The Hopman energy ratio curve versus
loading cycles for Sample 1 of each mix.
Fig. 10. The Row & Bouldin energy ratio curve
Fig. 11. The Pronk energy ratio curve versus loading cycles for Sample 1 of each mix.
Fig. 12. NfFailure curve using different energy
methods and Nf50%.
Fig. 13. Nf50%curve using different energy
methods
A comparison of the fatigue life determination methods using the data shown in Tables 4 and 5 reveals that Nf50% and RDEC methods estimate the longest fatigue life for SWMA, HMA, and ZWMA by order of their appearance. In this two methods, HMA is replaced with ZWMA, which implies the longer fatigue life of ZWMA compared to that of HMA. Among the studied energy-based methods, the estimated
maximum fatigue life depends on the applied regression method, as for HMA method the maximum fatigue life was presented using the approaches proposed by Hopman, Rowe, Row and Boulding, and Pronk, by the order of their appearance. This order changes, however, for the other two mixes according to Table 5. Therefore, it can be claimed that the mix type and the applied method affect the fatigue life significantly. However, all tests indicate the highest efficiency of RDEC. Comparing the ratio of fatigue lives of various mixes (Table 6) indicate the difference of this ratio in analytical methods. The ratio of fatigue life calculated using HMA and ZWMA methods varies between 0.9 and 1.11, indicating the similar fatigue behavior of these mixes with HMA, despite the reduced 25℃ in production and compact temperature. This ratio between SWMA mix and ZWMA and HMA mixes varies in the range of 1.24-1.72 and 1.35-1.65, respectively; indicating the positive effect of Sasobit on fatigue life of the corresponding mix. Several past studies indicated the better fatigue performance of Sasobit-modified asphalt mixtures compared to control mixtures [10, 12].
Table 5. Prioritize based on the maximum
estimated fatigue life.
Mix
type RDEC ERH ERR ERR&B ERP
HMA
priority 1 2 3 4 5 Ave.
St.Re(%) 76.2 60.9 59.4 58.1 57.2
ZW
MA
priority 1 2 4 3 5 Ave.
St.Re(%) 66.2 62.8 59.5 60.7 56.5
SWMA
priority 1 3 4 2 5 Ave.
Table 6. Fatigue life ratio of various mixes.
Fatigue life ratio
Nf50% Frac
ture
Cycl
e
RDEC ER
H
ER
R
ER
R
&
B
ER
P
Nf (HMA/ZWMA)
1.
09
1.
08
1.
11
0.
92
0.
95
0.
90
0.
96
Nf (SWMA/ZWMA)
2.
52
1.
72 1.6
1.
24 1.3
1.
49
1.
36
Nf (SWMA/HMA)
2.
32
1.
59
1.
45
1.
35
1.
37
1.
65
1.
42
6. Conclusion
Since strain is constant in strain-controlled fatigue tests, the definition of failure criterion is a difficult issue. Although 50% reduction in initial stiffness is a criterion with widespread usage, different studies have been undertaking to provide a better criterion. In the present research, fatigue lives obtained using the energy-based methods and Nf50% were compared. The analysis of results obtained from laboratory four-point bending test reveal that the results are dependent on test conditions and different yield points are obtained using the analytical methods. Fatigue life obtained using RDEC is longer than those estimated using other methods. The consistency between fatigue life with the reduced stiffness shows that the decrease in stiffness using Nf50% criterion is higher for HMA and ZWMA mixes while it is lower for SWMA. These results also show that Nf50% criterion is not a suitable in the energy viewpoint and is not highly correlated with energy-based methods; unlike the results reported elsewhere. Thus, it is recommended performing the tests for each mix until its failure step and then selecting the proper criterion. In the meanwhile, Nf50% was found to be a suitable criterion for SWMA but inappropriate for HMA and ZWMA as it
yields underestimated values. Based on the obtained results, it is clear that the actual failure points in SWMA are similar to the one estimated using Nf50% criterion. This behavior is also the same for the analytical RDEC method. While there is a significant different between the actual failure points obtained for HMA and ZWMA and the one estimated by Nf50%, this difference is very low in RDEC analysis. Among all energy-based methods, RDEC method presents the maximum fatigue life and the point closest to the actual failure point. Thus, this method is the optimum among the energy-based methods for fatigue life estimation of asphalt mixes.
For HMA and ZWMA specimens, the loading cycle number at the failure point is almost 80% greater than that of Nf50% while it is reduced to 28% for SWMA mix. This behavior implies the very high safety factor of Nf50% in fatigue life estimation for ZWMA and HMA mixes and the low safety factor for SWMA.
7. Acknowledgments
The authors would like to express their thanks to respectful official of Tehran Technical and Soil Mechanics Company. This research paper is result of PhD thesis of Mr. Seyedrohalah Moafimadani
REFERENCES
[1] Prowell G C, Hurley B D. (2005). “Evaluation of Aspha-Min zeolite for use in warm mix asphalt” [R]. s.l. : Report 05– 04. Auburn: National Center for Asphalt Technology.
Presented to the Graduate School of Clemson University, Doctor of Philosophy Civil Engineering.
[3] Hesami , S., Roshani, H., Hamedi, G, H., Azarhoosh , A. (2013). “Evaluate the mechanism of the effect of hydrated lime on moisture damage of warm mix asphalt”. Construction and Building Materials , pp. 47-935–941.
[4] Şengöz, B., Topal, A., & Gorkem, C. (2013). Evaluation of moisture characteristics of warm mix asphalt involving natural zeolite., Road Materials and Pavement Design, pp. 14:4, 933-945.
[5] Zelelew, H., Paugh, C., . Corrigan, M., Belagutti, S., Ramakrishnareddy, J. (2013). “Laboratory evaluation of the mechanical properties of plant-produced warm-mix asphalt mixtures Road Materials and Pavement Design”, pp. 14:1, 49-70. [6] Yin, F., Arámbula-Mercado, E., Martin, A,
E., Newcomb, D & Nam. (2017) . “Long-term ageing of asphalt mixtures”, Road Materials and Pavement Design,, pp. 2-27. [7] Su, K., Maekawa, R., Hachiya, Y. (2009).
Laboratory evaluation of WMA mixture for use in airport pavement rehabilitation, Constr Build Mater, pp. 23(7):2709–14. [8] Goh SW, You Z. (2011), “Evaluation of
warm mix asphalt produced at various temperatures through dynamic modulus testing and four point beam fatigue testing”. In:Proceedings of the GeoHunan international conferencepavements and materials: recent advances in desig , testing, and construction. Hunan, China: eotechnical Special Publication, pp. 123– 30 .
[9] Ziari,H., Behbahani, H., Izadi, A., Nasr, D. (2013). “Long term performance of warm mix asphalt versus hot mix asphalt”., J. Cent. South Univ, p. 20: 256−266.
[10] Khalid A. Ghuzlan, Obadah S. Ar'ar. (2016). “Performance of warm asphalt mixtures using Sasobit”. Petroleum Science and Technology, pp. 34, 1263-1271.
[11] Modarres, A., Aloogar, Ashkan., (2015). “Comparison between the fatigue response of hot and warm mix asphalts based on the dissipated energy approach”. International Journal of Pavement Engineering.
[12] Petit C., Millien, A., Canestrari, F., Pannunzio, V., Virgili, A. (2012). “Experimental study on shear fatigue behavior and stiffness performance of Warm Mix Asphalt by adding synthetic wax”. Construction and Building Materials, pp. 34- 537–544.
[13] Cardone, F., Pannunzio, V., Virgili, A,. Barbati, S. (2009). “An evaluation of use of synthetic waxes in warm mix asphalt”. In: 7th International RILEM symposium on advanced testing and characterization of bituminous materials, Rhodes.
[14] Bocci M, Grilli A, Pannunzio V, Riviera PP. (2009). Mechanical characterization and influence of water on WMA by adding synthetic zeolite., Int J Pavement Eng Asphalt Technol (PEAT).
[15] Safaei, F., Lee, J., ., Hermann, L., Nascimento, A., Hintz, C., and Richard, Y. (2014). “Implications of warm-mix asphalt on long-term oxidative ageing and fatigue performance of asphalt binders and mixtures” . Road Materials and Pavement Design, pp. 45-61.
[16] Khodadadi, A. (1993). “The Effect of Compaction Method on The Fatigue Life and Elasto-Plastic Properties of Asphalt Pavement”. Department of Civil and Environmental Engineering, Charleston University.
[17] Xue Luo,. Rong Luo.(2013). “Energy-Based Mechanistic Approach to Characterize Crack Growth of Asphalt Mixtures”. Ph.D., P.E., M.ASCE2 and and Robert L. Lytton, Ph.D., P.E., F.ASCE. 2013, MATERIALS IN CIVIL ENGINEERING, pp. 1198-1208.
rutting performance of asphalt pavements. Materials and Structures, pp. DOI 10.1617/s11527-015-0744-x.
[19] Huang, Y.H. (1993). “Pavement Analysis and Design” . Prentice Hall Inc.
[20] Monismith, C.L., Deacon, J.A. (1969). “Fatigue of Asphalt Paving Mixtures”. ASCE Transportation Engineering Journal, pp. Vol. 95:2, pp 317-346.
[21] Pronk A.C., Hopman P.C. (1990). “Energy Dissipation :The Leading Factor of Fatigue” . Highway Research : Sharing the Benefits. Proceedings of the Conference, the United States Strategic Highway Research Program , London, .
[22] Tayebali A.A, Row G.M., and Sousa J.B. (1975). Fatigue Response of Asphalt Aggregate Mixture., Journal of The Association of Paving Technologists, pp. Vol.44 pp.1-37.
[23] Shen, S., Airey, G.D., Carpenter, S.H., Huang, H.A. (2006), Dissipated energy approach to fatigue evaluation. International Journal of Road Materials and Pavement Design, pp. 7 (1), 85–92. [24] Shen, S., Carpenter, S.H. (2007).
“Dissipated energy concepts for HMA performance: fatigue and healing”. Technical report of research supported by the Federal Aviation Association Urbana, IL: University of Illinois at Urbana-Champaign.
[25] SHRP, A-40. Fatigue Response of Asphalt – Aggregate Mixes. s.l. : Strategic Highway Research Program. (1994). National Research Council.
[26] Hopman P,C., Kunst, P,A,J,C., Pronk, A,C. (1989). “A Renewed Interpretaton Method for Fatigue Measurments”. Verification of Miner's Rule",4th Eorobitume Symposium in Madrid, pp. Volume 1, pp.557-561. [27] Rowe, G.M. (1993). “Performance of
Asphalt Mixtures in the Trapezoidal Fatigue Test R”. Journal of the Association
of Asphalt Paving Technologists, pp. Vol.62 pp.344-384.
[28] Al-Khateeb G., Shenoy A. (2004). “A Distinctive Fatigue Failure Criterion”. Journal of the Association of Asphalt Paving Technologists, pp. Vol.46 pp.585-621.
[29] Comparison of 2 and 4 Point Fatigue Tests and Healing in 4 Point Dynamic Bending Test Based on The Dissipated Energy Concept. Pronk, A.C. (1997), Proceeding of The Eight International Conference on Asphalt Pavement, pp. PP. 987-994. [30] Rowe, G. M., and Bouldin, M. G. (2000).
“Improved techniques to evaluate the fatigue resistance of asphaltic mixes”. Barcelona, Spain : Proc., 2nd Euraphalt and Eurobitume Congress.
[31] Ghuzlan, K, A., Carpenter, S. H. (2000). “Energy-derived, damage based failure criterion for fatigue testing”. Transportation Research Record. 1723, Transportation Research Board, Washington, D.C., pp. 141–149.
[32] Shihui Shen., Samuel, H., Carpenter. (2007). “Dissipated energy concepts for HMA performance:Fatigue and healing”. University of illinois at urbana-champaign. [33] Carpenter, S. H., Shen, S. (2006). “A dissipated energy approach to study HMA healing in fatigue”. Proc., 85th Annual Transportation Research Board Meeting, Transportation Research Board of the National Academies, Washington, D.C. [34] Edwards, Y., Isacsson, U. (2005). “Wax in
bitumen. Part I—Classifications and general aspects., Road Materials and Pavement Design” , pp. 6:281–309.
[35] Moafimadani, S, R., Rahimov, K., Hesami, S. (2016). “The effect of warm additive on the properties and behavior of an asphalt binder”. Petroleum Science and Technology, pp. 34:19, 1654-1662.
of thermoviscoelastic materials: application to asphalt materials in pavement surface layers”. International Journal of Fatigue, pp. 47, 308–318. [37] Abojaradeh, M. (2003). “Predictive fatigue
models for Arizona asphalt concrete mixtures”. s.l. : Thesis (PhD). Arizona State University, USA.
[38] Khiavi, A., Ameri, M. (2014). “Investigating the fatigue endurance limit of HMA mixture using RDEC Approach”. Construction and Building Materials, pp. 55, 97–102.