T E C H N I C A L A D V A N C E
Open Access
A network clustering based feature
selection strategy for classifying autism
spectrum disorder
Lingkai Tang
1, Sakib Mostafa
2, Bo Liao
3and Fang-Xiang Wu
1,2*From14th International Symposium on Bioinformatics Research and Applications (ISBRA’18) Beijing, China. 8-11 June 2018
Abstract
Background: Advanced non-invasive neuroimaging techniques offer new approaches to study functions and structures of human brains. Whole-brain functional networks obtained from resting state functional magnetic resonance imaging has been widely used to study brain diseases like autism spectrum disorder (ASD). Auto-classification of ASD has become an important issue. Existing Auto-classification methods for ASD are based on features extracted from the whole-brain functional networks, which may be not discriminant enough for good performance. Methods: In this study, we propose a network clustering based feature selection strategy for classifying ASD. In our proposed method, we first apply symmetric non-negative matrix factorization to divide brain networks into four modules. Then we extract features from one of four modules called default mode network (DMN) and use them to train several classifiers for ASD classification.
Results: The computational experiments show that our proposed method achieves better performances than those trained with features extracted from the whole brain network.
Conclusion: It is a good strategy to train the classifiers for ASD based on features from the default mode subnetwork.
Keywords: Autism spectrum disorder, Brain networks, Non-negative matrix factorization, Network clustering, Feature selection, Classification
Background
Autism spectrum disorder (ASD) is a neurodevelop-mental disorder characterized by repetitive social behav-ior, restricted interests and mental inflexibility [1]. It is estimated that 1% of global population are suffer-ing from ASD [2]. Clinical diagnosis of ASD relies heavily on interview- or observation-based instruments [3,4] which include interactions with clinical profession-als. Thus diagnosing results could be biased by misinter-preted communication or subjective opinions of clinicians
*Correspondence:[email protected]
1Department of Mechanical Engineering, University of Saskatchewan, S7N 5A9
Saskatoon, Canada
2Division of Biomedical Engineering, University of Saskatchewan, S7N 5A9
Saskatoon, Canada
Full list of author information is available at the end of the article
[5]. Also, diagnostic stability of such methods could be relatively low when concerning very young children [6]. Functional magnetic resonance imaging (fMRI) provides an additional approach to study brain diseases. Measur-ing blood oxygen level-dependent (BOLD) signals, fMRI is a non-invasive scanning technique showing fluctua-tions of functional activities of a whole brain. As the center of nervous system, a human brain can be consid-ered as a complex system where different regions have different functions and regions cooperate with each other to perform certain cognitive functions. Correlation of BOLD signals among brain regions indicate underlying functional interactions.Biswal et al. [7] demonstrates that even though brain is at the resting state, regions that frequently interact with each other at the normal state can still have strong correlations. Thus, the resting-state
fMRI (rs-fMRI) can provide an intrinsic functional map-ping and has been widely used in studying the functional organization of brains.
Considering the massive functional correlations between brain regions, we can naturally view a brain as a network, where regions are vertices and functional cor-relations are edges [8]. Previous studies have shown that functional brain networks (FBN) have certain small-world properties, such as high clustering coefficient or short characteristic path length [9]. Vertices in such networks are prone to form modules. This agrees with our under-standing that brains are modular systems where different brain parts have separated functions. Implementations of network clustering methods have successfully identified modules in different contexts. Power et al. [10] identify modules using rs-fMRI images and mapped modules to cognitive function. Crossley et al. [11] use task-evoked fMRI images and link their identified modules to 4 types of behaviours. In addition, alterations in modules with aging or cognitive status are also studied [12]. These studies successfully map the functional organization of brain to FBNs.
Previous researches have revealed associations between alterations in rs-fMRI images or derived FBNs and pathol-ogy of ASD. A majority of studies have discovered that children with ASD have increased total brain volumes [13]. A decrease of global network efficiency is also reported via studying FBNs [14]. Recent researches have also successfully implemented machine learning algo-rithms in analyzing FBNs of ASD subjects, perform-ing automated classification and offerperform-ing complementary methods for clinical diagnosis. Several classifiers and forms of features have been implemented to diagnose ASD. Plitt et al. [15] use functional correlations as features to train different classifiers such as linear support vec-tor machine (SVM), random forest (RF), linear discrimi-nant analysis (LDA), Lasso-regularized logistic regression (LRLR) and k nearest neighbors (kNN). In particular, classifiers are trained with correlation values in FBNs. Chen et al. [16] use two feature selection strategies named particle swarm optimization (PSO) and recursive fea-ture elimination (RFE), combined with SVM classifier and obtains accuracies about 80% and 100%, respectively, on training data but much less on testing data. PSO iteratively optimizes the positions of particles according to certain cost function measuring the quality [17]. For feature selec-tion purpose, the posiselec-tion of a particle is represented by a binary vector whose components indicate whether a feature participates the training process. The cost func-tion usually measures the performance of the classifier [18]. RFE ranks all the features and recursively eliminate bottom-ranked ones [19]. Price et al. [20] use dynamic functional correlations obtained from multiple networks from large time scales and Tolan et al. [21] add
centrality-based indices to the collection of features. Developments in deep learning also inspire new methods for ASD diag-nosis. Guo et al. [22] use deep neural networks in feature selection and classification, achieving accuracy over 80%. Autoencoders, as another form of artificial neural net-work, is implemented for the identification of ASD [23] with accuracy about 70%.
Aforementioned studies about classification extract fea-tures from the whole brain network. Therefore, the dimension of feature vectors could be relatively large and thus not very discriminant. In addition, high dimensional feature vectors could cause overfitting issue and increase computational complexity. In this study, we introduce a new strategy to extract the features for classifiers from a network module. In particular we present the joint sym-metrical non-negative matrix factorization (JSNMF) to cluster FBNs into several modules. Non-negative matrix factorization (NMF) is an unsupervised machine learning method. NMF has been widely used in identifying com-munities in complex networks such as social networks [24] or biomolecular networks [25]. Ordinary NMF meth-ods factorize one matrix a time, but real-world datasets may contain multiple views, or attributes which comple-ment each other. Liu et al. [26] introduces a multi-view clustering algorithm by formulating a joint cost function meanwhile keeping clustering results meaningful. Ou [27] and Zong [28] add regularization terms in cost func-tions to preserve local geometrical structures. Such joint NMF methods are also successfully implemented on bio-logical datasets. Zhang et al. [29, 30] propose methods for clustering ovarian cancer samples with several types of data including gene expression data, microRNA data, etc. Breast cancer samples are also studied with simi-lar types of data [31]. For network clustering propose, Zhang et al. [32] identify communities from social net-works at different time points. For brain netnet-works, we can also regard each individual FBN as a view since it repre-sents a different organization of connectivity that human brain may have. Although individual FBNs vary at local connections, all subjects may have similar modular struc-ture, considering that cortical regions of different subjects are similar if they share one cognitive function. Our pro-posed JSNMF method solves a regular symmetrical NMF cost function but in a joint form to obtain a consen-sus that contains lower dimensional features valid for all individual FBNs.
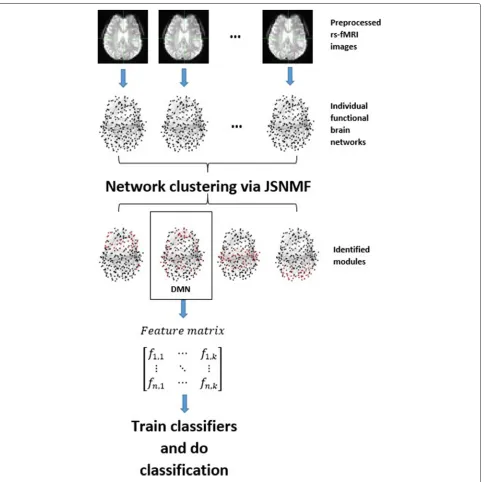
Fig. 1A flowchart showing the whole pipeline, including building FBNs, module identification, feature extraction and classification
Methods Dataset
Acquisition and preprocessing of rs-fMRI data
All rs-fMRI data were acquired at UCLA on a Siemens 3 T Trio scanner. Configuration of the scanning can be found in [33] and image data can be obtained from ABIDE dataset [34]. The rs-fMRI images are preprocessed with FMRIB Software Library (FSL) [35] and Analysis of Functional NeuroImages (AFNI) [36], by following a pipeline introduced in [33]. Brain-only images are extracted from surrounding skulls and tissues with AFNI.
are segmented with FSL FAST [38].Images are applied a Gaussian kernel with full width at half maximum of 5 mm for spatial smoothing and filtered with a band-pass filter of Hz to reduce influence of heart beat and breath. Images of all subjects are registered to MNI 152 standard space using FSL FLIRT with affine transformation and mutual information cost function.
Constructing FBNS
A recent study introduced a whole-brain parcellation based on meta-analysis of fMRI, yielding 264 ROIs in MNI 152 standard space. Compared with traditional anatomi-cal atlases, this parcellation avoids large ROIs containing several different functional regions, so that BOLD sig-nals representing different functions will not be mixed. Then we calculated the Pearson correlation coefficients of average signals between every pari of ROIs to obtain a 264×264 adjacency matrix for each subject.
JSNMF
Given a multiview datasetA=A(1). . . A(n), whereA(v)
in our case is a 264×264 FBN adjacencey matrix of a sub-ject andn = 37. JSNMF solves an optimization problem by minimizing the following objective function
OJSNMF = n
v=1
A(v)−HS(v)HT2
F+4α K
k=1
hk
1
s.t. H≥0 and S(v)≥0 for v=1,. . .,n (1)
where∗
Frepresents the Frobenius norm of a matrix,
hk is thek-th column of matrixH ∈ RN×K whereK is the number of modules desired, and∗
1represents the L1−normof a vector to make it sparse,α is a positive regularization factor.
To minimizeOJSNMF, we can introduce Lagrangian mul-tiplier∈RN×K and rewrite equation 1 as
OL= n
v=1
A(v)−HS(v)HT2
F+4α K
k=1
hk
1+Tr(H T),
(2)
whereTR(∗)is the trace of a matrix. The partial deriva-tives of equation 2 with respect ofS(v)andHare respec-tively as follows
∂OL
∂S(v) = −2H
TA(v)H+2HTHS(v)HTH (3)
∂OL ∂H =
n
v=1
−4A(v)HS(v)+4HS(v)HTHS(v)
++4αE, (4)
whereE=1N×K. Solving ∂OL
∂S(v) =0, we get
S(v)=(HTH)−1HTA(v)H(HTH)−1. (5)
According to the Karush-Kuhn-Tucker (KKT) conditions [39], we obtain
H
n
v=1
−4A(v)HS(v)+4HS(v)HTHS(v)
+αE
=0,
(6)
whererepresents Hadamard production. Therefore, we can obtian the following update rules
H←H
n
v=1
(A(v)HS(v))
n
v=1
(HS(v)HTHS(v))
+αE
, (7)
where represents element-wise division of matrices. The non-negative matrixH and S(v) is randomly ini-tialized and updated by following equations 6 and 8 until converged. Guarantee of convergence can be easily proved as in the literature [40–42].
The matrixH is the cluster indicator and it is normal-ized so that the maximum value of each column equals to 1 to balance the sizes of modules. A vertex is assigned to a module where the element value of its corresponding row reaches the maximum, i.e., vertexibelongs to modulekif theHi,kis the largest one ini-th row of normalizedH.
Evaluation indices of clustering performance
We use three indices to measure the quality of modules: modularity, conductance and coverage. Let Abe a FBN adjacency matrix and(M1,. . .,MK)represent theK mod-ules identified. Let Vk = i∈Mk
N
j=1Ai,j and Wk =
i∈Mk,j∈MkAi,jfork=1,. . .,K.
Modularity measures the quality of modules of higher intra-community connections than the expected random connections of the vertices with probabilities proportional to their degrees and is calculated as follows [43]:
Mod(M1,. . .,MK)= K
k=1
(Wk−Vk2). (8)
The higher modularity is, the better the clustering method is.
Conductance measures the possibility of a one-step ran-dom walk entering or leaving a module [43] and it is defined as
Con(M1,. . .,MK)= 1
K
K
k=1 Wk
Vk
. (9)
Coverage measures the fraction of intra-module con-nections over all concon-nections [43] and is calculated as
Cov(M1,. . .,MK)= K
k=1
Wk. (10)
The denser a module is, the higher the coverage value is.
Measuring performances of classifiers
In this study, we measure the performances of classifiers by drawing ROC curves and calculating AUCs. The ROC curves are plotted with the true positive rate (TPR) against the false positive rate (FPR) over a series of classification thresholds. TPR, also called sensitivity, measures the pro-portion of positive samples that are correctly predicted over all actual positive samples, while FPR measures the proportion of samples wrongly predicted as positive over all actual negative ones. Thus, TPR and FPR can be respec-tively defined as
TPR= TP
P (11)
FPR= FP
N, (12)
where TP and FP are the numbers of samples correctly or wrongly predicted as positive, respectively, and P and N are numbers of actual positive or negative samples, respectively. In medical diagnosis, TPR is the ability of a test to correctly identify diseased samples, while FPR mea-sures the rate of healthy samples misdiagnosed with the disease.
To draw the ROC curves, we need to set up a series of classification thresholds. In classification, the thresholds are designed for the output value of a classifier to deter-mine which class a sample belongs to. ROC curves depicts the performance of classifiers under different thresholds and help choose the threshold yielding best performance. The ROC curve of a perfect classifier should reach point (0, 1)in ROC space, representing 100% TPR and 0% FPR.
AUC is the area under the ROC curve and measures the general performance of a classifier. If the AUC is large, it means the ROC curve is close to point(0, 1), or at least it partially has high TPR or low FPR. AUC is defined as
AUC=
1
0
TPR dFPR. (13)
In practice, AUC is approximated by the trapezoidal numerical integration.
Results and discussions Clustering of FBNS
We first implement our network clustering algorithm, JSNMF, and run it on a dataset collected from UCLA Multimodal Connectivity Database [44]. This dataset con-tains 42 individual functional networks of subjects from
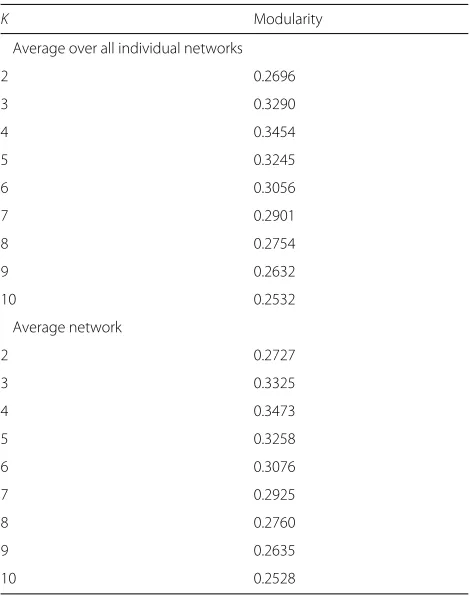
Table 1Performance of JSNMF with different settings ofKwhen αfixed to 1
K Modularity
Average over all individual networks
2 0.2696
3 0.3290
4 0.3454
5 0.3245
6 0.3056
7 0.2901
8 0.2754
9 0.2632
10 0.2532
Average network
2 0.2727
3 0.3325
4 0.3473
5 0.3258
6 0.3076
7 0.2925
8 0.2760
9 0.2635
10 0.2528
ASD group and 37 individual functional networks from typically developed (TD) group. Each of these functional networks is a weighted network consisting of 264 nodes (regions of interest, ROIs) and the edges are weighted by the Pearson correlation coefficient of the time series BOLD of two ROIs. AS in the literature [33], all nega-tive weights are firstly removed. To filter out the edges
Table 2Performance of JSNMF with different settings ofαwhen
Kfixed to 4
α Modularity Conductance Coverage
Average over all individual networks
0 0.3449 0.5905 0.6101
0.1 0.3451 0.5905 0.6105
1 0.3454 0.5909 0.6105
10 0.3453 0.5908 0.6103
100 0.3452 0.5909 0.6101
Average network
0 0.3470 0.5930 0.6084
0.1 0.3473 0.5929 0.6084
1 0.3475 0.5933 0.6088
10 0.3474 0.5933 0.6086
with small weights which are possibly generated by noise [9] while keeping all individual networks connected, the edges with their weights less than a threshold of 0.35 are further removed. Note that the adjacency matrices of resultant networks are symmetric and nonnegative. At this stage, for clustering purpose, we only use TD networks to guarantee the quality of the identified mod-ules, since ASD could alter the modular organization of brains [45].
We run the JSNMF algorithm in MATLAB R2013a with different settings of parameters:K, the number of mod-ules and α, the regularization factor. The performance of the algorithm is measured by modularity, conductance and coverage [43] and these 3 indices are calculated on an average network and each individual network. The per-formance of our method JSNMF are shown in Tables 1 and 2, where we fix one parameter and change the other one. For both tables, top half are the average val-ues of three indices over 37 individual networks, while the bottom half are the values of those three indices on the average network. We calculate the indices on indi-vidual networks because we believe the clustering results should be valid for all subjects, even though their FBNs are not quite similar. As shown in Table 1, modular-ity reaches the maximum when K = 4 and α fixed to 1 while Table2 shows that all three indices is maxi-mized whenα = 1. Therefore, we set the parameters as
K=4 andα=1.
To demonstrate our method has better performance, we compare it with two other methods: multiclass spec-tral clustering (MSC) [46] and co-regularized multi-view spectral clustering (CMSC) [47]. We consider them as competing methods because all three methods are based on matrix factorization and dimension reduction. The two
Table 3Comparison of performances of different methods
Methods Modularity Conductance Coverage
Average over all individual networks
MSC 0.3441 0.5937 0.6040
CMSC 0.3451 0.5920 0.6119
JSNMF 0.3454 0.5909 0.6105
Average network
MSC 0.3454 0.5953 0.6016
CMSC 0.3469 0.5939 0.6099
JSNMF 0.3475 0.5933 0.6088
competing methods are also implemented in MATLAB R2013a and different parameter settings are tested to find their best performance. Table3collects the results of all three methods. From Table3, we can see that our method perform the best in terms of modularity while ranking at the second or the third in terms of coverage or conduc-tance. However, it is believed that the modularity is the most powerful index to measure the quality of the network clustering [48].
Since our algorithm is randomly initialized, the resul-tant modules may be different in each run. Using the adjusted rand index (ARI) [49], we calculate similari-ties between modules of any two runs. We find that the lowest ARI value among all pairs is 0.91 which is pretty high, indicating high similarities among runs and the robustness of our algorithm. Therefore, we choose the result from one run that is most sim-ilar to results of all other runs for the following stages.
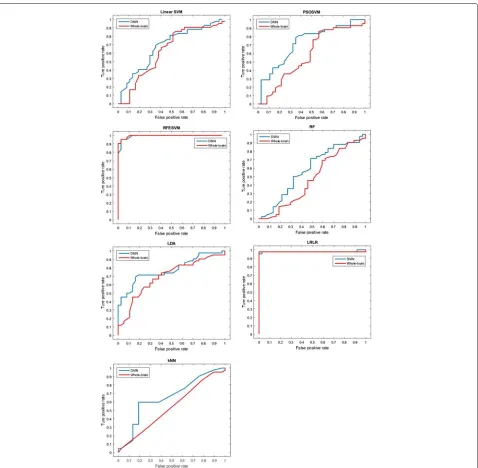
Fig. 3The ROC curves of classifiers trained with DMN features and whole-brain features. For SVM based classifiers, the classifying thresholds range from the smallest values the test data can reach, to the largest ones. And for other classifiers, the thresholds range from 0 to 1
Classification of ASD with default mode network features
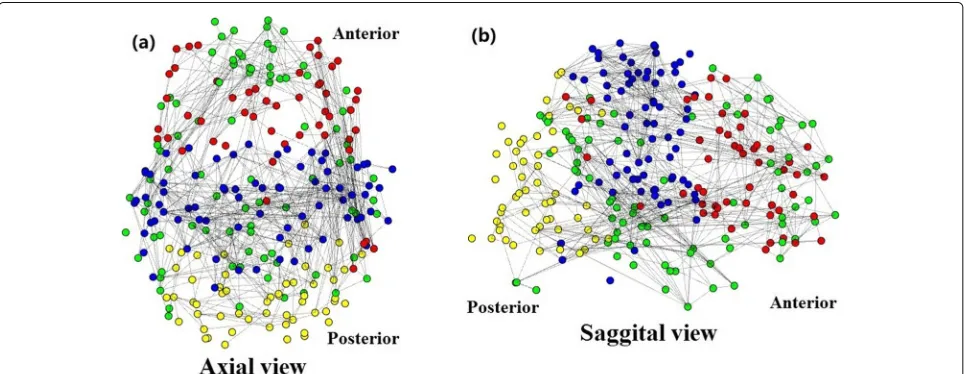
Default mode network (DMN) which is a brain mod-ule identified in several researches based on fMRI images or FBNs [50] and considered to be responsi-ble for many cognitive functions [51]. Figure 2 shows the 4 different color-coded modules identified with our
JSNMF. The green module is corresponding to the DMN, which mainly expands in middle and inferior tempo-ral gyrus, cigulate gyrus, hippocampal gyrus, frontal gyrus and their surrounding regions and contains sev-eral previously identified core regions of DMN including Medial prefrontal cortex, posterior cingulate cortex and
Table 4AUCs of classifiers trained with DMN and whole-brain features
Classifier Linear SVM PSOSVM RFESVM RF LDA LRLR kNN
DNM features 0.6264 0.7215 0.9640 0.5769 0.7754 0.9775 0.6541
hippocampal formation [50]. In addition, studies [45] have reported the participation of temporal lobule in DMN for certain functions. Medial prefrontal cortex shows increas-ing volumes in ASD subjects [52, 53]. Average FBN and integration of DMN are also reported to decrease with severity of ASD [54–56]. Therefore, we extract features from this green module in this study.
Specifically, the Pearson correlation coefficients are extracted from all pairs of ROIs in DMN and whole-brain networks for each of all ASD and TD subjects, respec-tively and are arranged as their feature vectors to train several classifiers. We compare the performances of clas-sifiers trained with features from DMN and whole-brain networks. The classifiers include linear SVM, particle swarm optimization SVM (PSOSVM) [18], recursive fea-ture elimination SVM (RFESVM) [19], RF, LDA, LRLR and kNN. We choose these classifiers because they were previously trained with the features defined by Pearson correlation coefficients from the whole-brain network[15, 16]. In addition, in those studies the networks are built following a similar pipeline as in this study. All classifiers are implemented in MATLAB Machine Learning Tool-box and Scikit-learn in Python and are evaluated with the leave-one-out cross validation.
We draw the receiver operating characteristic (ROC) curves and calculate the area under curves (AUC) to mea-sure the performance of each classifier. Figure 3 shows that for all classifiers, except for RFESVM, DMN fea-tures yield higher AUC than whole-brain feafea-tures. For RFESVM, the performances of two feature sets are basi-cally the same and they are both relatively high. We can also see that DMN features outperform whole-brain fea-tures especially at low false positive rate (FPR). Consider-ing the application in clinical diagnosis, which requires the low misdiagnosis rate, DMN features have more potential for clinical trials. In addition, we can see from Table4that both PSOSVM and RFESVM classifiers with extra feature selection stages have higher AUCs than most of the others, indicating the potential of classification performance can be further improved with the feature selection strategy.
Compared with previously developed classification methods [22, 57, 58], our strategy is easier to imple-ment because modular information is highly accessible. In this study, we develop a new clustering algorithm to find functional modules but it is possible to use other cor-tex parcellation schemes [10, 11,59], including anatom-ical parcellations which has been integrated in many brain image analysis tools. Some previously used feature selection strategies are quite complicated, especially when neural networks are involved [22,57,58,60]. Our strat-egy takes less time and can also achieve high performance. In addition, our strategy can be integrated with other classification methods. Previous methods can be easily implemented on modular features, and since number of
features is smaller, it would take less time to train the classifiers or select more discriminant features with other strategies.
Conclusion
In this study, we have proposed a new strategy to select discriminant features for the classification of ASD. The experiment results show that classifiers trained with fea-tures extracted from a single brain module named DMN generally perform better than those trained with features extracted from a corresponding whole-brain network. In addition, this strategy can greatly reduce the numbers of features, which not only yield less computational com-plexity and shorter training time, but also potentially avoid the overfitting problem.
As indicated with PSOSVM and RFESVM classifiers, further feature selection could improve the performance of classifiers. Therefore, one direction of our future work is to effectively incorporate our proposed strategy in this study with other feature selection method to further improve the performance of classifiers. Beside the func-tional MRIs, there are also other brain imaging modalities such DTI and CT. Another direction of out future work is to integrate multi-modalities of brain imaging to study the classification of ASD.
Abbreviations
AFNI: Analysis of functional neuroimages; ARI: Adjusted rand index; ASD: Autism spectrum disorder; AUC: Area under curve; BOLD: Blood oxygen level-dependent signals; CMSC: Co-regularized multi-view spectral clustering; DMN: Default mode network; FBN: Functional brain networks; fMRI: Functional magnetic resonance imaging; FPR: False positive rate; FSL: FMRIB software library; JSNMF: Joint symmetrical non-negative matrix factorization; KKT: Karush-Kuhn-Tucker; kNN: k nearest neighbors; LDA: Linear discriminant analysis; LRLR: Lasso-regularized logistic regression; MSC: Multiclass spectral clustering; NMF: Non-negative matrix factorization; PSO: Particle swarm optimization; PSOSVM: Particle swarm optimization support vector machine; RF: Random forest; RFE: Recursive feature elimination; RFESVM: Recursive feature elimination support vector machine; ROC: Receiver operating characteristics; ROI: Region of interest; rs-fMRI: Resting state functional magnetic resonance imaging; SVM: Support vector machine; TD: Typically developed; TPR: True positive rate; UCLA: University of California, Los Angeles
Acknowledgements
We thank the reviewers for their helpful suggestions and comments. The part of this work was previously presented in the conference of the 14th International Symposium on Bioinformatics Research and Applications (ISBRA 2018).
About this supplement
This article has been published as part of BMC Medical Genomics, Volume 12 Supplement 7, 2019: Selected articles from the 14th International Symposium on Bioinformatics Research and Applications (ISBRA-18): medical genomics. The full contents of the supplement are available athttps://bmcmedgenomics. biomedcentral.com/articles/supplements/volume-12-supplement-7.
Authors’ contributions
FXW conceived this study. LT implemented the algorithm, and performed the experiments. SM and BL participated in discussion about machine learning algorithm. LT and FXW wrote the manuscript. All authors read and approved the final manuscript.
Funding
Availability of data and materials
The dataset analyzed during the current study are available in UCLA Multimodal Connectivity Database.http://umcd.humanconnectomeproject. org
Ethics approval and consent to participate
Not applicable.
Consent for publication
Not applicable.
Competing interests
The authors declare that they have no competing interests.
Author details
1Department of Mechanical Engineering, University of Saskatchewan, S7N 5A9
Saskatoon, Canada.2Division of Biomedical Engineering, University of
Saskatchewan, S7N 5A9 Saskatoon, Canada.3School of Mathematics and
Statistics, Hainan Normal University, 571158 Haikou, China.
Received: 10 July 2019 Accepted: 9 October 2019 Published: 30 December 2019
References
1. American Psychiatric Association. Diagnostic and statistical manual of mental disorders. BMC Med. 2013;17:133–7.
2. Vos T, Allen C, Arora M, Barber RM, Bhutta ZA, Brown A, Carter A, Casey DC, Charlson FJ, Chen AZ, et al. Global, regional, and national incidence, prevalence, and years lived with disability for 310 diseases and injuries, 1990–2015: a systematic analysis for the global burden of disease study 2015. Lancet. 2016;388(10053):1545–602.
3. Lord C, Rutter M, Le Couteur A. Autism diagnostic interview-revised: a revised version of a diagnostic interview for caregivers of individuals with possible pervasive developmental disorders. J Autism Develop Disorders. 1994;24(5):659–85.
4. Lord C, Rutter ML, Goode S, Heemsbergen J, Jordan H, Mawhood L, Schopler E. Autism diagnostic observation schedule: a standardized observation of communicative and social behavior. J Autism Develop Disorders. 1989;19(2):185–212.
5. Mandell DS, Ittenbach RF, Levy SE, Pinto-Martin JA. Disparities in diagnoses received prior to a diagnosis of autism spectrum disorder. J Autism Develop Disorders. 2007;37(9):1795–802.
6. Kleinman JM, Ventola PE, Pandey J, Verbalis AD, Barton M, Hodgson S, Green J, Dumont-Mathieu T, Robins DL, Fein D. Diagnostic stability in very young children with autism spectrum disorders. J Autism Develop Disorders. 2008;38(4):606–15.
7. Biswal B, Zerrin Yetkin F, Haughton VM, Hyde JS. Functional connectivity in the motor cortex of resting human brain using echo-planar mri. Magnetic Resonance Med. 1995;34(4):537–41.
8. Sporns O. Structure and function of complex brain networks. Dialogues Clin Neurosci. 2013;15(3):247.
9. Achard S, Salvador R, Whitcher B, Suckling J, Bullmore E. A resilient, low-frequency, small-world human brain functional network with highly connected association cortical hubs. J Neurosci. 2006;26(1):63–72. 10. Power JD, Cohen AL, Nelson SM, Wig GS, Barnes KA, Church JA, Vogel
AC, Laumann TO, Miezin FM, Schlaggar BL, et al. Functional network organization of the human brain. Neuron. 2011;72(4):665–78.
11. Crossley NA, Mechelli A, Vértes PE, Winton-Brown TT, Patel AX, Ginestet CE, McGuire P, Bullmore ET. Cognitive relevance of the community structure of the human brain functional coactivation network. Proc Nat Acad Sci. 2013;110(28):11583–8.
12. Meunier D, Achard S, Morcom A, Bullmore E. Age-related changes in modular organization of human brain functional networks. Neuroimage. 2009;44(3):715–23.
13. Stanfield AC, McIntosh AM, Spencer MD, Philip R, Gaur S, Lawrie SM. Towards a neuroanatomy of autism: a systematic review and meta-analysis of structural magnetic resonance imaging studies. Eur Psych. 2008;23(4):289–99.
14. Lewis JD, Theilmann R, Townsend J, Evans A. Network efficiency in autism spectrum disorder and its relation to brain overgrowth. Front Human Neurosci. 2013;7:845.
15. Plitt M, Barnes KA, Martin A. Functional connectivity classification of autism identifies highly predictive brain features but falls short of biomarker standards. NeuroImage: Clin. 2015;7:359–66.
16. Chen CP, Keown CL, Jahedi A, Nair A, Pflieger ME, Bailey BA, Müller R-A. Diagnostic classification of intrinsic functional connectivity highlights somatosensory, default mode, and visual regions in autism. NeuroImage: Clin. 2015;8:238–45.
17. Clerc M. Particle swarm optimization: Wiley; 2010.
18. Wang X, Yang J, Teng X, Xia W, Jensen R. Feature selection based on rough sets and particle swarm optimization. Patt Recogn Lett. 2007;28(4): 459–71.
19. Guyon I, Weston J, Barnhill S, Vapnik V. Gene selection for cancer classification using support vector machines. Mach Learn. 2002;46(1-3): 389–422.
20. Price T, Wee C-Y, Gao W, et al. Multiple-network classification of childhood autism using functional connectivity dynamics. In: Proceedings of the International Conference on Medical Image Computing and Computer-Assisted Intervention. Cham: Springer; 2014. p. 177–84. 21. Tolan E, Isik Z. Graph Theory Based Classification of Brain Connectivity
Network for Autism Spectrum Disorder. In: Proceedings of the International Conference on Bioinformatics and Biomedical Engineering. Cham: Springer; 2018. p. 520–30.
22. Guo X, Dominick KC, Minai AA, Li H, Erickson CA, Lu LJ. Diagnosing autism spectrum disorder from brain resting-state functional connectivity patterns using a deep neural network with a novel feature selection method. Front Neurosci. 2017;11:460.
23. Heinsfeld AS, Franco AR, Craddock RC, Buchweitz A, Meneguzzi F. Identification of autism spectrum disorder using deep learning and the abide dataset. NeuroImage: Clin. 2018;17:16–23.
24. Cao X, Wang X, Jin D, Cao Y, He D. Identifying overlapping communities as well as hubs and outliers via nonnegative matrix factorization. Sci Rep. 2013;3:2993.
25. Wang R-S, Zhang S, Wang Y, Zhang X-S, Chen L. Clustering complex networks and biological networks by nonnegative matrix factorization with various similarity measures. Neurocomputing. 2008;72(1-3):134–41. 26. Liu J, Wang C, Gao J, Han J. Multi-view clustering via joint nonnegative
matrix factorization. In: Proceedings of the 2013 SIAM International Conference on Data Mining. Society for Industrial and Applied Mathematics. SIAM; 2013. p. 252–60.
27. Ou W, Yu S, Li G, Lu J, Zhang K, Xie G. Multi-view non-negative matrix factorization by patch alignment framework with view consistency. Neurocomputing. 2016;204:116–24.
28. Zong L, Zhang X, Zhao L, Yu H, Zhao Q. Multi-view clustering via multi-manifold regularized non-negative matrix factorization. Neural Netw. 2017;88:74–89.
29. Zhang S, Liu C-C, Li W, Shen H, Laird PW, Zhou XJ. Discovery of multi-dimensional modules by integrative analysis of cancer genomic data. Nucleic Acids Res. 2012;40(19):9379–91.
30. Zhang S, Li Q, Liu J, Zhou XJ. A novel computational framework for simultaneous integration of multiple types of genomic data to identify microrna-gene regulatory modules. Bioinformatics. 2011;27(13):401–9. 31. Chen J, Zhang S. Discovery of two-level modular organization from
matched genomic data via joint matrix tri-factorization. Nucleic Acids Res. 2018;46(12):5967–76.
32. Zhang S, Zhao J, Zhang X-S. Common community structure in time-varying networks. Phys Rev E. 2012;85(5):056110.
33. Rudie JD, Brown J, Beck-Pancer D, Hernandez L, Dennis E, Thompson P, Bookheimer S, Dapretto M. Altered functional and structural brain network organization in autism. NeuroImage: Clin. 2013;2:79–94. 34. Di Martino A, Yan C-G, Li Q, Denio E, Castellanos FX, Alaerts K,
Anderson JS, Assaf M, Bookheimer SY, Dapretto M, et al. The autism brain imaging data exchange: towards a large-scale evaluation of the intrinsic brain architecture in autism. Mole Psych. 2014;19(6):659. 35. Jenkinson M, Beckmann CF, Behrens TE, Woolrich MW, Smith SM. Fsl.
Neuroimage. 2012;62(2):782–90.
36. Cox RW. Afni: software for analysis and visualization of functional magnetic resonance neuroimages. Comput Biomed Res. 1996;29(3):162–73. 37. Jenkinson M, Bannister P, Brady J, Smith S. Improved optimisation for
38. Zhang Y, Brady M, Smith S. Segmentation of brain mr images through a hidden markov random field model and the expectation-maximization algorithm. IEEE Trans Med Imaging. 2001;20(1):45–57.
39. Boyd S, Vandenberghe L. Convex Optimization. Cambridge, UK: Cambridge University Press; 2004.
40. Wang H, Huang H, Ding C. Simultaneous clustering of multi-type relational data via symmetric nonnegative matrix tri-factorization. In: Proceedings of the 20th ACM international conference on Information and knowledge management. ACM; 2011. p. 279–284.
41. Li L, Wu L, Zhang H, Wu F-X. A fast algorithm for nonnegative matrix factorization and its convergence. IEEE Trans Neural Netw Learn Syst. 2014;25(10):1855–63.
42. Tian L-P, Luo P, Wang H, Huiru Z, Wu F-X. Casnmf: A converged algorithm for symmetrical nonnegative matrix factorization. Neurocomputing. 2018;275:2031–40.
43. Bolla M. Spectral clustering and biclustering: Learning large graphs and contingency tables: Wiley; 2013.
44. Brown JA, Rudie JD, Bandrowski A, Van Horn JD, Bookheimer SY. The ucla multimodal connectivity database: a web-based platform for brain connectivity matrix sharing and analysis. Front Neuroinforma. 2012;6:28. 45. Kennedy DP, Courchesne E. The intrinsic functional organization of the
brain is altered in autism. Neuroimage. 2008;39(4):1877–85.
46. Stella XY, Shi J. Multiclass spectral clustering. In: Proceedings of the Ninth IEEE International Conference on Computer Vision. IEEE; 2003. p. 313. 47. Kumar A, Rai P, Daume H. Co-regularized multi-view spectral clustering.
In: Proceedings of Advances in neural information processing systems; 2011. p. 1413–21.
48. Newman ME, Girvan M. Finding and evaluating community structure in networks. Phys Rev E. 2004;69(2):026113.
49. Hubert L, Arabie P. Comparing partitions journal of classification. Google Scholar. 1985;2:193–218.
50. Buckner R, Andrews-Hanna J, Schacter D. The brain’s default network-Anatomy, function, and relevance to disease. Year Cogn Neurosci 2008. 2008;1124:1–38.
51. Andrews-Hanna JR. The brain’s default network and its adaptive role in internal mentation. Neurosci. 2012;18(3):251–70.
52. McAlonan GM, Cheung V, Cheung C, Suckling J, Lam GY, Tai K, Yip L, Murphy DG, Chua SE. Mapping the brain in autism. a voxel-based mri study of volumetric differences and intercorrelations in autism. Brain. 2004;128(2):268–76.
53. Abell F, Krams M, Ashburner J, Passingham R, Friston K, Frackowiak R, Happé F, Frith C, Frith U. The neuroanatomy of autism: a voxel-based whole brain analysis of structural scans. Neuroreport. 1999;10(8):1647–51. 54. Washington SD, Gordon EM, Brar J, Warburton S, Sawyer AT, Wolfe A,
Mease-Ference ER, Girton L, Hailu A, Mbwana J, et al. Dysmaturation of the default mode network in autism. Human Brain Map. 2014;35(4): 1284–96.
55. Yerys BE, Gordon EM, Abrams DN, Satterthwaite TD, Weinblatt R, Jankowski KF, Strang J, Kenworthy L, Gaillard WD, Vaidya CJ. Default mode network segregation and social deficits in autism spectrum disorder: Evidence from non-medicated children. NeuroImage: Clin. 2015;9:223–32.
56. Assaf M, Jagannathan K, Calhoun VD, Miller L, Stevens MC, Sahl R, O’boyle JG, Schultz RT, Pearlson GD. Abnormal functional connectivity of default mode sub-networks in autism spectrum disorder patients. Neuroimage. 2010;53(1):247–56.
57. Bi X-A, Liu Y, Jiang Q, Shu Q, Sun Q, Dai J. The diagnosis of autism spectrum disorder based on the random neural network cluster. Front Human Neurosci. 2018;12:257.
58. Iidaka T. Resting state functional magnetic resonance imaging and neural network classified autism and control. Cortex. 2015;63:55–67.
59. Desikan RS, Ségonne F, Fischl B, Quinn BT, Dickerson BC, Blacker D, Buckner RL, Dale AM, Maguire RP, Hyman BT, et al. An automated labeling system for subdividing the human cerebral cortex on mri scans into gyral based regions of interest. Neuroimage. 2006;31(3):968–80. 60. Kong Y, Gao J, Xu Y, Pan Y, Wang J, Liu J. Classification of autism
spectrum disorder by combining brain connectivity and deep neural network classifier. Neurocomputing. 2019;324:63–8.
Publisher’s Note