© Strojniški vestnik (43) št. 9-10, str. 433-442, 1997 © Journal o f M echanical E ngineering (43) No. 9-10, pp. 433-442, 1997 Tiskano v Sloveniji. Vse pravice pridržane. Printed in Slovenia. All rights reserved. UDK 535.374:621.791.94:669.15 SV :0039-2480(97)5-R7 UDC 535.374:621.791.94:669.15
Lasersko rezanje kovinskih materialov, ocenjevanje kakovosti reza in
optimizacija procesa
Laser Cutting Metal Materials, Estimation of Cut Quality and
Process Optimisation
JANEZ GRUM - DARJO ŽULJAN
Uporaba in uspešen nadzor laserskega rezalnega procesa sta močno povezana s poznavanjem toplotnih pojavov na rezalni fro n ti in sprememb v okolici te fronte p ri procesu laserskega rezanja. Pri laserskem rezanju s soosnim curkom oziroma rezalnega plina kisika, j e energija na rezalni fro n ti kombinacija energije laserskega snopa in eksotermne energije. Uporaba kisika kot pom ožnega plina p ri procesu laserskega rezanja poveča uporabnost tega postopka. Procesi, ki se pojavljajo na rezalni fronti, z uporabo kisika postanejo zelo zapleteni. Namen prispevka j e analizirati procese laserskega rezanja z vidika kakovosti laserskega reza s statistično analizo geom etrijskih značilnosti reza, z izračunavanjem korelacijskih koeficientov m ed spremenljivkami reza p ri različnih rezalnih hitrostih.
Ključne besede: rezanje lasersko, kovine, kakovost reza, optimiranje procesov
The application o f laser cutting and the efficiency o f laser system control are closely connected with knowledge o f the cutting process and its effect upon the surface layer o f a workpiece. In laser cutting processes with oxygen as an assistant gas, cutting energy is a combination o f laser beam energy and the energy o f the exothermic reactions occurring on the cutting front. The presence o f oxygen in the process increases cutting efficiency, but it also causes additional physical processes on the cutting fro n t which render a more detailed analysis o f the cutting phenom ena difficult. The aim o f the paper is to analyse the laser cutting process by monitoring laser cut quality by means o f measure ments and statistical analysis o f geometrical characteristics o f the cut, by calculating correlation coefficients fo r various characteristics o f the cut made at different cutting speeds.
Keywords: laser cutting, metal, cutting quality, process optimisation
0 UVOD
Laser seje kot obdelovalno orodje uveljavil tudi v proizvodnem strojništvu predvsem zaradi številnih tehnoloških prednosti. Glavna značilnost laserskih virov je, da imajo izjemno zgoščen snop laserske svetlobe, ki jo lahko priredim o različnim vrstam obdelovalnih procesov. Obdelovalnim zahtevam se lahko pri izbrani moči laserskega vira prilagodimo z izbiro različnih optičnih in kinem atičnih razmer. Posebnost pri laserskem rezanju je, da poteka proces rezanja brez mehanskega dotika med obdelovancem in orodjem , to je laserskim snopom . V m nogih uporabah je zelo pomembna kakovost reza, ki jo lahko zagotovim o s prim erno izbiro rezalnih razm er v odvisnosti od vrste in debeline materiala. Zato so uporabniki laserskih virov najprej postavljali vse ostrejše zahteve glede kakovosti laserskega vira, na drugi strani pa so začeli razvijati tudi zanesljivejše pozicionime in pomično rotacijske enote. Proizvajalci
0 INTRODUCTION
laserskih virov oziroma celotnih sistemov se zavedajo, da so investicijske vrednosti izjemno visoke, zato morajo zagotoviti vrhunsko kakovost celotnega laserskega obdelovalnega sistema. Številne raziskave procesa laserskega rezanja so zato vključevale vplive spreminjajočega se vnosa energije zaradi časovnega odstopanja moči laserskega vira, kakor tudi vpliv natančnosti vodenja obdelovanca na kakovost reza oziroma natančnost izrezovanja. Nuss je s soavtorji [ 1 ] raziskoval kakovost reza in natančnost izreza različnih velikosti okroglih rondel iz različnih vrst jekel z laserjem
C 02 s konstantnim in pulznim delovanjem. Analiza
odstopanja izreza in analiza kakovosti reza je zajemala tudi natančnost vodenja obdelovanca z numerično krmiljeno delovno mizo in vpliva različnih smeri polarizacije laserske svetlobe. Tönshoff in Samrau [2] ter Bedrin [3] so raziskovali kakovost laserskega reza z merjenjem različnih param etrov hrapavosti pri različnih močeh laserskega vira in pri različnih hitrostih pom ikov obdelovanca. Isti avtorji so prav tako raziskovali kakovost reza pri različnih optičnih sistemih z različnimi žarišči leč. Thomssen in Olsen [4] pa sta raziskovala vplive različnih oblik iztopnih odprtin šob in vplive različnih pretočnih količin oziroma različnih tlakov rezalnega plina kisika na kakovost laserskega reza.
1 EKSPERIMENTALNI POSTOPEK
Eksperimentalno delo smo opravili na domačem laserskem obdelovalnem sistemu ISKRA-LMP 600 z močjo do 600 W in s hitrostjo pomika delovne mize z obdelovancem od 20 do 50 mm/s. Uporabljali smo laser CCX, z Gaussovo porazdelitvijo intenzivnosti sevanja svetlobe v laserskem snopu zveznega delo vanja. Pri laserskem rezanju smo soosno z laserskim snopom dovajali tudi rezalni plin kisik, ki omogoča razvoj eksotermnih reakcij.
R aziskave sm o o p rav ili na n ajp o g o steje uporabljanem avstenitnem nerjavnem jeklu, legiranem s kromom in nikljem 18/10 z označbo po standardu ASTM A276-82A. Druga vrsta preizkušanega jekla je splošno nelegirano konstrukcijsko jeklo s pretežno feritno mikrostrukturo z označbo A620 po standardu ASTM.
V sklopu raziskave smo izbrali določene obdelovalne razm ere kot konstantne param etre
procesa (pregi. 1) in druge obdelovalne razmere, ki
smo jih spreminjali pri procesu laserskega rezanja (pregi. 2).
rotary units are beeing developed. Producers o f la ser sources and complete systems are fully aware that the investment values involved are extremely high, therefore, top quality o f the total laser machining system has to be guaranteed. Numerous studies of the laser cutting process have, in response, dealt with influences o f the varying energy input due to devia tion in laser source power in time, as well as the in fluence o f the accuracy o f workpiece guidance, i.e. cutting accuracy, on cut quality. Nuss et al. [1] stud ied the deviations in the size o f round roundels in la ser cutting different steels with a C 02 laser in pulsat ing and/or continuous operation. The deviation was recorded with regard to the precision o f NC-table control and the direction o f light polarisation. Tönshoff and Samrau [2] and Bedrin [3] investigated the qual ity o f the cut by measuring the roughness at varying laser source power and varying workpiece speeds. They also studied the quality o f the cut while chang ing the optical system focus position with respect to the workpiece surface. Thomassen and Olsen [4] studied the effects produced on the quality o f the cut by changing the nozzle shape and oxygen pressure.
1 EXPERIM ENTAL PROCEDURES
Experimental testing was carried out on a laser m achining system ISKRA-LM P 600 with a laser power o f up to 600 W and with a positioning table
speed from 20 to 50 mm/s. A C 02 laser with Gaussian
distribution o f light-radiation intensity in the continu ous laser beam was used. In laser cutting, cutting o x y g en - w h ich p e rm its th e d e v e lo p m e n t o f exothermic reactions - was also supplied coaxially to the laser beam. In laser cutting, oxygen was supplied as auxiliary gas.
The investigations were carried out by applying a commonly used austenitic stainless steel alloyed with chromium and nickel 18/10, designated A276-82A according to ASTM standard. The second type o f steel used was a common unalloyed structural steel A620 (according to ASTM standard) having a pre dominantly ferrite microstructure.
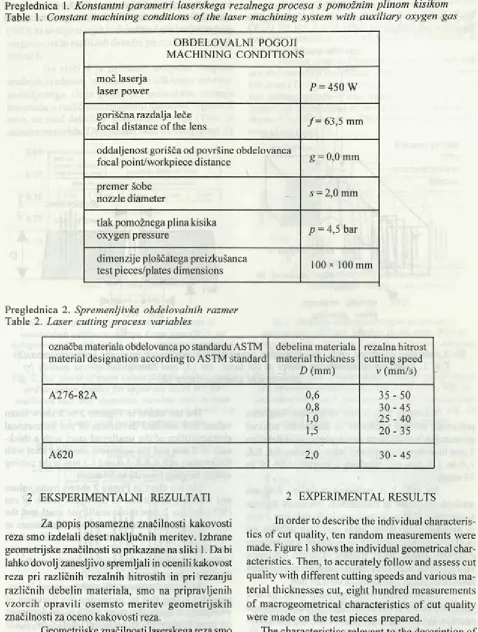
Preglednica 1. Konstantni parametri laserskega rezalnega procesa s pomožnim plinom kisikom
Table 1. Constant machining conditions o f the laser machining system with auxiliary oxygen gas
OBDELOVALNI POGOJI M ACHINING CONDITIONS
moč laserja
laser power P = 450 W
goriščna razdalja leče
focal distance o f the lens / = 63,5 mm
oddaljenost gorišča od površine obdelovanca
focal pointAvorkpiece distance g =0,0 mm
prem er šobe
nozzle diameter s =2 ,0 mm
tlak pomožnega plina kisika
oxygen pressure p = 4,5 bar
dimenzije ploščatega preizkušanca
test pieces/plates dimensions 10 0 X 10 0 mm
Preglednica 2. Spremenljivke obdelovalnih razmer
Table 2. Laser cutting process variables
označba materiala obdelovanca po standardu ASTM material designation according to ASTM standard
debelina materiala material thickness
D (mm)
rezalna hitrost cutting speed
v (mm /s)
A 276-82A 0,6 35 - 50
0,8 3 0 - 4 5
1,0 25 - 40
1,5 2 0 - 3 5
A620 2 ,0 3 0 - 4 5
2 EKSPERIM ENTALNI REZULTATI
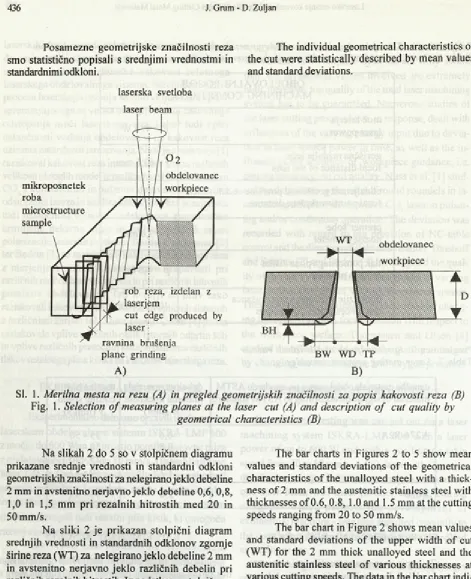
Za popis posamezne značilnosti kakovosti reza smo izdelali deset naključnih meritev. Izbrane geometrijske značilnosti so prikazane na sliki 1. Da bi lahko dovolj zanesljivo spremljali in ocenili kakovost reza pri različnih rezalnih hitrostih in pri rezanju različnih debelin m ateriala, smo na pripravljenih vzorcih opravili osem sto m eritev geom etrijskih značilnosti za oceno kakovosti reza.
Geometrijske značilnosti laserskega reza smo popisovali z: WD - spodnjo širino reza, WT - zgornjo širino reza, BH - višino srha, BW - širino srha, TM - debelino pretaljenega sloja in Ra - srednjo aritmetično hrapavostjo laserskega reza.
2 EXPERIM ENTAL RESULTS
In order to describe the individual characteris tics o f cut quality, ten random m easurements were made. Figure 1 shows the individual geometrical char acteristics. Then, to accurately follow and assess cut quality with different cutting speeds and various ma terial thicknesses cut, eight hundred measurements o f m acrogeom etrical characteristics o f cut quality were made on the test pieces prepared.
Posamezne geom etrijske značilnosti reza smo statistično popisali s srednjimi vrednostmi in standardnimi odkloni.
laserska svetloba
laser beam
The individual geometrical characteristics o f the cut were statistically described by mean values and standard deviations.
mikroposnetek roba
microstructure sample
WT
rob reza, izdelan z
- ^ laserjčm
obdelovanec
workpiece
edge produced bv i
BH ~K~
)rusenia
r
- > ---»--- •—plane grinding
A)
BW WD TP
B)
Sl. 1. Merilna mesta na rezu (A) in pregled geometrijskih značilnosti za popis kakovosti reza (B)
Fig. 1. Selection o f measuring planes at the laser cut (A) and description o f cut quality by geometrical characteristics (B)
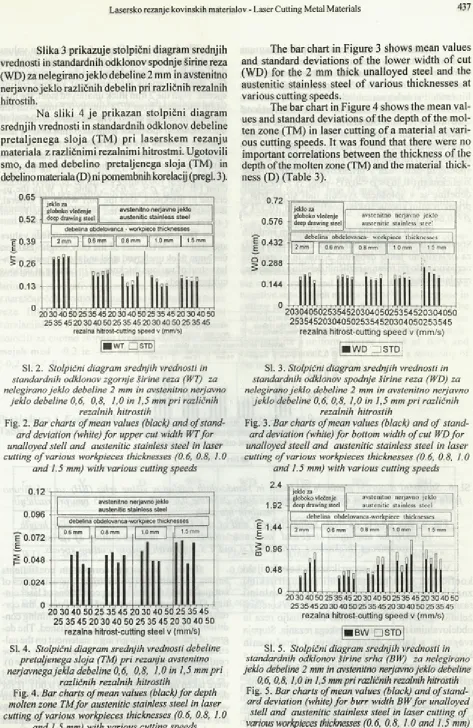
N a slikah 2 do 5 so v stolpičnem diagramu prikazane srednje vrednosti in standardni odkloni geometrijskih značilnosti za nelegirano jeklo debeline 2 mm in avstenitno nerjavno jeklo debeline 0,6,0,8, 1,0 in 1,5 mm pri rezalnih hitrostih m ed 20 in 50 mm/s.
N a sliki 2 je prikazan stolpični diagram srednjih vrednosti in standardnih odklonov zgornje širine reza (WT) za nelegirano jeklo debeline 2 mm in avstenitno nerjavno jeklo različnih debelin pri različnih rezalnih hitrostih. Iz podatkov v stolpičnem diagramu izhaja, da je srednja vrednost odklonov zgornje širine reza (WT) znatno večja pri nelegiranem jeklu in se giblje v mejah 0,28 do 0,29 mm.
Za avstenitno nerjavno jeklo velja, da se z večanjem debeline materiala obdelovanca zmanjšuje zgornja širina reza s pričakovanim korelacijskim koeficientom (-0,08 < p < -0,422 - preglednica 3). Pozicioniranje visoko energijskega laserskega snopa je zelo pomembno, vpliva na velikost posameznih geometrijskih značilnosti reza in še posebej na zgornjo širino reza (WT), kar so potrdili tudi številni preizkusi.
The bar charts in Figures 2 to 5 show mean values and standard deviations o f the geometrical characteristics o f the unalloyed steel with a thick ness o f 2 mm and the austenitic stainless steel with thicknesses o f 0.6 ,0 .8 ,1 .0 and 1.5 mm at the cutting speeds ranging from 20 to 50 mm/s.
The bar chart in Figure 2 shows mean values and standard deviations o f the upper width o f cut (WT) for the 2 mm thick unalloyed steel and the austenitic stainless steel o f various thicknesses at various cutting speeds. The data in the bar chart indi cate that the mean value o f deviations o f the upper width o f cut (WT) is much higher with the unalloyed steel and ranges from 0.28 to 0.29 mm.
Slika 3 prikazuje stolpični diagram srednjih vrednosti in standardnih odklonov spodnje širine reza (WD) za nelegirano jeklo debeline 2 mm in avstenitno nerjavno jeklo različnih debelin pri različnih rezalnih hitrostih.
N a sliki 4 je prikazan stolpični diagram srednjih vrednosti in standardnih odklonov debeline p retaljen eg a slo ja (TM ) pri laserskem rezanju materiala z različnimi rezalnimi hitrostmi. Ugotovili smo, da med debelino pretaljenega sloja (TM) in debelino materiala (D) ni pomembnih korelacij (pregi. 3).
The bar chart in Figure 3 shows mean values and standard deviations o f the lower width o f cut (WD) for the 2 mm thick unalloyed steel and the austenitic stainless steel o f various thicknesses at various cutting speeds.
The bar chart in Figure 4 shows the mean val ues and standard deviations o f the depth o f the mol ten zone (TM) in laser cutting o f a material at vari ous cutting speeds. It was found that there were no important correlations between the thickness o f the depth o f the molten zone (TM) and the material thick ness (D) (Table 3).
0.65
0.52
? 0.39 E. 5 0.26
0.13
0
jeklo za globoko vlečenje deep drawing steel
a vstenitno n e rja vno je k lo a u ste n itic sta in le ss steel
debelina obdelovanca - workpiece thicknesses
...I 2 mm |-| 0.6 mm 11 0.8 mm | 1.0 mm j 1.5 mm
20 30 40 50 25 35 45 20 30 40 50 25 35 45 20 30 40 50 25 35 45 20 30 40 50 25 35 45 20 30 40 50 25 35 45
rezaln a h itro st-cu ttin g spee d v (m m /s)
■ W T □ S T D
0.72
0.576
10.432
g 0 .2 8 8
0.144
0
2535452030405025354520304050253545 rezalna hitrost-cutting speed v (mm/s)
■ WD Z l STD I
SI. 2. Stolpični diagram srednjih vrednosti in standardnih odklonov zgornje širine reza (fVT) za nelegirano je k lo debeline 2 mm in avstenitno nerjavno
je k lo debeline 0,6, 0,8, 1,0 in 1,5 mm p r i različnih rezalnih hitrostih
Fig. 2. Bar charts o f mean values (black) and o f stand ard deviation (white) fo r upper cut width W T for unalloyed stell a n d austenitic stainless steel in laser cutting o f various workpieces thicknesses (0.6, 0.8, 1.0
a n d 1.5 mm) with various cutting speeds
SI. 3. Stolpični diagram srednjih vrednosti in standardnih odklonov spodnje širine reza (WD) za nelegirano je k lo debeline 2 mm in avstenitno nerjavno
jeklo debeline 0,6, 0,8, 1,0 in 1,5 mm p r i različnih rezalnih hitrostih
Fig. 3. Bar charts o f mean values (black) a n d o f stand ard deviation (white) fo r bottom width o f cut WD fo r unalloyed steell a n d austenitic stainless steel in laser cutting o f various workpieces thicknesses (0.6, 0.8, 1.0
and 1.5 mm) with various cutting speeds
25 35 45 20 30 40 50 25 35 45 20 30 40 50 rezalna hitrost-cutting steel v (mm/s) SI. 4. Stolpični diagram srednjih vrednosti debeline
pretaljenega sloja (TM) p ri rezanju avstenitno nerjavnega je k la debeline 0,6, 0,8, 1,0 in 1,5 mm p ri
različnih rezalnih hitrostih
Fig. 4. Bar charts o f mean values (black) fo r depth molten zone TM fo r austenitic stainless steel in laser cutting o f various workpieces thicknesses (0.6, 0.8, 1.0
and 1.5 mm) with various cutting speeds
2.4
1.92
I 1.44
§ 0 96
0Q
0.48
0
20 30 40 50 25 35 45 20 30 40 50 25 35 45 20 30 40 50 25 35 45 20 30 40 50 25 35 45 20 30 40 50 25 35 45
rezalna hitrost-cutting speed v (mm/s) ■ BW □ STD
SI. 5. Stolpični diagram srednjih vrednosti in standardnih odklonov širine srha (B W) za nelegirano jeklo debeline 2 mm in avstenitno nerjavno jeklo debeline
0,6, 0,8, 1,0 in 1,5 mm pri različnih rezalnih hitrostih
Fig. 5. Bar charts o f mean values (black) and o f stand a rd deviation (white) fo r burr width B W fo r unalloyed stell a n d austenitic stainless steel in laser cutting o f various workpieces thicknesses (0.6, 0.8, 1.0 and 1.5 mm)
with various cutting speeds jeklo za
globoko vlečenje deep drawing steel
avstenitno nerjavno jeklo austenitic stainless steel
debelina obdelovanca-workpiece thicknesses
2 mm 0.6 mm 0 8 mm 1.0 mm 1.5 mm
N a sliki 5 je prikazan stolpični diagram srednjih vrednosti in standardnih odklonov širine srha (BW) za nelegirano jeklo debeline 2 mm in avstenitno nerjavno jeklo različnih debelin pri različnih rezalnih hitrostih. Pri nelegiranem jeklu debeline 2 mm se z naraščanjem rezalne hitrosti povečuje širina srha od 0,28 mm do 0,7 mm. Standardni odklon širine srha se zvečuje z rezalno hitrostjo od 0,03 mm do 0,11 mm. Pri avstenitnem nerjavnem jeklu ugotavljamo, da se z naraščanjem rezalne hitrosti zmanjšuje širina srha na spodnjem delu reza s pričakovanim korelacijskim koeficientom (-0,363 <p < -0,635 - pregi. 3). Z večanjem debeline se v splošnem zvečuje tudi širina srha s pričakovanim korelacijskim koeficientom (0,371 <
p < 0,641 - pregi. 3)
Slika 6 prikazuje stolpični diagram srednjih vrednosti in standardnih odklonov višine srha (BH)
za nelegirano jeklo debeline 2 mm in avstenitno
nerjavno jeklo pri rezanju različnih debelin z različnimi rezalnimi hitrostmi.
The bar chart in Figure 5 shows mean values and standard deviations o f the burr width (BW) on the 2 mm thick unalloyed steel and the austenitic stain less steel o f various thicknesses at various cutting speeds. With the 2 mm thick unalloyed steel, the burr width increases from 0.28 mm to 0.7 mm with the increase in cutting speed. The standard deviation of the burr width increases from 0.03 mm to 0.11 mm with the increase in cutting speed. It was found for the austenitic stainless steel that with the increase in cutting speed, the burr width at the lower part o f the cut decreased with the expected correlation coeffi cient (-0.363 < p < -0.635 - Table 3). With the in crease in thickness, also the burr width, in general, increases with the expected correlation coefficient (-0.371 < p < 0.641 - Table 3).
The bar chart in Figure 6 shows mean values
and standard deviations o f the burr height (BH) on the 2 mm thick unalloyed steel and the austenitic stain less steel o f various thicknesses in cutting at various cutting speeds.
2 5 3 5 4 5 20 30 40 50 25 3545 20 3 0 4 0 5 0 2 5 3 5 4 5
rezalna hitrost-cutting speed v (mm/s) ■ BH n S T D
SI. 6. Stolpični diagram srednjih vrednosti in standardnih odklonov višine srha (BH) za nelegirano jeklo debeline 2 mm in avstenitno nerjavno jeklo debeline 0,6, 0,8, 1,0 in 1,5 mm pri različnih
rezalnih hitrostih
Fig. 6. Bar charts o f mean values (black) and o f standard deviation (white) fo r burr height (BH) fo r unalloyed steel and austenitic stainless steel in laser cutting o f various
workpieces thicknesses (0.6, 0.8, 1.0 and 1.5 mm) with various cutting speeds.
V p reg le d n ic i 3 so p rik azan i k o rela cijsk i k o e fic ie n ti m ed p o sa m e z n im i g e o m e trijsk im i zn ačilnostm i k ak o v o sti reza in obdelovalnim i razmerami laserskega rezanja. Po izračunih korelacij želimo ugotoviti povezave med kakovostjo reza in obdelovalnimi razmerami laserskega rezanja. Stopnja tveganja, s katero dajem o izjavo o izračunanih korelacijah, je lahko različna in jo lahko potrdimo s statističnim preizkusom (Ho: p = 0; H I: p ^ 0). Za naš primer smo upoštevali naslednje stopnje tveganja: 0 ,0 5 , 0,01 in 0 ,0 0 1 . Č e j e p ri iz ra č u n a n e m korelacijskem koeficientu podan rezultat z stopnja tveganja 0,05 pomeni, da je tveganje v napovedi precejšnje. Rezultati korelacij s stopnjo tveganja 0,05
povedo, da v povprečju lahko pričakujemo v enem od dvajsetih preizkusov nezanesljivo napoved za dano korelacijo. Bolj zanesljive so trditve pri rezultatih za izračunano stopnjo tveganja 0,01 ali 0,001. V preglednicah izračunanih korelacijskih koeficientov je podana tudi stopnja tveganja za izračunane korelacije med posameznimi značilnostmi in je v preglednici označena z zvezdico ali brez nje, in sicer: stopnja tveganja da trditev velja 0,05 je označeno z ( ), stopnja tveganja da trditev velja 0 ,0 1 je označeno z (*)in stopnja tveganja, da trditev velja 0 ,0 0 1 je označeno z (**). Iz danih pregledničnih podatkov lahko ocenimo zanesljivost napovedanih korelacij oziroma povezav med posameznimi značilnostmi.
Tako sm o za av stenitno nerjavno jek lo izračunali korelacijski koeficient med rezalno hitrostjo (v) in spodnjo širino reza (W D) rxy = -0,3689**. Izračunana korelacija med rezalno hitrostjo in spodnjo širino reza je negativnega značaja, kar pomeni, da se z naraščajočo hitrostjo rezanja zmanjšuje spodnja širina reza. In te rv al z a u p an ja za pravo v red n o st (p ) korelacijskega koeficienta v osnovni populaciji smo določili za enotno stopnjo tveganja 0,05 in znaša v m ejah med -0,2 in -0,5 ali z zapisom intervala (-0 ,2 < p < - 0 ,5 ) .
that on the average it m ay be expected that in one out o f twenty experiments the prediction for the cor relation given will not be reliable. Statements are more reliable with the results o f a calculated degree o f risk o f 0.01 or 0.001. In the tables containing the calcu lated correlation coefficients, the degree o f risk in volved with the calculated correlations between the individual characteristics is also stated. It is marked either with an asterix or without it - i.e. the degree o f risk indicating that the statement is 0.05 true is marked by ( ), the degree o f risk that the statem ent is 0 .0 1 true is marked by (*), and the degree o f risk that the statement is 0.001 true is m arked by (**). On the basis o f the data stated in the Tables, the reliability of the correlations predicted, i.e. relations between the individual characteristics, may be assessed.
Thus for the austenitic stainless steel, a corre lation coefficient between the cutting speed (v) and the bottom width o f cut (WD), i.e. rxy = -0.3689**, was calculated. The calculated correlation between the cutting speed and the bottom width o f cut has a negative sign, which means that with the increase in cutting speed the bottom width o f cut decreases. The confidence interval for the actual value (p ) o f the correlation coefficient in the basic population was de termined for a uniform degree o f risk o f 0.05, and ranges between -0.2 and -0.5 or with a recording o f the interval (-0.2 < p < -0.5).
Preglednica 3. Korelacijski koeficienti izračunani za različne pare spremenljivk
Table 3. Correlation coefficients calculated fo r various pairs o f variables
I*xy V D WT WD TM BW BH
V 1,0000 -0,775** 0,143 -0,368** -0,219* -0,508** -0,698**
D -0,779** 1,0000 -0,264* 0,463** 0,099 0,517** 0,6 8 8**
WT 0,143 -0,264* 1,0000 0,084 -0,098 -0,194 -0,161
WD -0,368** 0,463** 0,084 1,0000 -0,008 0,250* 0,4062**
TM -0,219* 0,099 -0,098 -0,008 1,0000 -0,008 0,1779
BW -0,508** 0,517** 0,194 0,250* -0,008 1,0000 0,663**
BH -0,698** 0,6 8 8** -0,161 0,4062** 0,1779 0,663** 1,000
N a te m e lju iz ra č u n a n ih k o re la c ijs k ih koeficientov med posameznimi spremenljivkami in za dani interval zaupanja za njihovo pravo vrednost korelacijskega koeficienta lahko ocenjujemo povezave med posameznimi značilnostmi in njihov vpliv na kakovost reza pri spreminjanju rezalnih razmer.
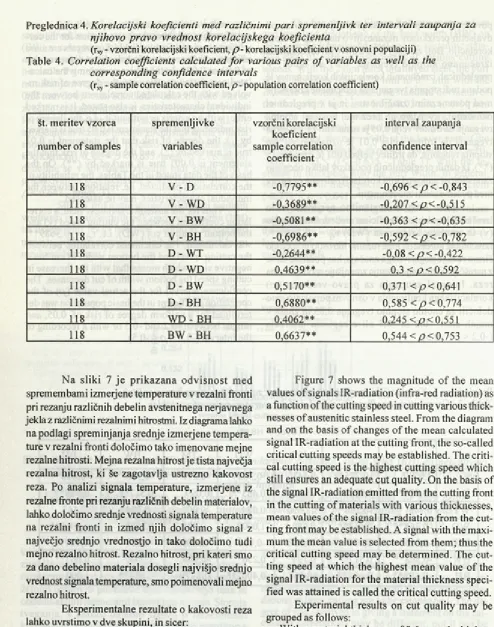
Preglednica 4. Korelacijski koeficienti med različnimi pari spremenljivk ter intervali zaupanja za njihovo pravo vrednost korelacijskega koeficienta
(rxy - vzorčni korelacijski koeficient, p -korelacijski koeficient v osnovni populaciji) Table 4. Correlation coefficients calculated fo r various pairs o f variables as well as the
corresponding confidence intervals
(rxy - sample correlation coefficient, p - population correlation coefficient)
št. meritev vzorca
number o f samples
spremenljivke
variables
vzorčni korelacijski koeficient sample correlation
coefficient
interval zaupanja
confidence interval
118 V - D -0,7795** -0,696 < p < -0,843
118 V - W D -0.3689** -0.207 <£><-0,515
118 V - BW -0,5081** -0,363 < p < -0,635
118 V - BH -0,6986** -0,592 < p < -0,782
118 D - WT -0,2644** -0,08 < p < -0,422
118 D - WD 0.4639** 0.3 <£><0,592
118 D - BW 0,5170** 0,371 < p < 0,641
118 D - BH 0,6880** 0,585 < p < 0,774
118 WD - BH 0.4062** 0.245 < o<0.551
118 BW - BH 0,6637** 0,544 < p < 0,753
N a sliki 7 je p rik a z an a o d v isn o st m ed spremembami izmerjene temperature v rezalni fronti pri rezanju različnih debelin avstenitnega nerjavnega jekla z različnimi rezalnimi hitrostmi. Iz diagrama lahko na podlagi spreminjanja srednje izmerjene tempera ture v rezalni fronti določimo tako imenovane mejne rezalne hitrosti. Mejna rezalna hitrost je tista največja rezalna hitrost, ki še zagotavlja ustrezno kakovost reza. Po analizi signala temperature, izmerjene iz rezalne fronte pri rezanju različnih debelin materialov, lahko določimo srednje vrednosti signala temperature na rezalni fronti in izmed njih določimo signal z največjo srednjo vrednostjo in tako določimo tudi mejno rezalno hitrost. Rezalno hitrost, pri kateri smo za dano debelino m ateriala dosegli najvišjo srednjo vrednost signala temperature, smo poimenovali mejno rezalno hitrost.
Eksperimentalne rezultate o kakovosti reza lahko uvrstimo v dve skupini, in sicer:
- Pri debelini materiala 0,6 mm je dosežena naj višja vrednost signala temperature pri znatno večjih rezalnih hitrostih, od izbranih v naših raziskavah. Rezultati meritev torej potrjujejo, da bi morali za dano debelino materiala dopolniti analizo o kakovosti reza še pri večjih rezalnih hitrostih.
Figure 7 shows the magnitude o f the mean values o f signals IR-radiation (infra-red radiation) as a function o f the cutting speed in cutting various thick nesses o f austenitic stainless steel. From the diagram and on the basis o f changes o f the mean calculated signal IR-radiation at the cutting front, the so-called critical cutting speeds may be established. The criti cal cutting speed is the highest cutting speed which still ensures an adequate cut quality. On the basis of the signal IR-radiation emitted from the cutting front in the cutting o f materials with various thicknesses, mean values o f the signal IR-radiation from the cut ting front may be established. A signal with the maxi mum the mean value is selected from them; thus the critical cutting speed may be determined. The cut ting speed at which the highest mean value o f the signal IR-radiation for the material thickness speci fied was attained is called the critical cutting speed.
Experimental results on cut quality may be grouped as follows:
- Pri preostalih debelinah materiala lahko ugotovimo, da so srednje vrednosti signala temperature pri manjših hitrostih rezanja skoraj konstantne in se nato znižajo pri večjih rezalnih hitrostih. Iz analize signala temperature ugotavljamo, da za debelino
m ateriala 0,8 mm dobimo mejno hitrost rezanja
40 mm/s, za debelino m ateriala 1,0 mm je pri 35 mm/s, za debelino 1,5 mm pa pri 30 mm/s.
Razvili smo kriterij za določevanje mejne rezalne hitrosti laserskega rezanja, ki pomeni tudi optimalno rezalno hitrost, določeno na podlagi signala tem p e ra tu re . D o k azali sm o, da lahko uspešno določimo rezalno hitrost z merjenjem signala tempera ture in določevanjem njene srednje vrednosti. Dobljeni rezultati o optimalnih laserskih rezalnih razmerah so bili potrjeni tudi s statistično analizo in dodatno primerjavo z vizualno oceno kakovosti reza.
S statistično obdelavo podatkov o geometrijskih
značilnosti reza glede na spremenljivke obdelovalnih razmer in spremenljivke laserskega procesa rezanja, smo ugotovili, da lahko s spreminjanjem rezalne hitrosti odločilno vplivamo na kakovost reza.
- With other material thicknesses it may be found that the mean values o f the signal IR-radiation at lower cutting speeds are almost constant, and then decrease with the increase in cutting speed. On the basis o f the analysis o f the signal IR-radiation it is found that for a material thickness o f 0.8 mm a critical cutting speed o f 40 mm/s is obtained, for a material thickness o f 1.0 mm that o f 35 mm/s, and for a material thickness o f 1.5 mm that o f 30 mm/s.
A criterion for determination o f the critical cutting speed in laser cutting was developed. It also represents the optimum cutting speed determ ined on the basis o f the signal IR-radiation. It was proved that a cutting speed may successfully be determined by measuring the signal IR-radiation and determining its mean value. The results obtained with the opti mum laser cutting conditions were confirmed also by the statistical analysis and by an additional com pari son with the visually assessed cut quality.
By means o f the statistical processing o f the data on the geometrical characteristics o f the cut with regard to the variables o f the m achining conditions and the variables o f the laser cutting process, it was found that changes in cutting speed m ay essentially affect cut quality.
- » - 0.6 mm —— 0.8 mm — 1.0 mm - * - 1.5 mm
SI. 7. Določevanje mejnih rezalnih hitrosti laserskega rezanja p ri različnih debelinah pločevine
avstenitnega nerjavnega je k la
Fig. 7. Determination o f critical cutting speed in laser cutting o f austenitic stainless steel o f various thicknesses
Postopek določevanja mejne rezalne hitrosti je naslednji:
1. Izberemo določeno rezalno hitrost in izmerimo sig nal temperature z zbiranjem infrardečega sevanja iz rezalne fronte ter določimo njegovo srednjo vrednost.
2. Nato postopek ponavljamo z zveznim ali koračnim spreminjanjem rezalne hitrosti.
3. Pri naglem zmanjšanju srednje vrednosti signala temperature je dosežena mejna rezalna hitrost, ki je po naših merilih mejna oziroma optimalna rezalna
hitrost.
Predlagani postopek omogoča določevanje m ejn e re z a ln e h itro s ti m ed sam im pro ceso m lase rsk e g a rez a n ja , k a r lahko up o rab ljam o za krm iljenje procesa. Postopek je zelo preprost in
The procedure for determining the critical cut ting speed is as follows:
1. A specified cutting speed is selected, the signal is measured by means o f IR-radiation intensity at the cutting front, and its mean value is determined. 2. The procedure is repeated by continuous or
stepwise changing o f cutting speeds.
3. On a rapid decrease o f the mean value o f the signal IR-radiation, the critical cutting speed is achieved which, in accordance with our criteria, represents the optimum cutting speed.
praktičen saj pri spreminjanju moči laserskega vira, optičnih razmer in/ali kinematičnih razmer, lahko določamo optimalne pogoje laserskega rezanja za posamezne vrste in debeline materialov.
3 SKLEPI
N a podlagi rezultatov opravljene raziskave o kakovosti laserskega reza lahko ugotovimo, da je za doseganje kakovostnega laserskega reza m ožno uspesno krm iljenje procesa na tem elju srednje vrednosti signala tem p eratu re, ki ga dobim o z zajemanjem infrardečega sevanja iz rezalne fronte. To lahko dosežemo s kratkotrajnimi preizkusi, ki omogočajo za dano vrsto materiala in dano debelino m ateriala določevanje m ejne ozirom a optim alne rezalne hitrosti.
R aziskave so potrdile, da izbrane rezalne hitrosti pri laserskem rezanju ne smejo preseči mejnih vrednosti, če želimo zagotoviti želeno kakovost reza. M ejna rezalna hitrost je torej hkrati tudi optimalna rezalna hitrost, saj je poleg zagotovljene kakovosti reza dosežen tudi optim alen vnos energije laserskega snopa. Zato predlagamo uporabo srednje vrednosti s ig n a la te m p e ra tu re za o p tim ira n je p ro c e s a laserskega rezanja, pri sočasnem zagotavljanju kakovosti reza.
optical and kinematic conditions it is possible to de termine the optimum laser cutting conditions. The same optimization procedure o f the laser cutting proc ess may also be used for other related materials.
3 CONCLUSIONS
On the basis o f the results o f the investigation conducted on laser-cut quality it may be concluded that, in order to achieve a quality laser-cut, efficient process control is possible by means o f the mean value o f the signal IR-radiation obtained by capturing IR radiation from the cutting front. This may be achieved by experiments o f short duration which permit, for a specified kind o f material and material thickness, which determination o f the critical, i.e. optimum, cut ting speed.
The investigations confirmed that the cutting speeds selected in laser cutting should not exceed the critical values if the cut quality required is to be ensured. The critical cutting speed is at the same time the optimum cutting speed since not only the cut quality required is obtained but also an optimum energy in put o f the laser beam. Therefore, it is proposed that the mean value o f the signal IR-radiation may be used for optimisation o f the laser cutting process with si multaneous assurance o f cut quality.
4 LITERATURA 4 REFERENCE
[1] Nuss, R., S. Biermann, M. Geiger: Precise cutting of sheet metal with C 02 Laser. Laser Treatment of Materials, ed.: B. L. Mordike, Deutsche Gesselschaft für Metallkunde, Oberursel, Germany, 1987, 279 -288.
[2] Tönshoff, H. K., H. Semrau: Effect of laser cutting on the physical and technological properties of the surface of cut. Laser Treatment of Materials, ed.: B.L. Mordike. Deutsche Geselschaft fur Metallkunde, Oberursel, Germany, 1987, 299-308.
[3] Bedrin, C., S. F. Yuan, M. Querry: Investigation of surface microgeometry in laser cutting. Armais of CIRP, voi. 37, no. 1,1988, 157-160.
[4] Thomssen, F. B., F. O. Olsen: Experimental studies in nozzle design for laser cutting, Proc. of the 1st Int. Conf. on Laser in Manufacturing, ed.:M.F. Kimm, Brighton,UK, 1983,169-180.
[5] Blejec, M.: Statistične metode za ekonomiste. Univerza v Ljubljani, Ljubljana, 1976.
[6] Žuljan, D., J. Gram: Detection of heat responses in laser cutting. 15th Conference on Materials Testing in Metalurgy, 11th Congress on Materials Testing EUROMAT 94, Conference Proceedings, ed.: B. Vorsatz and E. Szöke, Respon sible for publication: P. Tardy, Balatonszeplak, Hungary, Volume IV, 1994,1077-1082.
[7] Grum, J., D. Žuljan: Thermal response analysis of laser cutting austenitic stainless steel. MAT-TEC '96, Improve ment of Materials, Technology Transfer Series, Series ed.: A. Niku Lari, Subject ed.: Jian Lu, Paris, Goumay sur Mame, France, 1996,301-311.
[8] Grum, J., D. Žuljan: Analysis of heat effects in laser cutting of steels. Journal of Materials Engineering and Perform ance, voi. 5,no.4,1996,526-537.
[9] Grum, J., D. Žuljan: Estimation of cut quality after laser cutting of austenitic stainless steel. 13th Conference BIAM’96, Zagreb, Croatia, 1996, Dl - D6.
[10] Grum, J., D. Žuljan: Estimation of the quality of cut after laser cutting austenitic stainless steel. 6th European Conference on Laser Treatment of Materials, ed.: F. Dausinger, H. W. Bergmann, J. Siger, ECLAT '96, Stuttgart, Germany, voi. 2,1996,1007-1016.
[11] Grum, J., D. Žuljan: Thermal response analysis of laser cutting austenitic stainless steel, AMST’96,4th Int. Confe rence on Advanced Manufacturing Technology, Udine, Italy, 1996,495-502.
Naslov avtorjev: prof. dr. Janez Grum, dipl. inž. dr. Darjo Žuljan, dipl. inž. Fakulteta za strojništvo Univerza v Ljubljani Aškerčeva 6
1000 Ljubljana
Authors’ Address: Prof. Dr. Janez Grum, Dipl. Ing. Dr. Darjo Žuljan, Dipl. Ing.
Faculty of Mechanical Engineering University of Ljubljana
Aškerčeva 6
1000 Ljubljana, Slovenia
Prejeto: