Published online October 30, 2013 (http://www.sciencepublishinggroup.com/j/ijrse) doi: 10.11648/j.ijrse.20130206.14
A calculation and analysis of carbon emissions from 2005
to 2010 in Baoding City
Lei Wen, Longxiu Xu
Department of Economics and Management, North China Electric Power University, Baoding 071003, China
Email address:
[email protected](Lei Wen), [email protected](Longxiu Xu)
To cite this article:
Lei Wen, Longxiu Xu. A Calculation and Analysis of Carbon Emissions from 2005 to 2010 in Baoding City. International Journal of Renewable and Sustainable Energy. Vol. 2, No. 6, 2013, pp. 212-216. doi: 10.11648/j.ijrse.20130206.14
Abstract:
Carbon emissions problem is getting attention by various Chinese provinces. In this paper, though electricity heating, industrial, transportation and building five aspects,we calculated and analyzed the carbon emissions in Baodingfrom 2005 to 2010 According to calculation results propose appropriate policy recommendations.
Keywords:
Carbon Emissions, Calculation, Policy1. Introduction
With economic development and social progress, the drawbacks of excessive growth of China's economic begin to emerge, particularly in the carbon emissions. Carbon emissions sustains growth, that not only increased the pressure on energy supply, but also to make China into a high-pollution, high carbon emissions country.
Chinese government recognizes that urban conservation is the foundation to achieve the goal of national greenhouse gas control. Therefore, faced with the remaining relatively weak ability of China city in mitigating and adapting to climate change, the Chinese government launched a low-carbon city pilot project in July 2010. The five province, Guangdong, Liaoning, Hubei, Shanxi and Yunnan, and eight city were identified as pilot areas, and Baoding has become one of the eight pilot cities.
As one of the pilot cities of China's low-carbon city and WWF (World Wildlife Fund), Baoding City has its own special status and significance. In this paper, we calculate the carbon emission in Baoding and analyze the result. So that it can help us understand the trend of the China’s overall carbon emission and explore a road lead to low carbon city.
2. Status in Baoding
In late 1994, New Baoding city formed with the merging of Baoding area and old Baoding city under the approval of State Council. Baoding is the largest populous city in Hebei province in China, which has an important role in the
economic circle surrounding Bohai Sea. Baoding ruled 4 cities (Dingzhou, Zhuozhou, Anguo, Gaobeidian) , 18 counties ( Yi County, Xushui County, Laiyuan County, Dingxing County, Shunping County, Tangxian County, Wangdu County, Laishui County, Qingyuan County, Mancheng County, Gaoyang County, Anxin County,Xiongxian county, Rongcheng County, Quyang County, Fuping County, Boye County, Lixian County) 3 districts ( South district, North district and New district ) with a population of 11 million. It has a population of 1.1million in the city area and is approved by State Council to be one of the 118 megalopolises which have a population over one million.
Since China’s reform and opening-up, all social and economic undertakings have made progress with the improvement in living standards. We have established industrial production system with automobile manufacturing, electro mechanic, textile, food, building materials and information production industries etc as the major industries. We have developed industrial bases for fur & leather, stone carvings, Chinese herbs, pepper, strawberries etc. Meanwhile, the infrastructures for energy, transportation and communication were well improved around the city, science and education etc social undertakings were well developed and social civilization has been improving.
development on a prominent position, put emphasis on projects, maintain stability , benefit people ”, which laid a sound foundation for achieving the 12th Five year plan[1].
Figure 1 and Figure 2 show that, since 2003, Baoding maintains a rapid growth in GDP, Which increased from 77.869 billion yuan to 205.03 billion yuan in 2010, Among all, since 2005, The average GDP growth rate in Baoding is above 10%.
Figure 1.Baoding GDP information from 2000 to 2010
Figure 2. Baoding GDP growth rate from 2006 to 2010
We Compared Baoding per capita GDP with Hebei province per capita GDP from 2005 to 2010, the result shows in Figure 3. Baoding per capita GDP has been growing rapidly but it is relatively slow comparing with the provincial growth, on the other hand, it indicates that Baoding is slow in industrial structure adjustment and economic growth.
Figure 3. Baoding per capita GDP comparing with Hebei province per capita GDP from 2005 to 2010
Last decade, Baoding three major industries have been maintaining a relatively rapid pace of development. Among all, primary industry grows relatively slow, tertiary industry
maintains a stable growth, and secondary industry grows relatively rapid. Secondary industry GDP has increased 21.4% in 2010 compared with 2009.
Figure 4 show that, the growth rates of three industries were different, but the industrial structure did not change much, The percentage of primary industry decreased from 20% in year 2000 to 15% in 2010, the percentage of secondary industry maintains a growth from 45% in 2000 increased to 52% in 2010. The percentage of tertiary industry has a relative mild wave range around 33%.
Figure 4. Baoding three major industries structure from 2000 to 2010
3. Method
Urban energy-related carbon dioxide emission inventory methodology consists of two scopes-- direct emission and indirect emission. We can obtain the urban energy related carbon dioxide emission by calculating the two scopes and integrating the results.
We use top-down methods, which is from the IPCC inventory guideline, to estimate the direct emissions, and obtain the final results by verifying and balancing the estimations.
The top-down calculation method is based on the energy balance sheet. Energy balance sheet is the way of reflecting the energy balance in social economic development. It intuitively reveals balance between the energy resources, conversion and final consumption from quantity. Energy balance sheets consist of single balance sheets of various energy, in which record supplies, conversion, final consumption of various energy in matrices form, it intuitively describes the connection between national or regional supply & demand and conversion as well as resources supply structure and consumption demand structure[2-4]. All data correspond to the related energy balance date.
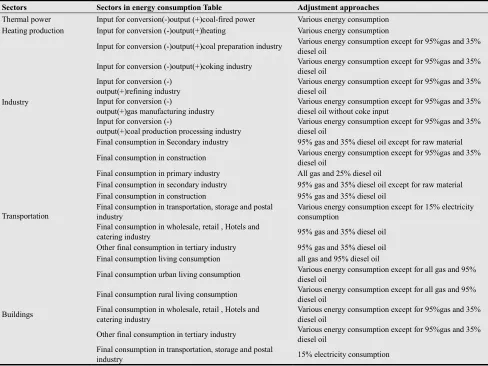
Table 1. Energy consumption adjustment approaches for each sector
Sectors Sectors in energy consumption Table Adjustment approaches
Thermal power Input for conversion(-)output (+)coal-fired power Various energy consumption Heating production Input for conversion (-)output(+)heating Various energy consumption
Industry
Input for conversion (-)output(+)coal preparation industry Various energy consumption except for 95%gas and 35% diesel oil
Input for conversion (-)output(+)coking industry Various energy consumption except for 95%gas and 35% diesel oil
Input for conversion (-) output(+)refining industry
Various energy consumption except for 95%gas and 35% diesel oil
Input for conversion (-)
output(+)gas manufacturing industry
Various energy consumption except for 95%gas and 35% diesel oil without coke input
Input for conversion (-)
output(+)coal production processing industry
Various energy consumption except for 95%gas and 35% diesel oil
Final consumption in Secondary industry 95% gas and 35% diesel oil except for raw material
Final consumption in construction Various energy consumption except for 95%gas and 35% diesel oil
Transportation
Final consumption in primary industry All gas and 25% diesel oil
Final consumption in secondary industry 95% gas and 35% diesel oil except for raw material Final consumption in construction 95% gas and 35% diesel oil
Final consumption in transportation, storage and postal industry
Various energy consumption except for 15% electricity consumption
Final consumption in wholesale, retail , Hotels and
catering industry 95% gas and 35% diesel oil Other final consumption in tertiary industry 95% gas and 35% diesel oil Final consumption living consumption all gas and 95% diesel oil
Buildings
Final consumption urban living consumption Various energy consumption except for all gas and 95% diesel oil
Final consumption rural living consumption Various energy consumption except for all gas and 95% diesel oil
Final consumption in wholesale, retail , Hotels and catering industry
Various energy consumption except for 95%gas and 35% diesel oil
Other final consumption in tertiary industry Various energy consumption except for 95%gas and 35% diesel oil
Final consumption in transportation, storage and postal
industry 15% electricity consumption
On this basic, referencing 2006 IPCC Guidelines for National Greenhouse-gas Inventories method one and 2009 Statistical Review of China Energy about emission factors of different fuels , oxidation factors and low heating value ,we calculate carbon dioxide emission with the formula below:
In this formula:ECO2 is energy consumption carbon
dioxide emission ;
ADi is i type of energy consumption (tons of coal
equivalent);
EFi is i type of energy carbon dioxide emission
coefficient;
N is type of energy
4. Results and Analysis
4.1. The Results
According to the carbon emissions of Baoding electricity production sector, heating production sector, industrial sector, transportation sector and construction sector, we calculate the carbon emissions, which are shown in the table below:
Table 2. Baoding Total Carbon Dioxide Emissions from 2005 to 2010 unit: 10,000 tons
Year Electricity Heating Industry Transportation Buildings Total
2005 1005.2 187.3 1797.7 250.1 988.9 4229.2
2006 954.7 145.9 1829.1 285.2 1020.6 4235.5
2007 952.5 149.1 1910.8 329.0 1168.8 4510.1
2008 872.1 125.6 2078.0 376.8 1129.2 4581.8
2009 1107.9 123.7 2089.6 398.0 1156.0 4875.2
Figure 5. Changing trend of Baoding total Carbon Dioxide Emissions from 2005 to 2010
From Figure 5, you can see that the carbon dioxide emissions were growing slowly and there was not big rise. The growth slowed down gradually in a whole.
4.2. Analysis
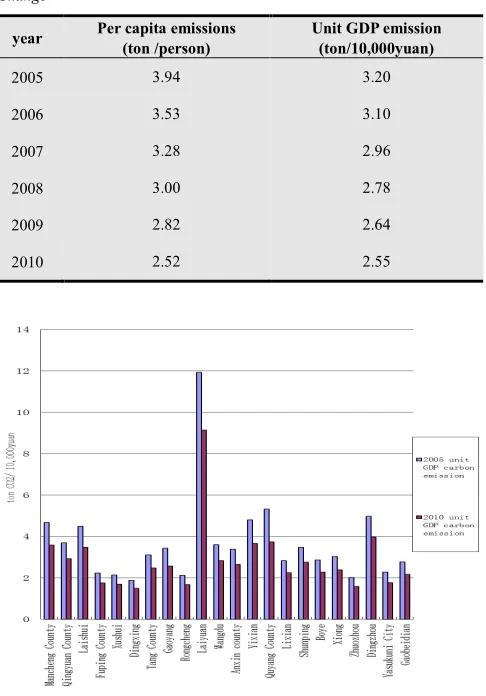
According to the calculation results above, we can obtain Baoding per capita carbon emission and unit GDP emission intensity from 2005 to 2010. The details are shown in Table 3.From it, we can find that the per capita carbon emission and carbon intensity have been reducing every year. It shows that Baoding is adjusting its industrial structure and reduces carbon emission and has achieved a good result in unit carbon emission.
Figure 6 shows Baoding GDP per unit carbon emission classified by districts and counties from 2005 to 2010, you can see that Baoding GDP per unit carbon emission classified by districts and counties in 2010 is less than it was in 2005 by comparing and analyzing. Among all, Baoding major carbon emission regions are Laiyuan, Quyang, Yi County, Dingzhou, Laishui and Mancheng, The GDP per unit carbon emission were over 4 ton /10,000yuan
in 2005. We can also find that the changing range in these areas is the most too, the reduction is obvious.
Table 3. Baoding per capita emissions 、unit Carbon emission intensity
Change
year Per capita emissions
(ton /person)
Unit GDP emission (ton/10,000yuan)
2005 3.94 3.20
2006 3.53 3.10
2007 3.28 2.96
2008 3.00 2.78
2009 2.82 2.64
2010 2.52 2.55
Figure 6. Baoding GDP per unit carbon emission classified by districts and counties from 2005 to 2010
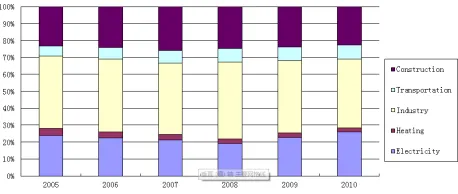
Table 4. Baoding carbon emissions and changing trend classified by sectors from 2005 to 2010
Industries
2005 2008 2010
Emission
(10,000 tons) proportion Emisions(10,000 tons) proportion Emisions(10,000tons) proportion
Electricity 1005.18 23.77% 872.11 19.03% 1343.65 26.02%
heating 187.33 4.43% 125.61 2.74% 121.71 2.36%
Industry 1797.71 42.51% 2078.01 45.35% 2102.44 40.72%
Transp-ortation 250.08 5.91% 376.83 8.22% 418.62 8.11%
construction 988.90 23.38% 1129.24 24.65% 1176.98 22.79%
Total 4229 4581.80 5163.40
From Table 3 and Figure 7 you can see, Baoding carbon emission proportion of building sector did not have a big difference during the period from 2005 to 2010, It had a growth before the fall in a small range, the proportion of transportation sector has been increasing, the carbon emission of industrial sector has been growing slowly but Its proportion has been reducing over the years after a
Figure 7. Baoding carbon emissions and changing trend classified by sectors from 2005 to 2010
5. Conclusion
In this paper, we calculate and analysis Baoding’s carbon emissions so that we can have a more in-depth understanding of Baoding GHG emissions. As one of the China's low-carbon city pilot cities, the research of Baoding’s carbon emission contributes to understand the trend of China’s carbon emission. From the results we got, some suggestions will be proposed for Baoding’s low-carbon urban construction.
1) For the electricity, heating and industrial in Baoding City, the government should optimize its structure, specially decrease the high pollution enterprises. Meanwhile, it also should strictly control the quantity and strength government support so that it will promote low carbon new technology. The most important is develop circular economy and improve energy sufficiency.
2) For the transportation, comparing with other domestic cities, Baoding’s comprehensive transportation system is still incomplete. We should improve our infrastructure by completing the road network, increasing public transportation as well as advocating low carbon commuting cooperating with transportation policy guiding measures.
3) For the construction, the government should promote the using of low-carbon material and low-carbon construction technology through the national policy support. At the same time, it is important to promote the ideas and awareness of low-carbon building.
Acknowledgements
The key projects of central university research in Education Ministry (ID:12ZX21): low-carbon urban construction monitoring and simulation optimization decision system research
References
[1] Zhang Renjian, Wang Mingxing, Zheng Xunhua, etc. Analysis of China’s Carbon Dioxide Emission Sources [J]. Climate and Environment Research, 2001, 6(3): 321-327. [2] Dhakal S. Urban energy use and carbon emissions from cities
in China and policy implications [J]. Energy Policy, 2009, 37(11): 4208-4219.
[3] Boswell M R, Greve A I, Seale T L. Greenhouse-gas Emissions Inventory [M]//Local Climate Action Planning. Island Press/Center for Resource Economics, 2012: 87-114.. [4] Zhang Renjian, Wang Mingxing, Zheng Xunhua, etc. Analysis of China’s Carbon Dioxide Emission Sources [J]. Climate and Environment Research, 2001, 6(3): 321-327. [5] Climate change 2007-the physical science basis: Working
group I contribution to the fourth assessment report of the IPCC[M]. Cambridge University Press, 2007.
[6] Qingyi W. Energy conservation as security[J]. China Security, 2006: 89-106.