Quantifying the Malaysian Brain Drain and an Investigation
of its Key Determinants
Gregory Foo* Harvard University
Abstract: The emigration of highly-skilled workers, more commonly known as the brain drain, has received substantial media coverage in Malaysia. The debate tends to focus on emigration numbers and the eventual effects of skilled migration on the Malaysian economy. There has, however, been no specific dataset developed on the stocks and flows of Malaysian-born migrants. Therefore this paper presents an estimate of the stocks and flows of Malaysian-born migrants in the world. This research also explores the key determinants of high-skilled migration specific to Malaysia, and finds that high income levels in destination countries, livability and religious diversity, proximity (shorter distances), and the English language are associated with higher emigration rates.
Keywords: Brain drain, determinants, Malaysia, skilled migration JEL classification: C10, J31, O15
1. Introduction
Beginning from the 1960s, the emigration of highly-skilled workers, more commonly referred to as the brain drain phenomenon, has been making global headlines and attracting the attention of academic researchers and government policymakers. In line with the approaches taken by Carrington and Detragiache (1998), and Docquier and Rapoport (2004; 2011), a high-skilled migrant can be defined as a foreign-born individual, aged 25 or above, holding an academic or professional diploma beyond high-school (post-secondary or tertiary educated). This paper deploys the original Carrington and Detragiache (1998) formulation as it is the definition most commonly used in the literature, as well as in the most recent World Bank Malaysian Economic Monitor, and hence would facilitate cross-study comparisons with the results of this study (World Bank 2011a).
Given global economic trends as well as advances in communications and low-cost travel, mobility is increasing and people are searching for employment opportunities in all corners of the world. From the World Bank’s Migration and Remittances Factbook, we see that the global migrant stock was approximately 215 million in 2010 (World Bank 2011b). In contrast, the United Nations estimated that there were 175 million migrants in the world as of 2000 (UN 2004). It seems as though the majority of these migrants go to Organization for Economic Cooperation and Development (OECD) countries. According to the Extended Database on Immigrants in OECD countries (Dumont et al. 2010), the total stock of migrants over 15 years of age is estimated at approximately 125 million (out of a total of 200 million), which confirms that the OECD is the most popular destination for international migrants.
As for highly-skilled migration rates, Docquier and Rapoport (2011) estimate that the world average rate of brain drain is about 5 per cent, while that of Malaysia was 10 per cent
*
in 2000. Comparing this with the highly-skilled migration rates for Malaysia (11.3 per cent in 2000) of Dumont et al. (2010), we see that there is broad agreement in the numbers, with any discrepancy likely arising from the age difference in the samples. That of Docquier and Rapoport’s (2011) was 25 years and above while that of Dumont et al. (2010) was 15 years and above. Another noteworthy point is that while Malaysia’s rate of brain drain (10 per cent) is higher than the world average (5 per cent), it is still less acute than other regional economies such as Singapore (14.5 per cent) and Hong Kong (29.6 per cent).
Throughout the last decade, the brain drain dilemma has received substantial media coverage in Malaysia. The debate tends to focus on emigration numbers and the eventual effects of skilled migration on the Malaysian economy. There has, however, been no specific dataset developed on the stocks and flows of Malaysian-born migrants, hence making it difficult to articulate a clear picture of the migration situation for Malaysia.
This paper revolves around two major themes: quantification and determination. Part one of the paper attempts to quantify the brain drain, detailing the method by which the Malaysian migrant database has been constructed. Part two of this paper proposes a simple model based on established models of international migration, and finds that high levels of income in destination countries, livability and religious diversity, proximity (shorter distances), and the English language are associated with higher migration rates. This second part also features relevant results from a survey of the Malaysian diaspora conducted as part of this research. Out of a population of 27.5 million, there are an estimated 1 million Malaysian-born migrants of all ages spread throughout the world. Looking specifically at those 25 years or older, the number drops to about 844,000. Of these, about 455,000 are highly-skilled ‘brains’ (having already completed tertiary education). Of the 194 migrants polled as part of this research paper, 70 per cent are not sure if they will return to Malaysia, while 80 per cent of them feel that their professional goals have been met through migration. Attitudes towards migration are generally pessimistic, and as migrants stay longer in their host countries, the stronger the social connections they make, the more property they purchase, the more children they have, and the less likely they are to return home to Malaysia.1
Looking at destination country characteristics, this study reveals that religious diversity, high Gross Domestic Product (GDP) per capita (adjusted for Purchasing Power Parity, PPP), proximity to home country, and English language usage are significantly associated with the brain drain out of Malaysia. In a separate model specification, it is found that livability, as proxied by the Economist Intelligence Unit (EIU’s) Quality of Life index, is also a significant explanatory variable. This issue of high-skilled migration has generated substantial interest and concern among Malaysians. Given the government’s commitment to elevate the country to high-income and developed status by 2020, the loss of skilled workers abroad is often perceived as a limiting factor to this aspiration. With Vision 2020 rapidly approaching,
Malaysia must embark on bold and broad-ranging reforms if it is to achieve this status. It is hoped that the data generated as part of this research will contribute to national policy debates and help set Malaysia on the path towards its 2020 goals.
2. Determinants of International Migration
Tracing the evolution of brain drain analyses, Bhagwati (1976), Grubel and Scott (1977), and Oh (1977) were among the earliest researchers to propose models to explain the key determinants of migration. Carrington and Detragiache (1998) offered pioneering work on migration to OECD countries, and were the first to define many of the key terms and ratios that researchers use today, including the concept of a ‘migration rate’ and the term ‘high-skilled migrant’. Beine et al. (2006), Docquier et al. (2009) and Dumont et al. (2010) then introduced interesting explanatory variables and discuss econometric issues within their models, all of which have been useful in thinking about the limitations of the model developed in this paper.
Beine et al. (2006) include a range of variables in their analysis, including GDP per capita, linguistic and cultural proximity, socio-political environment, and the size (geographic and demographic features) of the origin country. Research by Dumont et al. (2010) introduces other factors such as dummy variables for landlocked countries, armed conflicts and other common languages spoken between origin and destination countries. Straubhaar’s (2000) findings reinforce the determinants listed above, and also include quality of life, good weather, clean environment, safety, and freedom of choice as being very important to the highly skilled.
With regard to wage differentials across sending and receiving countries, in a widely cited paper on income maximisation by international migrants, Grogger and Hanson (2008) take bilateral migration data from OECD countries (based on an earlier dataset) and use wage and earnings distributions by skills and occupations (from the Luxembourg Income Survey for wages in OECD countries) to explain the twin effects of selection and sorting on high-skilled migration stocks. Relevant to the above discussion on wages is the sorting effect for which Grogger and Hanson (2008) show that the relative stock of high-skilled migrants increases with the earnings difference between high- and low-skilled workers. There is, unsurprisingly, a tendency for highly skilled migrants to locate in countries with high rewards to skills.
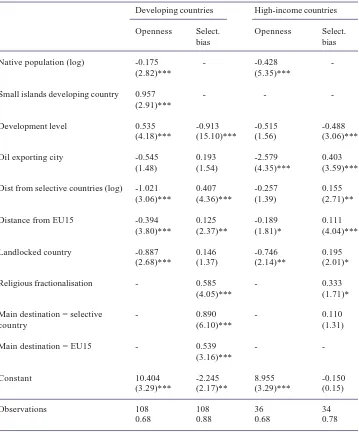
Table 1. Determinants of aggregate high-skill emigration rates
Developing countries High-income countries
Openness Select. Openness Select.
bias bias
Native population (log) -0.175 - -0.428
-(2.82)*** (5.35)***
Small islands developing country 0.957 - -
-(2.91)***
Development level 0.535 -0.913 -0.515 -0.488
(4.18)*** (15.10)*** (1.56) (3.06)***
Oil exporting city -0.545 0.193 -2.579 0.403
(1.48) (1.54) (4.35)*** (3.59)***
Dist from selective countries (log) -1.021 0.407 -0.257 0.155
(3.06)*** (4.36)*** (1.39) (2.71)**
Distance from EU15 -0.394 0.125 -0.189 0.111
(3.80)*** (2.37)** (1.81)* (4.04)***
Landlocked country -0.887 0.146 -0.746 0.195
(2.68)*** (1.37) (2.14)** (2.01)*
Religious fractionalisation - 0.585 - 0.333
(4.05)*** (1.71)*
Main destination = selective - 0.890 - 0.110
country (6.10)*** (1.31)
Main destination = EU15 - 0.539 -
-(3.16)***
Constant 10.404 -2.245 8.955 -0.150
(3.29)*** (2.17)** (3.29)*** (0.15)
Observations 108 108 36 34
0.68 0.88 0.68 0.78
Robust t statistics in parentheses; * significant at 10%; ** significant at 5%; *** significant at 1% Adapted from Docquier and Rapoport (2011: 12)
determinants were borrowed from Oh (1977), including prestige of studying or working in the host country, lack of similar training and facilities in the home country, increased job opportunities, and availability of grants and scholarships to study in the host country. Several of these determinants have been evaluated in another study on the migration of highly-skilled workers from Canada to the United States of America (Iqbal 2001). In particular, Iqbal (2001) reveals that the earnings gap in the various occupational categories and the tax burden gap between the two countries are highly statistically and economically significant as drivers of migration from Canada to the USA. There are also other factors at play, of course, including proximity and distance effects, language and cultural similarities, and shared histories. This is evident in the case of Malaysia and Singapore, where travel via causeway bridges enhances mobility for both high- and low-skilled workers.
3. Quantifying the Malaysian Brain Drain
Given the complexities of the brain drain, efforts to define, quantify, model and generate determinants for this phenomenon are always contested. For instance, in definitional terms, all foreign-born individuals with tertiary education are automatically considered part of the brain drain. One must question, however, where these individuals were actually educated. If migrants arrive after having received their education at home, then this is a more serious phenomenon because the home country has spent resources educating these individuals, but are not able to reap the dividends of their investment in human capital. One should also consider that these foreign-born individuals are represented as ‘brain drain’ independent of what they are actually doing (productive or otherwise) in the receiving country.
Another problem relates to consistency in the practices of various destination countries when it comes to collecting census data. Some countries ask for country of birth, while others ask for country of citizenship. This complicates efforts to compare numbers across countries and also across years, for instance in Singapore where authorities switched from collecting country of citizenship to country of birth data from the 1990 census onwards. Finally, return migration poses a significant challenge to researchers. Owing primarily to privacy reasons and capacity, most countries, including Malaysia, do not keep detailed records of citizens who return after prolonged absences. Immigration data is available; however, calculating a net migrant brain drain (or gain) for Malaysia is beyond the scope of this exercise.
bilateral migration data in two steps.2 First, using the census data on bilateral migration that
is already available (195 x 76 data points3 in 2000, and 195 x 61 data points in 1990), they
perform eight separate Poisson regressions4 using the specification below to obtain estimates
on the determinants specified below (i.e. the various coefficients ). Second, using these estimates and with existing data on destination characteristics and country fixed effects, the rest of the ‘missing data’ (i.e. the 195 x 119 in 2000 and 195 x 134 in 1990) can be filled up by plugging in the various data5 for destination country characteristics d, A, and
estimates obtained from the 8 regressions stored in α, to obtain represents the stock of migrants from country i to country j at time t and of skill or gender combination g, where
g={high, low} x {male, female} (for a total of 4 combinations), and then estimating the stock of emigrants of a given skill level (in this case, h) from a given country j at time t as:
Once this 195 x 195 bilateral matrix has been filled up, which Docquier et al. (2010) have already done, it is then a simple matter of extracting the 1 x 195 (Malaysia x Rest of the World) data for use as below.
In building the dataset for Malaysia-born highly-skilled migrants, one can start with hard-coded census data from 1990 and 2000, and then fill it with assumptions where there are gaps. In order to generate high estimates, four key datasets were used to estimate the stock of high-skilled migrants: the University of Sussex Migration Development Research Centre (MDRC) bilateral migration dataset of 226 countries, the World Bank data based on Parsons et al. (2007)6, the Docquier et al. (2010) dataset based on 25+ year old highly-skilled
migrants with gender data, and the recently released OECD study by Dumont et al. (2010) on migrants into 89 countries, including all OECD and several key non-OECD receiving countries.
This subsection starts with the Malaysian emigration numbers for 2000 as compiled in the Parsons et al. (2007) dataset, which estimates the stock of Malaysian-born migrants to be 784,900. This global figure is broken down into the remaining 225 countries that comprise the Parsons bilateral migration dataset. Since the top six OECD countries together with Brunei, India, Indonesia, Philippines and Singapore account for 80 per cent of the 784,900 migrants from Malaysia, these countries constitute a logical choice on which to test the
2 For example, Lithuania may not ask for country of birth for migrants living in Lithuania. There is
therefore no bilateral data for the Lithuania x Malaysia corridor. This is called a bilateral data gap. 3 For example, from the United Kingdom 2000 Census, we can extract the number of high-skilled
Malaysian-born migrant women above the age of 25. This number will be one data point in the 195x76 bilateral matrix.
4 Based on the characteristics of t={1990,2000}, g={high,low}x{male,female}, i.e. 2x2x2=8
combinations.
5 Bilateral (country level) fixed effects were not used in predicting missing data (Docquier et al. 2010: 12).
proposed model. The remaining 149,766 migrants are put into a catch-all category called the ‘Rest of the World’. After populating these numbers for 2000, the same is then done for 1980, 1990 and 2010 with as much data directly extracted from national population census as well. For example, the 41,900 Malaysian-born migrants in Brunei in 1990 was a statistic taken from the UN migration database, which keeps records of population data from national census returns that come in every 10 years.
With the 1990 and 2000 numbers for the OECD, Brunei, India, Indonesia, Philippines and Singapore in place, the intervening years (1991–1999) were interpolated using a constant growth assumption. As for estimates for 1980 and 2010, the OECD and Singapore had records for migrant stocks of Malaysian-born migrants. For the Philippines and Indonesia, however, census data for these two points in time were unavailable. Therefore, the stock of migrants was estimated by extrapolating from the available numbers from 1990 and 2000, using growth rates calculated by the UN Department of Economic and Social Affairs Population Division.7
In order to fill in the years preceding 1990 and following 2000, the migrant numbers were interpolated again, using the overall growth rates provided by the UN. The .15/.24 scale factor in Dumont et al. (2010) was used to estimate the selection rate in non OECD countries.8 Finally, to obtain a dataset comparable with Ozden et al. (2011), the Parsons et al. (2007) numbers were scaled down (which are for migrants of all ages) in the same ratio as the 25+/0+ year ratio for Malaysian migrants in that destination country. For example, the ratio of 25+/0+ migrants in Singapore is higher than that in the OECD (90.83 per cent versus 79.26 per cent), reflecting perhaps the fewer number of Malaysian children or families in Singapore due to the relatively faster pace of life or competitive schooling environment.
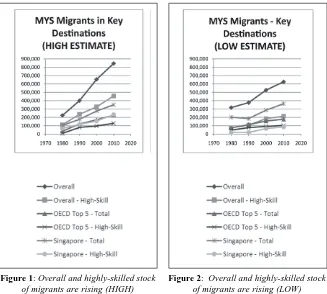
Fortunately, with regard to the generation of low estimates, the Ozden et al. (2011) dataset already has hard coded data for 1990 and 2000 (see explanation in 3.1, Figures 1 and 2) for migrants aged 25+ broken down into high- and low-skill. There is therefore no need to make onerous assumptions on the selection rates for the Parsons et al. (2007) dataset. In order to extrapolate backwards to 1980, the same 25+/0+ ratio was used for 2000 and imposed on the overall Parsons et al. (2007) data so as to obtain the migrant stock of the 25+ age group in 1980. Then, to obtain the high- and low-skill breakdowns, the skill breakdown from the nearest time period was used (in this case 1990) to calculate the skill breakdown for 1980. To extrapolate forward to 2010, as census data for 2010 is not yet available in many countries, the available data for Singapore and Australia are used, assuming no growth for the other key destinations. To obtain the high- and low-skill breakdowns, the skill breakdown for the nearest time period was used, in this case the year 2000. The full list of assumptions is presented in Appendix B.
7 This assumes that the number of Malaysian migrants to the Philippines, for instance, grows in the
same rate as the overall stock of migrants in the Philippines, as estimated by the UN. In the absence of more specific data, this assumption will have to suffice.
3.1 Presentation of Results
A close examination of the low estimates dataset in the figures above yields three key conclusions: (1) there is a clear upward trend of overall migrant stock and high-skilled migrants; (2) Singapore accounts for one out of every three high-skilled migrant who decides to leave Malaysia; and (3) these figures are much lower than expected. However, it is true that the upward trend is in line with expectations that, as Malaysia becomes increasingly open to the global economy, more of its residents will seek opportunities outside of Malaysia. These numbers also seem to indicate that the brain drain is not as acute as believed, with the number of high-skilled migrants numbering 214,245 instead of upwards of 1 million which some political commentators in Malaysia have claimed. That Singapore accounts for one out of every three highly-skilled migrant who decides to leave Malaysia should not come as a surprise, given the close historical and geographical links that both countries share. Furthermore, the targeted courting of Malaysia’s best and brightest with promises of full scholarships and attractive career prospects by the Singaporean education system would explain in part the popularity of Singapore as a migration destination.
3.2 Comparison with Other Countries
In order gauge the extent and intensity of the brain drain in Malaysia, it is helpful to draw comparisons with regional neighbours such as Australia, Indonesia and Singapore. Looking
Figure 1: Overall and highly-skilled stock of migrants are rising (HIGH)
at the skilled migration rate calculated by Docquier et al. (2009) for OECD countries, Singapore comes in the highest at 14.5 per cent, with Australia and Indonesia having far lower skill migration rates of 2.7 per cent and 2.9 per cent respectively.9 The corresponding rate for
Malaysia is 10.5 per cent.
Cross-country comparisons from the Extended Database on Immigrants in OECD countries yield similar conclusions.10 Singapore suffers the highest rate of brain drain at
12.9 per cent, with Malaysia at 11.3 per cent, followed again by Australia and Indonesia at 2.5 per cent and 1.8 per cent respectively. What are the implications for Malaysia? By comparison, Australia and Indonesia do not seem to have an acute problem with skilled migration. Malaysia does share some similarities in terms of the access to natural resources and level of human capital. It is noteworthy, however, that of the approximately 1.3 million foreign-born migrants living in Malaysia, nearly 600,000 of them are from Indonesia, and less than 1.5 per cent of these 600,000 are high-skilled. Hence, what Malaysia seems to be losing in terms of high-skilled workers, it seems to be receiving from Indonesia as low-skilled labourers.
Finally, comparisons with small, open economies like Singapore and Hong Kong might be the most intriguing since such economies have traditionally wrestled with the issue of brain drain (Docquier et al. 2009; Dumont et al. 2010). Indeed, these two studies estimate Singapore’s rate of brain drain to be between 12 per cent and 15 per cent, while Hong Kong’s rate is more pronounced at between 16.8 per cent and 29.6 per cent. Despite such high rates of brain drain and the propensity towards out-migration, Singapore and Hong Kong do not seem to have difficulty attracting a broad range of local and foreign talent back ‘home’ to work.
4. Modelling the Determinants of Skilled Migration
This subsection focuses on the key reasons for the loss of skilled workers from Malaysia. Again, there is much anecdotal evidence that points to the classic push and pull factors as discussed in the literature, including GDP per capita, geographical and cultural proximity. Results from an online survey conducted for this paper suggest that there are other significant drivers such as economic opportunities outside of Malaysia, livability factors such as safety and security, race-based affirmative action policies, and the significant opportunity cost in real wage terms of staying in Malaysia (New York Times 2010; The Straits Times 2010). One respondent from the local business community was quoted as follows: ‘I can earn 30,000 Euro as a master welder in Germany. Why would I want to come back to Malaysia and earn MYR 24,000 for the same job’?
There is, however, a dearth of quantitative data specifically for Malaysia. Therefore this paper attempts to draw some preliminary conclusions from the relationships which may exist between the stock of skilled Malaysian-born migrants in a given country and the specific characteristics which may affect migrant decisions to leave Malaysia for that country.
9 The Docquier et al.(2009) dataset is based on census and survey reports from OECD countries only. 10Expanding on this dataset to include more destination countries, Dumont et al. (2010) incorporated
Unfortunately, due to the small sample size and lack of time series data for bilateral migrant stocks, this study cannot provide a robust quantitative analysis of the various determinants of skilled migration for Malaysia. Instead, where appropriate, it will supplement the results with qualitative data from an online survey made available to Malaysian-born migrants from 14 February to 6 March 2011.
Having considered the existing literature and models generated by Grubel and Scott (1977), Carrington and Detragiache (1998), Doquier et al. (2007), Dumont et al. (2010), and Docquier et al. (2010), this study hypothesises the following for the high-skilled migration rate for Malaysia:11
where:
11There are subtle differences between the high-skilled migration rate defined in Docquier et al.(2007), in Docquier and Rapoport (2010), and the rate used in this study, which is defined for each destination country that Malaysian migrants go, whereas the migration rate used in the literature is an overall rate
for a given source country. If you sum all the for i∈[1;225], you will get the overall high-skill
Three of the determinants merit further explanation. The first is Disti, for which the values for weighted distance of country i from Malaysia are taken from the Centre d’Études Prospectives et d’Informations Internationales (CEPII), which is consistent with the data used by Docquier et al. (2009) in their study on the determinants of high-skilled migrants across countries in general. This distance is a population-weighted bilateral distance based on a gravity model that uses the population sizes of the biggest cities in the two countries being measured. The basic idea here is that the closer Kuala Lumpur is to the biggest cities in country i, the smaller the weighted distance between Malaysia and country i.
The second determinant is Livabilityi, which is the difference between the Quality of Life Index (QLI) score for country i and that of Malaysia.12 The Economist Intelligence
Unit’s QLI was released in 2005, and was calculated using data from 111 countries. In the 2005 ranking, Ireland came first with a score of 8.333, while Zimbabwe came in last with a score of 3.892. Malaysia was ranked 36th with a score of 6.608. The Quality of Life score ranges from 1 to 10 and is calculated with various components and weights, including material well-being, health and family relations. By construction, the QLI includes an 18.8 per cent GDP per capita adjusted for purchasing power parity (PPP) component, and will therefore be significantly collinear with GDP per capita PPP data. This will introduce complications in the fully specified model as we will see shortly.
The third determinant is Religious Diversityi. This measure is taken from Alesina et al.
(2002), and ranges from 0 per cent (no diversity) to 100 per cent (full diversity) based on the
formula, , where N is the number of ‘religious fractions’ (or
categories) for a given country j. This model essentially performs a cross-country comparison using the 67 destination countries with the highest number of Malaysian-born migrants. It attempts to explain an individual’s decision to migrate out of Malaysia. The table in the previous page summarises the key descriptive statistics of the regression and five explanatory variables used in this specification.
4.1 Presentation of Results: Key Determinants
As indicated in the results from Appendix C, only some combinations of explanatory variables are robust. When the entire model is specified, the coefficients on ?income, political risk and religious diversity lose their statistical significance. This is most likely due to collinearity between GDP per capita and quality of life. Indeed, the pair-wise correlations between the three variables are high, at about 80 to 85 per cent, hence severely reducing their explanatory power (see Appendix C). The two best specifications, with GDP per capita and quality of life omitted in Models #2 and #1 respectively, are also given in Appendix C.
As indicated in the table of results from Appendix C, the coefficients on GDP per capita adjusted for PPP, distance, and common English language are all in the expected direction, and statistically significant at the 10 per cent level or better, while the coefficient on the religious diversity ratio had a 21 per cent level of significance for Model #1 and a 11 per cent level for Model #2. A 10 per cent level of significance for a given determinant such as GDP
per capita can be approximately taken to mean that there is a 10 per cent chance that the results we observed between the high-skilled migration rate and GDP per capita were due to random error. In other words, the relationship found between the high-skilled migration rate and GDP per capita, holding the other proposed determinants constant, are quite significant. What do these coefficients mean? Taking Model #1 from Appendix C as an example, a coefficient on GDP per capita of +0.00182 means that a 1 per cent increase in the ratio of GDP per capita of a destination country to that of Malaysia is associated with a 0.182 per cent point increase in the rate of migration for high-skilled individuals born in Malaysia. To give another example using Model #2, a 0.00298 coefficient on quality of life means that a 1 point increase in the Economist Intelligent Unit’s QLI of a destination country is associated with a 0.298 per cent point increase in the rate of migration for high-skilled individuals born in Malaysia.13
While these two models only give an approximate feel for the relative effects of a given determinant, they are helpful to policymakers who may need a sense of the effects of a policy lever on the high-skilled migration rate, and hence where to prioritise resources. For example, the models seem to suggest an equivalent effect for a 1 per cent increase in the relative GDP per capita between a destination country and Malaysia, and for a 1 point increase in the quality of life gap between Malaysia and country i. By further noting that the QLI actually includes a GDP per capita component, weighted at 18.8 per cent, policy analysts can begin to derive measures for the relative costs and benefits of policies that target GDP per capita growth vis-à-vis those related to quality of life measures such as social and community activities, gender equality, and family relations, which may be less costly in GDP per capita terms.
There remain, however, several contentious issues with this specification. For instance, there may not be sufficient cross-country variation to pick up an individual migrant’s decision to migrate. For example, it makes little sense to compare the migration rate to the Seychelles (02 x Malaysian migrants in 2000) to that of Honduras (04 x Malaysian migrants in 2000). There is also a lack of time series data (only year 2000 data is available) which has an implication on the actual effect that the regression is picking up, which is most likely a lagging indicator of a decision to migrate that was made before 2000. Another shortcoming is the fact that there are a small number of observations (N=67). Many data points were dropped because they did not have data for all five explanatory variables.
Empirical studies use various models to estimate relationships between variables and high-skill migration rates. Logit regressions, OLS, Poisson, and Heckman models all appear in various studies. The main concerns that researchers try to address are the many zeroes for many country pairs (e.g. Malaysia does not send migrants to all 200+ countries in the world), for which it is argued OLS and log-linearised models give biased estimates. The other concern is that migration follows essentially a gravity model, which means that migrant stocks do not vary linearly with distance.14 There may be endogeneity within QLI
specification in that there may be a third variable affecting all the QLI components that is not modelled above and also affects the high-skilled migrant stock.
13Based on the 2005 QLI ranking, a 1-point jump is equivalent to comparing the quality of life between Germany (7.048) and Bahrain (6.035), or taking another example, comparing Singapore (7.719) to Mexico (6.766).
This study does not attempt to address all of these issues. Indeed, the idea behind this econometric analysis is not to establish causality, but to explore, specifically for the Malaysia-Rest of the World corridor, the relative effects of the proposed determinants on the high-skilled migration rate. Overall, and in spite of the questions raised above, the model does find estimates that are in the correct direction and statistically significant. There is additional support from the online survey results, as well as empirically in the literature on global brain drain, which strengthens the case for income, livability, and religious diversity as key drivers of high-skilled migration.
5. Selected Survey Results and Fieldwork
In order to supplement the quantitative analysis already carried out, a survey was designed to provide additional evidence by investigating the opinions of Malaysians based overseas about the brain drain. The survey was administered online and disseminated via the author’s network of Malaysian migrants. It received 194 responses over a period of three weeks 14 February to 6 March 2011. It is important to note that this survey was not designed to reach a representative sample of Malaysian migrants, but rather to provide a more human dimension to the hard data that most of this paper has been based on up to this point (see Appendix D for full survey findings).
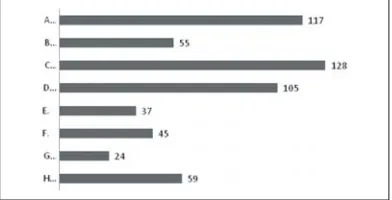
One of the most telling statistics concerning the key determinants of the brain drain emerged from the following question, where respondents were asked to pick three of the following eight possible determinants of brain drain, including a free-text entry category where respondents could propose any other determinant of skilled migration:
A. Sense of social injustice
B. Lack of general safety and security C. Better career prospects overseas D. More attractive salary/benefits overseas
E. Further studies, with the intention/obligation of returning to Malaysia F. Unsure political situation in Malaysia
G. Poor livability conditions in Malaysia
H. Further studies, with the intention of permanent emigration
Reasons C and D accounted for 105+128 selections, which suggest that better career prospects and more attractive salary or benefits, which are both linked to income and hence GDP per capita, are indeed key drivers of the rate of high-skilled migration. This strong association is also borne out in the coefficient for ln (relative GDP per capita at PPP) calculated in the econometric analysis. Figure 3 below shows all rankings for key determinants.
Another revealing attitude can be observed in the following set of questions:
Q2.4 shows that almost half of the Malaysians based overseas who responded to the survey felt a strong sense of attachment to their country, with another 20 per cent undecided. This seems to suggest that many Malaysians remain connected to home even though they are living or studying abroad. This is a good sign and it shows that Malaysians have not given up on returning at some stage. This sentiment is echoed by one interviewee, who commented that she ‘never really felt [she] belonged in the UK’. On the other hand, the following question seems to suggest a great level of comfort in their current country of residence:
While Q2.1 demonstrates that high-skilled migrants have generally been successful in their pursuits outside of Malaysia, it reveals a more challenging question that the Malaysian government will need to address when thinking about luring its talented nationals back home: leveraging and strengthening existing ties enough to tip the balance in favour of return migration. Shifting to a different theme, attitudes towards re-migration and factors which may lead Malaysian migrants to return home are also explored:
Q2.4 I feel a strong sense of patriotism for, and / or emotional
attachment to, Malaysia
Q2.1 My professional goals have been met through migration out
of Malaysia
Q2.3 I intend to return to Malaysia for good at some point
Cutting the data a different way, how do the numbers change if we look just at the Chinese Malaysians who answered Q2.3 and Q2.4? Intuitively, and based on widespread stereotypes, one may assume that Chinese Malaysians would be less inclined to return to Malaysia. The results of Q2.3a suggest otherwise, showing that Chinese Malaysians are still open to returning home, and are perhaps biding their time, adopting a ‘wait and see’ approach, hence the high level of uncertainty in their responses.
In a similar way, the diagram for Q2.4 indicates that among the Chinese Malaysians who responded to the survey, about 43 per cent felt a strong sense of patriotism or emotion for Malaysia, with another 18 per cent unsure. Taken together, it suggests that these migrants still remain connected to their country of birth, and that economic rationality must be coupled with an appreciation for emotional responses and impulses. While these statistics deserve further study and confirmation, they do provide some evidence for policy intervention.
One online survey respondent confided that ‘migrants such as me would like to return to contribute to Malaysia, but I often feel that I am not wanted’. A final insight drawn from the survey results is the time window that migrants have when thinking about remigration. Indeed, as the age of respondents increases, the number of positive (‘Strongly Agree’ or ‘Agree’) responses decreases, while the number of uncertain or negative responses clearly increases.
6. Conclusion
As one survey respondent noted: ‘a lot of my extended family (all from Sabah) now live in Singapore, Australia or New Zealand. The migration is not just limited to skilled workers seeking better job opportunities outside the country; some of them leave simply for a better quality of living’. Clearly, Malaysia is at a unique moment in its history. There is a broad
Q2.3a I intend to return to Malaysia for good at some point in my life
realisation that the country must move in a new direction. Malaysia should build momentum for change by embracing the ebb and flow of high-skilled workers, and compete for the global talent pool. Malaysia lies in the heart of a very economically vibrant region with an awakened China to the north, a rapidly transforming India to the west and resource-rich Australia and Indonesia to the south. Each of these countries is in need of high-skilled workers. If Malaysia does not enter the market for global talent, whatever remaining stock of highly-skilled workers it has will likely continue to drain out to or be captured by competitors. There is therefore a need for Malaysia to do more to attract highly mobile skilled professionals in critical economic sectors. The recent creation of Talent Corporation is an indication that the Malaysian government is seeking to devise an integrated strategy to reverse the brain drain.
As the model specified in 4.1 suggests, livability and wages differentials are significant drivers of emigration. Setting aside the econometric issues discussed earlier, the model proposed in this study indicates a statistically and economically significant association between the rate of Malaysian-born high-skilled workers and quality of life (which includes a GDP per capita at PPP component weighted at 18.8 per cent). As shown earlier, a 1 point increase in the Economist Intelligence Unit QLI in a destination country is associated with a 0.3 per cent point increase in the rate of high-skilled migration. With a base of slightly more than 11 million high-skilled Malaysian-born workers aged 25 years or older, 0.3 percentage points corresponds to 33,000 more high-skilled workers being drawn away from Malaysia. Malaysians are impatient for change. The 2008 general elections saw the ruling Barisan Nasional (National Front), led by incumbent and then-Prime Minister Abdullah Badawi, lose its two-thirds majority of seats in the Dewan Rakyat (House of Representatives).15 The
dominant-party rule in Malaysia continues to give way to a more politically diverse landscape. There now exists a unique opportunity for the Malaysian people, under the leadership of current Prime Minister Najib Razak, to effect broad ranging reform in the social and political landscape of Malaysia.
References
Beine, M., F. Docquier and H. Rapoport. 2001. Brain drain and economic growth: theory and evidence. Journal of Development Economics64(1): 275–289.
Beine, M., F. Docquier and M. Schiff. 2006. Brain drain and its determinants: a major issue for small states. Paper presented at the World Bank Conference on Small States, Growth Challenges and Development Solutions, Washington, D.C., 7–8 December 2007.
Carrington, W.J. and E. Detragiache. 1998. How Big is the Brain Drain? IMF Working Paper No. 98/ 102. Washington, D.C.: International Monetary Fund.
Docquier, F. and A. Marfouk. 2006. International migration by education attainment (1990-2000). In International Migration, Remittances and the Brain Drain, ed. C. Ozden and M. Schiff, pp. 151–200. New York: Palgrave Macmillan.
Docquier, F., O.L. Lohest and A. Marfouk. 2007. Brain drain in developing countries. World Bank Economic Review21(2): 193–218.
Docquier, F., L.B. Lowell and A. Marfouk. 2009. A gendered assessment of highly skilled emigration. Population and Development Review35(2): 297–321.
Docquier, F., A. Marfouk, Ç. Özden, and C. Parsons. 2010. Geographic, Gender and Skill Structure of International Migration. Economic Research Forum Report. 22 November 2010.
Docquier, F. and H. Rapoport. 1999. Fuite des Cerveaux et Formation de Capital Humain. Economie Internationale78(3): 63–71.
Docquier, F. and H. Rapoport. 2004. Skilled Migration: The Perspective of Developing Countries. World Bank Policy Research Working Paper No. 3382. Washington, D.C: The World Bank. Docquier, F. and H. Rapoport. 2011. Globalization, Brain Drain and Development. Centre for
Research and Analysis of Migration (CReAM) Discussion Paper Series No. 1108. London: University College London.
Dumont, J-C., G. Spielvogel and S. Widmaier. 2010. International Migrants in Developed, Emerging and Developing Countries: An Extended Profile. OECD Social, Employment and Migration Working Papers No.11. Available at: www.oecd.org/els/workingpapers.
Economist. 2005. The World in 2005. Economist Intelligence Unit Quality-of-Life Index. Available at http://www.economist.com/media/pdf/quality_of_life.pdf.
Grogger, J. and G.H. Hanson. 2008. Income Maximisation and the Selection and Sorting of International Migrants. NBER Working Paper No. 13821. Cambridge, MA: National Bureau of Economic Research.
Grubel, H.G. and A. Scott. 1977. The Brain Drain: Determinants, Measurement and Welfare Effects. Waterloo: Wilfrid Laurier University Press.
Iqbal, M. 2001. The migration of high-skilled workers from Canada to the United States: the economic basis of the brain drain. In The International Migration of the Highly Skilled – Demand, Supply, and Development Consequences in Sending and Receiving Countries, ed. A.C. Wayne, T. J. Espenshade and I. Salehyan, pp. 291–323. San Diego: University of California.
Lucas, R.E.B. 2008. The Malaysian Diaspora. Mimeo. Massachusetts: Boston University. New York Times. 2010. Loss of young talent thwarts Malaysia’s growth. The New York Times 10
October 2010.
Oh, T.K. 1977. The Asian Brain Drain: A Factual and Causal Analysis. San Francisco: R&E Research Associates.
Ozden, C., C.R. Parsons, M. Schiff and T.L. Walmsley. 2011. Where on earth is everybody? The evolution of global bilateral migration 1960–2000. The World Bank Economic Review25(1): 12– 56.
Parsons, C.R., R. Skeldon, T.L. Walmsley and L.A. Winters. 2007. Quantifying International Migration: A Database of Bilateral Migrant Stocks. World Bank Policy Research Working Paper No. 4165. Washington, D.C.: The World Bank.
Sjaastad, L.A. 1962. Costs and returns of human migration. The Journal of Political Economy70(5): 80–93.
Straubhaar, T. 2000. International Mobility of the Highly Skilled: Brain Gain, Brain Drain or Brain Exchange. HWWA Discussion Paper No. 88. Hamburg Institute of International Economics. The Straits Times. 2010. UMNO and the average Malays. The Straits Times, 1 June 2010. World Bank. 2011a. Malaysia Economic Monitor–Brain Drain. Bangkok: The World Bank. World Bank. 2011b. Migration and Remittances Factbook, 2nd ed.,Washington, D.C.: The World
Bank.
Appendix A: The Malaysian Migrant Dataset (1980–2010)
Appendix B: Assumptions Used in the Construction of the High-Skilled Migration Dataset
Low Estimates
Appendix C: Key Output from Econometric Analysis
Descriptive Statistics
Pair-Wise Correlations for Key RHS Variables
LHS Variable: High-skilled Migration Rate
In this segment of the survey, respondents who reported they were not migrants (i.e. plan to be abroad for less than 1 year or still living in Malaysia) answered this set of questions:
Q2.2b I will leave Malaysia even if it means getting a job below my level of educational qualification. Q2.3b I am planning to leave Malaysia primarily for my child’s or children’s future.
Q2.4b I feel a strong sense of patriotism for, and / or emotional attachment to, Malaysia. Q2.5b Neither push nor pull factors are sufficient reason for me to emigrate to another country. Q2.6b I view remittances as an important means for migrants to participate in the Malaysian
economy.