This article is published under the terms of the Creative Commons Attribution License 4.0 Author(s) retain the copyright of this article. Publication rights with Alkhaer Publications. Published at: http://www.ijsciences.com/pub/issue/2015-06/
Article Number: V4201506719; Online ISSN: 2305-3925; Print ISSN: 2410-4477
Gérrard Eddy Jai Poinern (Correspondence)
[email protected]
+61 8 9360-2892, Fax: +61 8 9360-6183Biogenic Synthesis of Gold and Silver
Nanoparticles using the Leaf Extract from
Eucalyptus Macrocarpa
Monaliben Shah
1
, Gérrard Eddy Jai Poinern
1
, Shasi B Sharma
2
,
Derek Fawcett
1
1Murdoch Applied Nanotechnology Research Group. Department of Physics, Energy Studies and Nanotechnology,
School of Engineering and Energy, Murdoch University, Murdoch, Western Australia 6150, Australia.
2Biosecurity and Food Security Academy, School of Veterinary and Life Sciences, Agricultural Sciences Murdoch
University, Murdoch, Western Australia 6150, Australia
Abstract: The present work presents the results of a straightforward, no-toxic and eco-friendly process for the green synthesis of gold and silver nanoparticles using the leaf extract from Eucalyptus macrocarpa. The process was conducted at room temperature (24 °C) with the leaf extract acting as both reducing agent and stabilising agent. Particle formation was monitored during synthesis using UV-visible spectroscopy. X-ray diffraction analysis and Energy Dispersive Spectroscopy (EDS) confirmed the presence of metal nanoparticles. While transmission electron microscopy (TEM) and field emission scanning electron microscopy (FESEM) were used to determine and confirm particle size and morphology.
Keywords: gold, silver, nanoparticles, green biosynthesis
1. Introduction
In recent years, Gold (Au) and Silver (Ag) nanoparticles with well-defined size, shape and surface morphology have attracted a considerable amount of interest in fields such as medicine, materials science and optoelectronics [1-4]. The chemical, physical, optical and electronic properties of nanoparticles are directly influenced by their size, shape and surface morphology [5]. A wide range of physicochemical procedures has been used to produce nanoparticles with different compositions, sizes and morphologies [6]. However, their manufacture is generally expensive and often employs the use of hazardous solvents and a further complication arises from the use of potentially toxic surface capping agents, (e.g. tri-n-octylphosphine oxide) to prevent nanoparticle aggregation [7]. Currently there is a need to significantly reduce or completely eliminate the use of toxic and environmentally damaging materials in the synthesis of nanoparticles. Developing green chemistry based techniques via biological systems such plants, bacteria, fungus and similar organisms offer a reliable and eco-friendly processes for the green synthesis of nanoparticles [8-11].
http://www.ijSciences.com Volume 4 – June 2015 (06)
28
The present study investigates the plant-mediated synthesis of Au and Ag nanoparticles at room temperature via leaf extracts taken from Eucalyptus macrocarpa as seen in Figure 1 (b). The indigenous Australian plant is also known as the Rose of the West or the Mottlecah, The silvery coloured leaves produce an extract that was found to act as both reducing agent and stabilising agent during the synthesis process. The formation of Au and Ag nanoparticles was monitored during synthesis using UV-visible spectroscopy. X-ray diffraction analysis and Energy Dispersive Spectroscopy (EDS) confirmed the presence of Au and Ag nanoparticles. While transmission electron microscopy (TEM) and field emission scanning electron microscopy (FESEM) were used to determine particle size and morphology.
2. Materials and methods 2.1. Materials
In this study, the source of Au+ ions was derived from
gold chloride [HAuCl4, (99.99%)] and the Ag+ ions
were derived from silver nitrate solution [AgNO3,
(99.99%)]. All chemicals were purchased from Sig-ma-Aldrich (Castle Hill, NSW, Australia) and used as supplied without any further purification. Milli-Q®
water was used in all aqueous solutions used in the synthesis of nanoparticles and was produced by a Barnstead Ultrapure Water System D11931 (Thermo Scientific Dubuque IA 18.3 MΩ cm-1).
2.2. Harvesting Eucalyptus leaf extract
A wide selection of healthy leaves free from damage were harvested from various locations on each plant from the local campus. Generally, 5 locations were selected (top, north, south, east and west) and on average 10 leaves were taken from each location. Leaves were washed several times with Milli-Q®
water to remove surface contamination. After cleaning, 10 g of Mottlecah leaves were finely cut into small strips and placed into a blending bowl containing 100 mL of Milli-Q® water. The mixture
was homogenized at 5000 rpm for 10 min at a room temperature (24 °C) using an IKA® T25 Digital Ultra-Turrax® Homogenizer. The homogenized solution was then filtered using a Hirsch funnel to re-move leaf debris. Two further filtrations using a 0.22 µm Millex® (33 mm Dia.) syringe filter unit were
carried out before the leaf extract was transferred to clean glass vials ready for nanoparticle synthesis.
2.3. Biosynthesis of nanoparticles
In general, biological reduction of a 1.0 mL solution of metal ion source solution was investigated using 3 solutions with varying amounts of leaf extract. In the case of Au, a 1.0 mL solution of 10 mM aqueous AuCl4ˉ ion solution was added to three leaf extracts
solutions in the quantities of 1 mL for g1, 2 mL for g2 and 3 mL for g3. While in the case of Ag, a 1.0 mL solution of 1 mM AgNO3 ion solution was added
to three leaf extracts solutions in the quantities of 1 mL for s1, 2 mL for s2 and 3 mL for s3. Once each respective metal ion source was added to each respective leaf extract, the solutions were then vigorously stirred for 1 minute. The reduction process was allowed to proceed at room temperature (24 ˚C).
2.4. Characterisation of nanoparticles
All samples were examined and analysed using the following five advanced characterisation techniques. UV-visible spectrum analysis typically consisted of three controls: 1) Milli-Q® water; 2) pure metal ion
source solution; and 3) pre-filtered pure leaf extract (filtered twice, each time using a new Whatman 0.22µm syringe filter). The two sets of test solutions consisted of the three Au colloids [g1, g2 and g3] and three Ag colloids s1, s2 and s3. The respective UV-visible spectra of each sample was then measured using a Varian Cary 50 series UV-Visible spectrophotometer V3, over a spectral range from 200 to 800 nm, with a 1 nm resolution at room temperature of 24 °C. XRD samples were extracted from each glass vial using a clean glass pipette fitted with a rubber bulb. Two to three drops of each sample were dispersed on a glass microscope slide and dried under vacuum for a period of 4 hours. The sample were then characterised using XRD spectroscopy. The XRD spectra were recorded at room temperature (22 °C), using a Bruker D8 series diffractometer [Cu Kα = 1.5406 Å radiation source] operating at 40 kV and 30 mA. The diffraction patterns were collected over a 2θ range from 15° to 80° with an incremental step size of 0.04° using flat plane geometry. The overall acquisition time was 2 seconds. A single drop from each sample was deposited onto its respective carbon-coated copper TEM grid using a micropipette and then allowed to slowly dry over a 24 hour period. After sample preparation a bright field TEM study was carried out to determine size and morphology using a Phillips CM-100 electron microscope (Phillips Corporation Eindhoven, The Netherlands) operating at 80kV. Samples for FESEM were prepared by pipetting two drops onto a thin mica strip attached to a SEM stub using carbon tape. After drying, samples were sputter coated with a 3 nm layer of Platinum. The particle size and morphological features were investigated using a high resolution FESEM (Zeiss Neon 40EsB FIBSEM) at 5 kV with a 30 µm aperture operating under a pressure of 10-10 mbar. While sample
elemental composition was analysed using an Oxford Instruments energy dispersive X-ray detectors (EDS).
3. Results and discussions
http://www.ijSciences.com Volume 4 – June 2015 (06)
29
first being Au and the second being Ag. In both cases the biomolecules present in the leaf extract were found to be an effective reducing agent in the formation of Au and Ag nanoparticles. Furthermore, after synthesis the biomolecules also acted as an effective stabilising agent preventing nanoparticle agglomeration. Formation of the respective nanoparticles could easily be seen via the colour change of the reactive ionic mixture. For example, the reactive solution s2 (1:2 ratio of AgNO3 to leaf
extract) changed from light green to dark brown in 10 minutes, see Figure 1 (d). The brown colour results from the excitation of surface plasmon vibrations of the Ag nanoparticles formed in the mixture. A representative UV-Vis spectrum for Au nanoparticle
synthesis via solution g2 (1:2) is presented in Figure 1 (a) and representative spectrum for Ag nanoparticle synthesis via solution s2 (1:2) is presented in Figure 1 (c). Inspection of spectrum presented in Figure 1 (a) reveals that maximum absorbance occurred at 570 nm for solution g2. This value is similar to the maximum absorbance’s reported by Philip (573 nm) for Hibiscus rosa sinensis [16] and Singh et al (560 nm) for ginger (Zingiber officinale) [17]. In the case of Ag, the spectrum presented in Figure 1 (c) reveals a maximum absorbance of 430 nm for solution s2. This value is consistent with the maximum absorbance reported by Singh et al using ginger [17] and by Masurkar et al using lemon grass [18].
Figure 1. UV-visible spectrophotometer analysis of Au nanoparticles (a) and Ag nanoparticles (c); Eucalyptus macrocarpa (Mottlecah) (b) and colour change induced by the reduction and stabilisation of Ag nanoparticles.
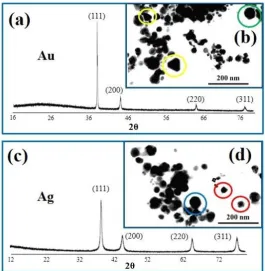
XRD spectroscopy was used to confirm the formation of crystalline Au and Ag in the respective samples. Representative XRD patterns of dried samples are presented in Figure 2 and all Au and Ag crystalline phases present in the respective samples were consistent with phases listed in the ICDD (International Centre for Diffraction Data) databases. Inspection of the XRD pattern in Figure 2 (a) reveals the presence of intense peaks that correspond to the main (hkl) indices for Au: (111), (200), (220) and (311). The existence and location of these peaks confirms the presence of pure crystalline metallic Au consisting of a face centred cubic (fcc) lattice structure. A similar result for Ag could be seen in the representative XRD pattern presented in Figure 2 (c)
http://www.ijSciences.com Volume 4 – June 2015 (06)
30
100 nm. Also present are nanocubes ranging in size from 10 to 50 nm (red circles) and in smaller
numbers are truncated and un-truncated triangular shapes that are around 100 nm (blue circle).
Figure 2. XRD spectroscopy analysis of samples containing Au (a) and Ag (c) nanoparticles and TEM images of reduced Au (b) and (d) nanoparticles respectively.
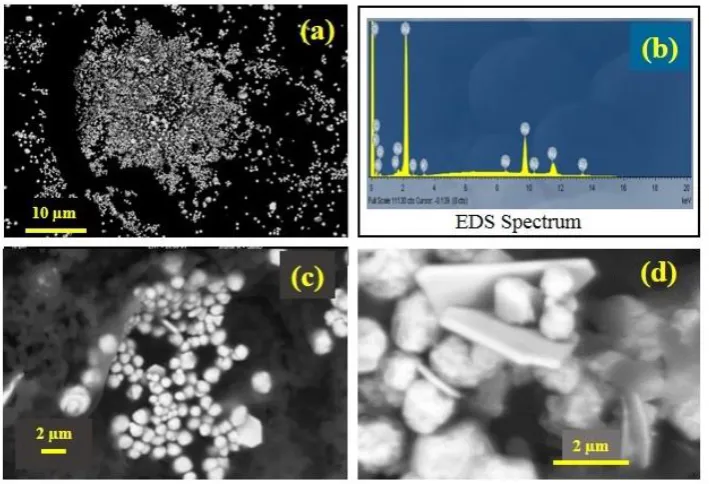
FESEM was not only used to examine the reduced nanoparticles, but it was also used to study the subsequent growth into the micrometre range. The study also revealed atomically flat surfaces which were a characteristic feature of the plate-like particles. Also carried out as part of the FESEM study was an EDS elemental analysis of the samples. Figure 3 presents the results of the FESEM and EDS studies of Au, while Figure 4 presents the results of the Ag studies. Figure 3 (a) presents a representative FESEM micrograph in backscatter mode showing an array of various sized Au particles. Figure 3 (b) presents the corresponding EDS elemental analysis of the sample and clearly shows the strong presence of Au. The EDS result confirms the results of the XRD
http://www.ijSciences.com Volume 4 – June 2015 (06)
31
Figure 3 (a) Representative FESEM micrograph (backscatter mode) showing an array of various sized Au particles; (b) EDS elemental analysis showing the strong presence of Au; (c) Enlarged micrograph showing the variety of particle morphologies, and (d) Enlarged micrograph highlighting particle morphology.
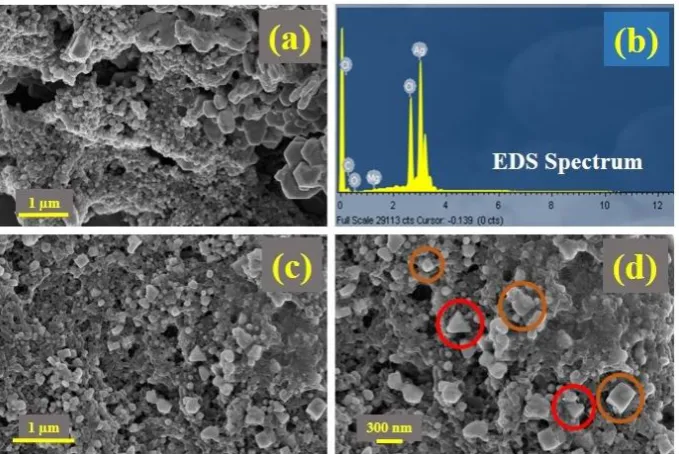
Figure 4 (a) presents a representative FESEM micrograph of the various Ag particle sizes and morphologies present in the sample. The aggregate is composed of micrometre scale triangular, cubic and hexagonal plates. EDS elemental analysis of a representative sample as shown in Figure 4 (b) reveals the presence of Ag and confirms the XRD analysis results that Ag was biologically reduced by the leaf extract. Examining the FESEM micrographs provided information regarding particle sizes and morphologies present in the samples. Typically, the length of the sides of the hexagonal plates were around 500 nm and the thickness ranged from 80 to 150 nm. However, the predominant morphology present in the samples was the cubic structure as shown in Figure 4 (c). Typically, the side dimension of the Ag cubes ranged from 300 nm up to around 1
µm. Also present are a few spherical to rounded non spherical particles, but there are also a small numbers of triangular structures. Figure 4 (d) highlights a typical triangle with a red circle and a representative cube with a brown circle for easier identification.
The present work has shown that the leaf extract taken from Eucalyptus macrocarpa (Mottlecah) has the capability of biologically reducing both Au and Ag from respective ion sources. Analysis of the results from the various characterisation techniques has confirmed the formation of Au and Ag nanoparticles with a morphologies such as spherical, semi-spherical, cubic, hexagonal, triangular and truncated triangular. The synthesis process can be summarized by the following equation:
http://www.ijSciences.com Volume 4 – June 2015 (06)
32
Figure 4 (a) Representative FESEM micrograph showing an array of various sized Ag particles; (b) EDS elemental analysis showing the strong presence of Ag; (c) Micrograph of various particle morphologies, and (d) highlighted particles.
4. Conclusion
The present work has demonstrated a straightforward, clean, and eco-friendly process for biologically synthesising Au and Ag nanoparticles via leaf extracts from an indigenous Australian plant Eucalyptus macrocarpa. The studies revealed that the leaf extract at room temperature (24 °C) was able to act as both reducing agent and stabilising agent. XRD and EDS analysis confirmed that biological reduction produced metallic Au and Ag from their respective ion sources. UV-visible spectroscopy analysis found that the respective absorption peaks (Au: 570 nm and Ag: 430 nm) were consistent with Au and Ag peaks reported in the literature for similar plant based synthesis methods. Furthermore, analysis of TEM and FESEM images confirmed the reduction and subsequent stabilisation process had produced a variety of nanoparticle sizes and morphologies. Both TEM and FESEM images revealed spherical and non-spherical particle morphologies for both Au and Ag nanoparticles. TEM images of Au taken after 1 h revealed spherical particles ranging in size from 20 nm up to around 100 nm. Also present in smaller numbers were triangular, pentagon and hexagonal shapes ranging in size from 50nm to 100 nm. Longer reduction times permitted particles to grow into micrometre scale platelets typically 2 µm in size. Spherical Ag nanoparticles ranging in size from 10 to 100 nm, cubes ranging in size from 10 to 50 nm and the occasional triangle were seen in TEM images after 1 h of reduction. Subsequent FESEM images taken after longer periods revealed the predominant morphology was micrometre scale cubic (50 nm up to
1 µm) with smaller numbers of triangles and hexagonal plates.
Acknowledgements
This work was partly supported by Horticulture Innovation Australia Project Al14003 and Dr Derek Fawcett would like to thank Horticulture Innovation Australia for their research fellowship. The authors would also like to thank Dr Ravi Krishna Brundavanam for his assistance with the XRD measurements and Dr Xuan Le for her assistance with the FESEM microscopy.
Disclosure
The authors claim no conflict of interest in this work.
References
1) Youns, M., Hoheisel, J. D., Efferth, T. Therapeutic and diagnostic applications of nanoparticles. Curr. Drug Targets. 2011; 12: 357–365. http://dx.doi.org/10.2174/138945011794815257
2) Azzazy, H. M. E., Mansour, M. M. H., Samir, T. M., Franco, R. Gold nanoparticles in the clinical laboratory: principles of preparation and applications. Clin. Chem. Lab Med. 2012; 50: 193–209. http://dx.doi.org/10.1515/cclm.2011.732 3) Sharma, V. K., Yngard, R. A., Lin, Y. Silver nanoparticles:
Green synthesis and their antimicrobial activities. Advances in Colloid and Interface Science. 2009; 145: 83-96. http://dx.doi.org/10.1016/j.cis.2008.09.002
4) LaLonde, A. D., Norton, M. G., Zhang, D., et al. Controlled growth of gold nanoparticles on silica nanowires. Journal of Materials Research. 2005; 20 (11): 3021–3027. http://dx.doi.org/10.1557/jmr.2005.0368
http://www.ijSciences.com Volume 4 – June 2015 (06)
33
6) Cao, G. Nanostructures and nanomaterials: synthesis, properties and applications. Imperial College Press, London, 2004. http://dx.doi.org/10.1021/ja0409457
7) Ai, J., Biazar, E., Jafarpour, M., et al. Nanotoxicology and nanoparticle safety in biomedical designs. International Journal of Nanomedicine. 2011; 6: 1117-1127. http://dx.doi.org/10.2147/ijn.s16603
8) Lengke, M., Southam, G. Bioaccumulation of gold by sulphate-reducing bacteria cultured in the presence of gold (I)-thiosulfate complex. Acta. 2006; 70(14): 3646-3661. http://dx.doi.org/10.1016/j.gca.2006.04.018
9) Kumar P, Singh P, Kumari K et al (2011) A green approach for the synthesis of gold nanotriangles using aqueous leaf extract of Callistemon viminalis. Mater Lett 65: 595-597. http://dx.doi.org/10.1016/j.matlet.2010.11.025
10) Kuber, C., Souza, S. F. Extracellular biosynthesis of silver nanoparticles using the fungus Aspergillus fumigates. Colloids Surf. B. 2006; 47:160-164. http://dx.doi.org/10.1016/j.colsurfb.2005.11.026
11) Ahmad, A., Senapati, S., Khan, M. I., et al. Intracellular synthesis of gold nanoparticles by a novel alkalotolerant actinomycete Rhodococcus species. Nanotechnology. 2003; 14: 824-828. http://dx.doi.org/10.1088/0957-4484/14/7/323 12) Mukunthan, K, Balaji, S. Cashew apple juice (Anacardium
occidentale L.) speeds up the synthesis of silver
nanoparticles. Int. J. Green Nanotechnol. 2012; 4: 71–9. http://dx.doi.org/10.1080/19430892.2012.676900
13) Narayanan, K. B., Sakthivel, N. Phytosynthesis of gold nanoparticles using leaf extract of Coleus amboinicus Lour. Mater, Charact. 2010; 61: 1232–1238. http://dx.doi.org/10.1016/j.matchar.2010.08.003
14) Makarov, V. V., Love, A. J., Sinitsyna, O. V., et al., “Green” Nanotechnologies: Synthesis of Metal Nanoparticles Using Plants. Acta Naturae. 2014; 6(1): 35-44.
15) Mittal, A. K., Chisti, Y., Banerjee, U. C. Synthesis of metallic nanoparticles using plants. Biotechnology Advances. 2013; 31: 346-356. http://dx.doi.org/10.1016/j.biotechadv.2013.01.003
16) Philip, D. Green synthesis of gold and silver nanoparticles using Hibiscus rosa sinensis. Physica E. 2010; 42: 1417-1424. http://dx.doi.org/10.1016/j.physe.2009.11.081 17) Singh, C., Sharma, V., Naik, P. K., et al. A green biogenic
approach for synthesis of gold and silver nanoparticles using Zingiber officinale. Digest Journal of Nanomaterials and Biostructures. 2011; 6(2): 535-542.