Patron: Her Majesty The Queen Rothamsted Research Harpenden, Herts, AL5 2JQ
Telephone: +44 (0)1582 763133 Web: http://www.rothamsted.ac.uk/
Rothamsted Research is a Company Limited by Guarantee Registered Office: as above. Registered in England No. 2393175. Registered Charity No. 802038. VAT No. 197 4201 51. Founded in 1843 by John Bennet Lawes.
Rothamsted Repository Download
A - Papers appearing in refereed journals
Parnell, S., Gilligan, C. A. and Van Den Bosch, F. 2005. Small-scale
fungicide spray heterogeneity and the coexistence of resistant and
sensitive pathogen strains. Phytopathology. 95 (6), pp. 632-639.
The publisher's version can be accessed at:
•
https://dx.doi.org/10.1094/PHYTO-95-0632
The output can be accessed at:
https://repository.rothamsted.ac.uk/item/89703/small-
scale-fungicide-spray-heterogeneity-and-the-coexistence-of-resistant-and-sensitive-pathogen-strains
.
© Please contact [email protected] for copyright queries.
Analytical and Theoretical Plant Pathology
Small-Scale Fungicide Spray Heterogeneity and the Coexistence
of Resistant and Sensitive Pathogen Strains
S. Parnell, C. A. Gilligan, and F. van den Bosch
First and third authors: Biomathematics, Rothamsted Research, Harpenden, Herts AL5 2JQ, UK; and second author: Department of Plant Sciences, University of Cambridge, Downing Street, Cambridge CB2 3EA, UK.
Accepted for publication 2 February 2005.
ABSTRACT
Parnell, S., Gilligan, C. A., and van den Bosch, F. 2005. Small-scale fungicide spray heterogeneity and the coexistence of resistant and sensi-tive pathogen strains. Phytopathology 95:632-639.
Empirical evidence indicates that fungicide-resistant and sensitive strains can coexist for prolonged periods. Coexistence has important practical implications, for example, for the posttreatment recovery of sensitivity and consequently the life expectancy of fungicide products. Despite this, the factors influencing coexistence remain relatively un-explored. Ecological studies have shown that environmental hetero-geneity can facilitate the coexistence of different species and subspecific groups. Here we use a simple differential equation model and show that fungicide spray heterogeneity per se is not sufficient for coexistence but
that the outcome depends crucially on the competitive relationship be-tween resistant and sensitive strains. The model incorporates the compe-tition between resistant and sensitive pathogen strains for a limited supply of susceptible host tissue on a crop which has received an incomplete coverage of fungicide. We use a combination of invasibility analysis and model simulations to explore the conditions under which coexistence can occur. We further show that the maximum density of healthy host tissue is realized when resistant and sensitive pathogen strains coexist. A set of key influencing parameters are identified and analyzed, and the consequences of the results for disease and resistance management are discussed.
Additional keywords: fitness cost, fungicide effectiveness, linear stability theory.
Empirical studies have indicated that invasion of fungicide-resistant pathogen strains does not necessarily lead to the extinc-tion of sensitive strains and that coexistence of both is possible over prolonged periods (3–5,8,13,28). Although it is difficult to distinguish coexistence from observations of intermediate fre-quencies in the field, Bierman et al. (5) showed the stable co-existence of carbendazim resistant and sensitive strains on carben-dazim-treated plots between 1987 and 2000. However, other studies have shown that coexistence of resistant and sensitive strains does not occur and that either resistance fails to invade (15) or invades to the subsequent exclusion of the sensitive popu-lation (2). To develop effective resistance management strategies it is imperative to understand the processes that influence which of these outcomes occurs in practice.
Models for the evolution of fungicide resistance either assume invasion is inevitable (7,20) or focus on the factors that influence the invasion of resistance (14,24). For example, Gubbins and Gilligan (14) found that if the sum of the net fitness costs associated with resistance are less than the effect of the fungicide on the sensitive population, resistant strains invade. If the con-verse is true, resistant strains do not invade. Assuming the invasion of resistant strains does occur, each of these models (7,14,20,24) predicts the complete exclusion of sensitive strains with time. The processes that enable coexistence are relatively un-explored and to our knowledge no model of fungicide resistance has practically demonstrated a mechanism by which sensitive and resistant pathogen strains coexist. Criteria for coexistence have been derived in some studies (7,14), but these criteria are unrealistically narrow occurring only for parameter values exactly on the threshold separating resistance invasion and noninvasion.
However, coexistence has important practical implications; for example, the survival of even a small sensitive population during treatment will enhance the posttreatment recovery of sensitivity.
Environmental heterogeneity has been shown to promote the coexistence of different species and subspecific groups in ecologi-cal systems (16,22). In the context of chemiecologi-cal control, geneity in spray coverage corresponds to environmental hetero-geneity. A fungicide applied to a host crop is a component of the environment of a plant pathogen and all presently applied spray technologies result in an incomplete coverage of fungicide on the targeted host (9). In this paper we consider the role of this type of spatial heterogeneity on the invasion and persistence of resistant and sensitive pathogen strains. Specifically we address the follow-ing: does incomplete spray coverage facilitate the coexistence of resistant and sensitive strains and are there thresholds for inva-sion, excluinva-sion, and coexistence?
We consider a system where sensitive and resistant strains in-directly compete for a limited supply of treated and untreated host tissue. Empirical evidence suggests that in the absence of fungi-cide treatment the sensitive strain is at a fitness advantage due to the inherent fitness cost carried by the resistant strain (19,21). In the presence of fungicide treatment the sensitive strain is limited by the effect of the fungicide and so this advantage is reduced or lost. In this paper we show that spatial heterogeneity per se is not sufficient to allow for coexistence but that the outcome depends on the competitive relationship between strains.
THEORY AND APPROACHES
The model. The full model describes the dynamics of a fungi-cide-treated host–parasite system at field scale. We extend the model of Gubbins and Gilligan (14) to incorporate an untreated host region to account for incomplete spray coverage and we ex-plicitly describe the movement of spores between treated and un-treated regions. All model variables and parameters are provided in Table 1.
Corresponding author: S. Parnell; E-mail address: [email protected]
DOI: 10.1094 / PHYTO-95-0632
Host dynamics. Treated and untreated healthy host densities are denoted by H1 and H2,respectively. Many resistance responses
to fungicides are monogenic (34); thus, we classify the pathogen into a fungicide-sensitive and resistant strain. Healthy host den-sity increases due to crop growth and decreases due to infection by resistant and sensitive pathogens. This leads to the following differential equations:
[
]
⎥ ⎦ ⎤ ⎢ ⎣ ⎡ − ⎥ ⎦ ⎤ ⎢ ⎣ ⎡ − = strain sensitive to due infection strain resistant to due infection growth host dd 1 1
1
1 H H
t H H
[
]
⎥ ⎦ ⎤ ⎢ ⎣ ⎡ − ⎥ ⎦ ⎤ ⎢ ⎣ ⎡ − = strain sensitive to due infection strain resistant to due infection growth host dd 2 2
2
2 H H
t H
H
(1)
In the absence of disease, healthy host growth is logistic with growth rate, r, and carrying capacity, K. The total density of healthy host is the sum of H1 and H2 with the proportion of
treated and untreated areas determined by θ and 1 – θ, respec-tively. We thus have
[
]
⎟⎟ ⎠ ⎞ ⎜⎜ ⎝ ⎛ − + + θ = K H H H H r H 2 1 2 11 ( )1
growth host
[
]
⎟⎟ ⎠ ⎞ ⎜⎜ ⎝ ⎛ − + + θ − = K H H H H rH2 (1 )( 1 2)1 1 2
growth host
(2)
Spore density is denoted by Uij, where i represents host region
(treated; subscript 1, or untreated; subscript 2)and j denotes resis-tant status (resisresis-tant; subscript 1, or sensitive; subscript 2) (ex-planation of the spore dynamics described below). The basic host infection rate is denoted by b. The infection rate of the resistant pathogen spores is reduced by a cost to resistance, ρb, on both the
treated and untreated host regions, and the infection of the sensi-tive pathogen spores is reduced by the effect of the fungicide, εb,
on the treated region only. We thus have
1 11 1 1 12 1 ) 1 ( strain sensitive to due infection ) 1 ( strain resistant to due infection H U b H H U b H b
b ⎥= −ε
⎦ ⎤ ⎢ ⎣ ⎡ ρ − = ⎥ ⎦ ⎤ ⎢ ⎣ ⎡ 2 1 2 2 2 2 2 2 strain sensitive to due infection ) 1 ( strain resistant to due infection H bU H H U b H
b ⎥=
⎦ ⎤ ⎢ ⎣ ⎡ ρ − = ⎥ ⎦ ⎤ ⎢ ⎣ ⎡ (3)
Pathogen dynamics.We characterize the pathogen by its
loca-tion on either the treated host region or the untreated host region. Pathogens, Pij, are described by
[
]
[
death]
ent establishm and Infection density spore d d − ⎥ ⎦ ⎤ ⎢ ⎣ ⎡ = t Pij (4)
where as with the variable Uij, host region is i (resistant; subscript
1, or sensitive; subscript 2) and fungicide resistance status is j
(treated; subscript 1, or untreated; subscript 2). Infections become established at rate g and have an average infectious period of µ–1.
The fitness cost to resistance and fungicide effectiveness propor-tionally reduce these parameters by ρg and ρµ, and εg andεµ,
respectively. This gives the dynamics of the resistant and sensitive pathogens: 11 1 11 11 ) 1 ( ) 1 ( ) 1 ( d d P H U g b t P g b µ ε − µ − ε − ε − = 21 2 21 21 d d P H bgU t
P = −µ
12 1 12 12 ) 1 ( ) 1 ( ) 1 ( d d P H U g b t P g b µ ρ − µ − ρ − ρ − = (5) 22 2 22 22 ) 1 ( ) 1 ( ) 1 ( d d P H U g b t P g b µ ρ − µ − ρ − ρ − =
Spore dynamics.Pathogens of resistance status j, located around
either the treated or untreated host region, produce spores. Spores can migrate to an area of different treatment status or migrate out of the pathosystem altogether, for example, due to deposition on the ground or leaving the canopy layer and being blown out of the field. The average densities of spores, Uij, are described by the
following equations:
21 11 11 (1 )WP XP U =γ −εγ +γ
11 21
21 ZP (1 )YP
U =γ +γ −εγ (6)
22 12
12 (1 )WP (1 )XP U =γ −ργ +γ −ργ
12 22
22 (1 )ZP (1 )YP U =γ −ργ +γ −ργ
The basic spore production rate is given by γ. For sensitive infec-tions in the treated region, spore production is reduced by fungicide effectiveness, εγ, and for resistant infections, spore
pro-duction is reduced by the fitness cost to resistance, ργ, regardless
of host location. Of the spores produced in the treated region, W
indicates the fraction of spores that are deposited within the treated region and Y indicates the fraction deposited within the untreated region. Similarly, of the spores produced in the un-treated region, Z indicates the fraction deposited in the untreated region and X indicates the fraction deposited in the treated region (Appendix I provides the full derivation of the spore dynamics).
The full model system now reads
[
]
[
12 22]
11 21 11 2 1 2 1 1 ) 1 ( ) 1 ( ) 1 ( ) 1 ( ) 1 ( 1 ) ( d d H XP WP b H XP WP b K H H H H r t H b b γ γ γ ρ − γ + ρ − γ ρ − − γ + ε − γ ε − − θ ⎟ ⎠ ⎞ ⎜ ⎝ ⎛ − + + =
[
]
[
12 22]
22 21 11 2 1 2 1 2 ) 1 ( ) 1 ( ) 1 ( ) 1 ( ) 1 ( 1 ) ( d d H YP ZP b H YP ZP b K H H H H r t H
b γ γ
γ ρ − γ + ρ − γ ρ − − γ + ε − γ − θ − ⎟ ⎠ ⎞ ⎜ ⎝ ⎛ + − + =
[
11 21]
1 1111 ) 1 ( ) 1 ( ) 1 ( ) 1 ( d d P H XP WP g b t P g b µ γ +γ − −µε ε − γ ε − ε −
= (7)
[
11 21]
2 2121 (1 )
d d P H YP ZP bg t
P = γ −ε +γ −µ
γ
[
12 22]
1 1212 ) 1 ( ) 1 ( ) 1 ( ) 1 ( ) 1 ( d d P H XP WP g b t P g b µ γ γ +γ −ρ − −µρ ρ − γ ρ − ρ − =
[
12 22]
2 2222 ) 1 ( ) 1 ( ) 1 ( ) 1 ( ) 1 ( d d P H YP ZP g b t P g b µ γ γ +γ −ρ − −µρ ρ − γ ρ − ρ − = RESULTS
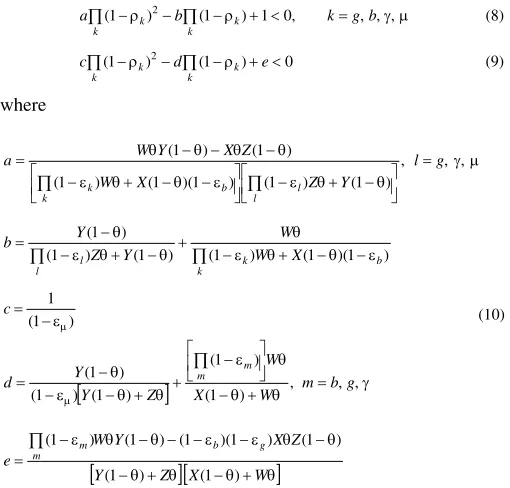
Invasibility and coexistence. The invasion criteria. We first calculate invasion criteria. The analysis proceeds in the following way. Assume that only one strain is present. Then introduce an infinitesimally small amount of the other strain (by mutation or migration) and calculate for which parameter values it can invade the system. When both strains can invade the system with only the other strain present, both strains coexist. To achieve this we apply linear stability theory, as described by Edelstein-Keshet (11), to analyze the stability properties of the model system. This analysis is used to show the effect of parameter values on the thresholds for the invasion of resistant and sensitive strains and on coexis-tence, and is complimented by simulations to analyze the effect of parameter values on the density of the different pathogen strains. The equations and simulations were solved using Maple 7 (27). (Appendix II provides the full derivation of the invasion criteria [equations 8 and 9]).
only the host and the sensitive strain is unstable and the resistant strain can invade. When the criteria in equation 9 are met, the steady-state system containing only the host and the resistant strain is unstable and the sensitive strain can invade. If the criteria in both equations 8 and 9 are met, then the resistant and sensitive strain can coexist.
∏
∏ −ρ − −ρ + < = γ µ
k k
k k
b g k b
a (1 )2 (1 ) 1 0, , , , (8)
∏
∏ −ρ − −ρ + <
k k k
k d e
c (1 )2 (1 ) 0 (9)
where
µ γ = ⎥⎦ ⎤ ⎢⎣
⎡ −ε θ+ −θ
⎥⎦ ⎤ ⎢⎣
⎡ −ε θ+ −θ −ε
θ − θ − θ − θ =
∏ ∏
, , , ) 1 ( ) 1 ( ) 1 )( 1 ( ) 1 (
) 1 ( ) 1 (
g l Y
Z X
W
Z X Y W a
l l k
b k
∏
∏ −ε θ+ −θ −ε
θ +
θ − + θ ε −
θ − =
k
b k
l
l W X
W Y
Z Y b
) 1 )( 1 ( ) 1 ( ) 1 ( ) 1 (
) 1 (
) 1 (
1
µ
ε − =
c (10)
[
]
−θ + θ = γθ ⎥ ⎦ ⎤ ⎢
⎣
⎡ −ε
+ θ + θ − ε −
θ −
= ∏
µ
, , , ) 1 (
) 1 (
) 1 ( ) 1 (
) 1 (
g b m W X
W
Z Y Y
d m
m
[
−θ + θ][
−θ + θ]
θ − θ ε − ε − − θ − θ ε − =∏
W X
Z Y
Z X Y
W e
g b m
m
) 1 ( ) 1 (
) 1 ( ) 1 )( 1 ( ) 1 ( ) 1 (
These expressions show that the fitness costs (ρi’s), effectiveness
of the fungicide (εi’s), the proportion of spray coverage (θ), and
the dispersal rates (A, B,andµ′) determine whether or not a strain
can invade. Importantly, the analysis shows that the pathogen life history traits (γ, b, g,and µ–1) and the host rate of increase (r) and
the carrying capacity (K) have no effect on invasibility. The fit-ness cost parameters, ρi’s, affect the invasion criteria and
simu-lations in an identical way to each other; therefore, for the re-mainder of the analysis, all fitness cost parameters are equated to a single parameter ρ. Likewise, the fungicide effectiveness param-eters, εi’s, are equated to ε because only small quantitative
differ-ences on the model dynamics were detected between them.
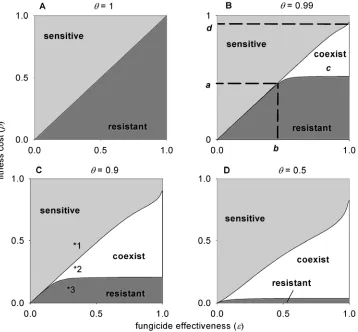
Thresholds for invasion and coexistence.If we assume
com-plete spray coverage (θ = 1), the model is equivalent to the de-terministic model presented by Gubbins and Gilligan (14) (Fig. 1A). Coexistence of resistant and sensitive strains is not possible for any combination of parameter values. The invasion of either strain is a trade-off between the cost to resistance, ρ, and the fungicide effectiveness, ε, and is determined by the threshold ρ=
ε(Fig. 1A).
Under incomplete spray coverage (θ< 1) we identify three re-gions of parameter space: sensitive strain only, resistant strain only, and coexistence (Fig. 1B to D). There is a critical value of fitness cost and of fungicide effectiveness above which coexis-tence is possible (Fig. 1B). These thresholds are identified as a
(fitness cost threshold) and b (fungicide effectiveness threshold) in Figure 1B with the coexistence region depicted by c (Fig. 1B). Importantly, the coexistence region is bounded above by ρ = ε (Fig. 1B). There is also a critical value of fitness cost, depicted as threshold d (Fig. 1B), whereby the resistant strain cannot invade the system regardless of the fungicide effectiveness.
The effect of spray coverage on invasion and coexistence. The
effects of spray coverage on the thresholds for invasion and the coexistence of both strains are shown in Figure 1 with corre-sponding trajectories on Figure 2. As the level of spray coverage decreases, there is a nonlinear decrease in thresholds a, b, and d
and an increase in the region of coexistence, c (Fig. 1B to D). The effect of spore dispersal rates on invasion and
coexis-tence. A decrease in the dispersal rates has a similar effect; the
thresholds a, b, and d decrease and coexistence region c increases (Fig. 3A and B). This is a particularly important observation as plant pathogen species vary in their dispersal mechanisms and capabilities.
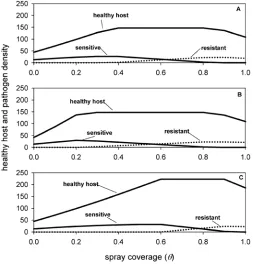
Healthy host density and coexistence. Figure 4 shows the steady-state densities of the pathogen strains and the total healthy host derived from numerical simulations. The simulations cor-roborate the results of the invasion analysis. For very low levels of spray coverage the resistant strain is excluded and only the sensi-tive strain is present (Fig. 4). For increasing spray coverage a point is reached whereby the resistant strain can invade (Fig. 4). The two strains coexist for intermediate levels of spray coverage but there is an upper value whereby the sensitive strain is ex-cluded (Fig. 4).
The simulations show that the maximum density of healthy host is achieved when there is coexistence (Fig. 4). Health host density increases with increasing spray coverage until the resis-tant strain invades. A maximum, which is independent of spray coverage, is then attained where there is coexistence. Following the exclusion of the sensitive strain at high levels of spray age, healthy host density decreases with increasing spray cover-age. An increase in fungicide effectiveness decreases maximum healthy host density as the resistant strain invades at lower values of spray coverage (Fig. 4B). Conversely, an increase in the fitness cost to resistance causes the resistant strain not to invade until a higher value of spray coverage and thus increases maximum healthy host density (Fig. 4C).
DISCUSSION
Previous models of fungicide resistance have either ignored in-complete spray coverage (14) or included inin-complete spray cover-TABLE 1. Model variables and parameters
Symbol Description Value Dimension
Variable
H1 Treated host density ... L2⋅L–2
H2 Untreated host density ... L2⋅L–2 Pij Pathogen density on host region i with
sensitivity status j (i = 1 = treated, i = 2 = untreated; j = 1 = sensitive,
j = 2 = resistant) ... L2⋅L–2 Parameter
r Host growth rate 1a t–1
K Host carrying capacity 1,000a ...
θ Fraction of spray coverage; 0 to 1 Varied ... Uij Pathogen spores around host region i
with sensitivity status j ... #L–3 W, X, Y, Z Spore dispersal constants (see model
description for full derivation and
expressions) Varied ...
A Spore dispersal from treated host
region to untreated host region Varied t–1 B Spore dispersal from untreated host
region to treated host region Varied t–1
µ′ Spore loss from the system Varied t–1 b Pathogen infection rate 0.00006a t–1
γ Pathogen sporulation rate 400a t–1
g Number of pathogens produced per
infection 0.9 ...
µ Pathogen death rate 3a t–1
ρi Proportionate reduction in resistant
pathogen parameter i to account for
the fitness cost to resistance; 0 to 1 [0, 1] ...
εi Proportionate reduction in pathogen
parameter i to account for the fungi-
cide effectiveness; 0 to 1 [0, 1] ...
age but not accounted for the limited supply of susceptible host tissue and its effect on the competition between resistant and sen-sitive strains (7,20,32). Here, by accounting for both incomplete spray coverage and this ecological interaction, we have shown how heterogeneity in spray coverage can lead to the coexistence of resistant and sensitive strains. However, spatial heterogeneity per se does not allow coexistence; the outcome depends crucially on the competitive relationship between the strains. The model shows that there are three possible outcomes: (i) coexistence of both strains, (ii) only the resistant strain survives, and (iii) only the sensitive strain survives. We have identified three thresholds that determine these outcomes and in addition show that the maximum density of healthy host tissue occurs where there is coexistence.
Invasibility and coexistence. The three possible outcomes shown in this paper are supported by empirical evidence (2– 5,8,13,15,28). Our model reveals that the thresholds for invasion and coexistence depend on three key components: (i) the com-petitive relationship between the resistant and sensitive strain, i.e., the trade-off between the inherent cost to resistance carried by the resistant strain and the effect of the fungicide on the sensitive strain, (ii) the level of spray coverage, and (iii) pathogen dispersal. The model suggests that the risk of resistance invading is not linked with the virulence of a pathogen species as the life history traits (infection, sporulation, and death rates) did not influence the thresholds. The present model focuses on the out-comes of invasion and coexistence and not on the subsequent rate of build up of resistant strains once invasion has occurred. In con-trast, previous studies have assumed that the resistant strain does invade and have looked at the factors that influence the
post-Fig. 2. Simulated dynamics of the resistant and sensitive pathogen strains corresponding to the three regions on Figure 1C. Solid lines indicate the sensitive strain and dashed lines indicate the resistant strain. Values of the parameters ρ and ε correspond to the following marked asterisks on Figure 1C: A, *1 (ρ = 0.5, ε = 0.4); B, *2 (ρ = 0.3, ε = 0.4); and C, *3 (ρ = 0.2, ε= 0.4). Default parameter values are θ = 0.9, µ = 3, b = 0.00006, γ = 400, g= 0.9, r = 1, K = 1,000, A = 0.1, B = 0.1, and µ′ = 0.25.
Fig. 1. Thresholds for the invasion of sensitive and resistant strains with dependence on fitness cost, ρ, and fungicide effectiveness, ε, with varying spray coverage,
invasion rate of increase of the resistant strain. These models have shown that the pathogen life history traits determine the post-invasion rate of increase (7,25) and a number of other factors in-cluding spatial and temporal heterogeneity in spray coverage (7,14,17,18,20,25,32), fungicide mixtures and alternations (10,17, 18,20,23,30,31,33), polygenically controlled resistance (18,30, 32), environmental conditions (25), and the initial frequency of resistance (25). These and a range of further theoretical issues re-garding the rate of development of resistant strains are discussed by Milgroom et al. (26).
The current model reveals that coexistence is only possible where spray coverage is incomplete and where there is a cost to resistance (Fig. 1). Further, the cost to resistance must not exceed the effectiveness of the fungicide. Coexistence can therefore be understood as follows. The sensitive strain has a refuge on the untreated region of the host. That is, if the cost to resistance is less than the effectiveness of the fungicide, the sensitive strain is the inferior competitor on the treated region but the superior com-petitor on the untreated region. If the cost to resistance is greater than the effectiveness of the fungicide, the resistant strain is the inferior competitor on both treated and untreated regions. Empiri-cal studies have indicated the presence of fitness costs in some cases but not in others. For example, fitness costs in isolates resis-tant to sterol biosynthesis-inhibiting fungicides were found in
Cercospora beticola (21) but not in Pyrenophora teres (29). In the current model, the resistant strain will always invade when there is no fitness cost and exclude the sensitive strain provided the fungicide is present and effective to some degree.
Work by Austin et al. (1) has demonstrated similar thresholds for coexistence or mutual exclusion of antibiotic resistant and sensitive strains to those found here. The authors described the carriage of resistant and sensitive bacterial strains through human communities. Although the biological problem and consequent model structure differed to that described here, similarly, thresh-olds for invasion and coexistence were related to the proportion of the community receiving treatment and the differential competi-tive abilities of strains.
Healthy host density and coexistence. The association be-tween maximum healthy host density and coexistence is not intui-tively obvious but can be understood in the following way. In the absence of the resistant strain, maximum healthy host density would correspond with complete spray coverage and maximal fungicide effectiveness. However, the resistant strain is able to invade once spray coverage exceeds a threshold and then limits the production of healthy tissue. As spray coverage increases further, the sensitive strain is eliminated and the resistant strain
can grow unchecked thereby reducing healthy host tissue. It there-fore follows that the maximal amount of healthy tissue occurs when there is coexistence. However, further research is required to establish the practical significance of this finding as it relates to equilibrium conditions which may not be achieved in practice.
Concluding remarks. The main message from this paper is that, where there is incomplete spray coverage and a cost to resis-tance, coexistence of fungicide-resistant and sensitive pathogen strains is possible. Moreover, we have shown that healthy host density is maximized when there is coexistence.
Whereas models have shown that incomplete spray coverage slows resistance development (7,20,32), this is in contradiction with prevailing resistance management advice (6). This
contra-Fig. 3. Thresholds for the invasion of sensitive and resistant strains with dependence on fitness cost and fungicide effectiveness for varying levels of dispersal (A, B, and µ′). A,A = B = 0.01, µ′ = 0.25, and θ = 0.9; and B,A = B = 1, µ′ = 0.25, and θ = 0.9. When ε or ρ = 0 there is no effect, and when ε or ρ = 1 there is full inhibition of the pathogen.
Fig. 4. Thechange in the steady-state densities of total healthy host and sensitive and resistant pathogens with varying proportion of spray coverage, θ. The equilibrium density refers to the resulting equilibrium after the resistant strain has invaded a system with only the sensitive strain present: A,ε= 0.4,
diction is reaffirmed by the results presented here which highlight that the exclusion of the sensitive strain through high coverage sprays will impair the posttreatment recovery of sensitivity. Given the rapid increase in resistance in many plant pathogens and the excessive costs of producing new chemical products (up to $100 million from discovery to development [12]), recovery is par-ticularly important.
This paper provides a basis for future work to consider the role of spray heterogeneity on the management of fungicide resis-tance. The results are not directly applicable to insecticide sys-tems due to differences in the mobility of insects and plant patho-gens. That is, plant pathogens are sedentary, dispersing only through the movement of spores, whereas insects are mobile and disperse through the movement of the individual insect. The con-sequences of these differences under the type of spatial hetero-geneity modeled here are unclear; however, this may form an interesting basis for future work. Further insight will be gained by looking at the role of temporal heterogeneity in fungicide spray applications and the influence of heterogeneity in fungicide coverage at a larger, regional scale.
APPENDIX I
A description of the dynamics of resistant and sensitive spores. The dynamics of the resistant and sensitive spores are explicitly modeled within the system and then simplified, based on an assumption on time scales, to give average spore densities,
Uij (equation 6), and spore dispersal constants W, X, Y, and Z. In
this appendix, the mathematical details behind this aspect of the paper are described.
Pathogens of resistance status j, located around either the treated or the untreated host region, produce spores. Spores can migrate to an area of different treatment status or migrate out of the pathosystem altogether, for example, due to deposition on the ground or leaving the canopy layer and being blown out of the field. Spore dynamics are therefore described by
⎥ ⎦ ⎤ ⎢ ⎣ ⎡ − ⎥ ⎦ ⎤ ⎢ ⎣ ⎡ + ⎥ ⎦ ⎤ ⎢ ⎣ ⎡ − ⎥ ⎥ ⎦ ⎤ ⎢ ⎢ ⎣ ⎡ ⎟⎟ ⎠ ⎞ ⎜⎜ ⎝ ⎛ ⎟⎟ ⎠ ⎞ ⎜⎜ ⎝ ⎛ = region untreated to n emmigratio region untreated from n immigratio loss spore density pathogen rate n sporulatio d d 1 t U j (A1) ⎥ ⎦ ⎤ ⎢ ⎣ ⎡ − ⎥ ⎦ ⎤ ⎢ ⎣ ⎡ + ⎥ ⎦ ⎤ ⎢ ⎣ ⎡ − ⎥ ⎥ ⎦ ⎤ ⎢ ⎢ ⎣ ⎡ ⎟⎟ ⎠ ⎞ ⎜⎜ ⎝ ⎛ ⎟⎟ ⎠ ⎞ ⎜⎜ ⎝ ⎛ = region treated to n emmigratio region treated from n immigratio loss spore density pathogen rate n sporulatio d d 2 t U j (A2)
The basic spore production rate is given by γ; for sensitive infec-tions in the treated region, spore production is reduced by fungi-cide effectiveness, εγ, and for resistant infections, spore
produc-tion is reduced by the fitness cost to resistance, ργ, regardless of
host location. Spores from the treated region migrate to the un-treated region at rate A, from the untreated region to the treated region at rate B, and are lost from the system at rate µ′. For simplicity, spore loss is assumed to be independent of the density of the host crop. This yields the equations
21 11 11 11 11 (1 )
d d BU AU U P t
U =γ −ε −µ′ − +
γ 21 11 21 21 21 d d BU AU U P t U + − µ′ − γ = 22 12 12 12 12 (1 )
d d BU AU U P t
U =γ −ρ −µ′ − +
γ (A3) 22 12 22 22 22 (1 )
d d BU AU U P t
U =γ −ρ −µ′ − +
γ
An assumption on time-scales.Spore dispersal (parameters A,
B, and µ′) occurs at a time-scale much shorter than that of the pathogen’s infectious period, µ–1. We will thus assume that the
dynamics of spore dispersal are very fast relative to the other life cycle processes. To this end, equations A3 are rescaled by divid-ing through by µ′. Next assume that µ′ tends to infinity, while at the same time γ/µ′, A/µ′, and B/µ′ approach a constant value. Solving the resulting equations we find
0 ) 1 ( d d
1 11 21
11 11 11 = µ′ + µ′ − − µ′ ε − γ = µ′
γ AU BU
U P t U 0 d d
1 11 21
21 21 21 = µ′ − µ′ + − µ′ γ = µ′ BU AU U P t U 0 ) 1 ( d d
1 12 22
12 12 12 = µ′ + µ′ − − µ′ ρ − γ = µ′
γ AU BU
U P t U (A4) 0 ) 1 ( d d
1 12 22
22 22 22 = µ′ − µ′ + − µ′ ρ − γ = µ′
γ AU BU
U P t
U
and therefore equation 6, where W, X, Y, and Z represent dispersal constants given by
)
( A B
B W + + µ′ µ′ + µ′ = )
( A B
B X + + µ′ µ′ = )
( A B
A Y + + µ′ µ′ + µ′ = )
( A B
A Z + + µ′ µ′ = (A5) APPENDIX II
Calculation of the invasion criteria. The criteria necessary for the invasion of either strain into a steady-state system containing only the healthy host and the other pathogen strain are calculated in this appendix.
The analysis of the stability of the steady state is described in detail by Edelstein-Keshet (11). Here we take a well-established short cut and use invasion analysis. We first calculate the criteria for the invasion of the resistant strain into a steady-state system where only the sensitive strain (P11 and P21) and healthy host (H1
and H2) are present. The stability of this system for which all
variables are >0 is given by
[
X X W]
g b H
g
b) (1 )(1 )(1 )
1 ( 1 µ γ −ε ε − ε − θ + θ − γ ε − µθ =
[
Y Y Z]
bg H
g)(1 )(1 )
1 ( ) 1 ( 2 µ γ −ε ε − ε − θ + θ − γ θ − µ = (B1)
The values of P11 and P21 are not provided because they are not required to be used for the invasion analysis. For very small densities of P12 and P22, the dynamics of the resistant strain can be
described by
[
1]
2212 1 12 ) 1 ( ) 1 ( ) 1 ( 1 ) 1 ( ) 1 ( ) 1 ( d d P H X g b P H W g b t P g b g b γ µ γ ρ − γ ρ − ρ − + ⎥ ⎥ ⎦ ⎤ ⎢ ⎢ ⎣ ⎡ ρ − µ − ρ − γ ρ − ρ − =
[
]
22 2 12 2 22 1 ) 1 ( ) 1 ( ) 1 ( ) 1 ( ) 1 ( ) 1 ( d d P H Y g b P H Z g b t P g b g b ⎥ ⎥ ⎦ ⎤ ⎢ ⎢ ⎣ ⎡ ρ − µ − ρ − γ ρ − ρ − + ρ − γ ρ − ρ − = µ γ γ (B2)The stability of the steady-state P12=P22=0 can thus be deter-mined from the eigenvalues of the Jacobian matrix,
⎟⎟ ⎠ ⎞ ⎜⎜ ⎝ ⎛ = 22 21 12 11 a a a a
where elements aij are
µ γ − −µε
ε − ε − ε − γ =
1 ) 1 )( 1 )( 1
( 1
11 bg WH
a b g
1 12 bgXH a = γ
2 21 bg(1 )ZH a = γ −εγ
(B4)
µ − γ
= 2
22 bgYH a
The stability properties of the steady-state system can be deter-mined from the determinant (det) and trace (tr) of the matrix (equation B3) and are given by
21 12 22 11
detJR=a a −a a (B5)
22 11 trJR=a +a
The resistant strain invades where the steady-state system is un-stable. This occurs where the determinant is negative or where the determinant is positive and the trace is positive. The criteria for the invasion of the resistant strain are therefore calculated to give equation 8.
To calculate the invasion criteria of the sensitive strain, the same process is repeated. The stability of a steady-state system where only the resistant strain (P12 and P22) and healthy host (H1
and H2) are present is given by
) )(
1 )( 1 ( ) 1 ( ) 1 (
1 −ρ −ρ γ −ρ −ρ − θ+ θ µθ
=
µ
γ X X W
g b H
g b
) )(
1 )( 1 ( ) 1 ( ) 1 ( 2
Z Y Y g
b H
g
b −ρ γ −ρ −ρ − θ+θ
ρ −
µθ =
µ γ
(B6)
Where again the values of P12 and P22 are not provided because they are not required to be used for the invasion analysis. For very small densities of P11 and P21, the dynamics of the sensitive strain
can be described by
[
1]
2111 1
11
) 1 ( ) 1 ( ) 1 (
1 ) 1 ( ) 1 ( ) 1 ( d d
P H X g
b
P H
W g
b t P
g b
g b
γ
µ γ
ε − γ ε − ε −
+ ⎥ ⎥ ⎦ ⎤ ⎢
⎢ ⎣ ⎡
ε −
µ − ε − γ ε − ε − =
(B7)
[
2] [
11 2]
21 21 (1 )d d
P H Y bg P H Z bg t
P = γ −ε + γ −µ
γ
The stability of the steady-state P11=P21=0 can thus be
deter-mined from the eigenvalues of the Jacobian matrix,
⎟⎟ ⎠ ⎞ ⎜⎜ ⎝ ⎛ =
22 21
12 11
a a
a a
JS (B8)
where elements aij are
µ γ − −µρ
ρ − ρ − ρ − γ =
1 ) 1 )( 1 )( 1
( 1
11 bg WH
a b g
1 12 bg(1 )(1 )(1 )WH a = γ −ρb −ρg −ργ
2 21 bg(1 )(1 )(1 )ZH a = γ −ρb −ρg −ργ
(B9)
µ γ − −µρ
ρ − ρ − ρ − γ =
1 ) 1 )( 1 )( 1
( 2
22 bg YH
a b g
The criteria for the invasion of the sensitive strain are calculated as for the resistant strain to give equation 9.
ACKNOWLEDGMENTS
This work was funded by the Biotechnology and Biological Research Council (BBSRC).
LITERATURE CITED
1. Austin, D., Kristinsson, K., and Anderson, R. 1999. The relationship between the volume of antimicrobial consumption in human communities and the frequency of resistance. Proc. Natl. Acad. Sci. USA 96:1152-1156.
2. Baroffio, C., Siegfried, W., and Hilber, U. 2003. Long-term monitoring for resistance of Botryotinia fuckeliana to anilinopyrimidine, phenyl-pyrrole, and hydroxyanilide fungicides in Switzerland. Plant Dis. 87:662-666.
3. Bateman, G. 1990. Comparison of the effects of prochloraz and flusilazole on foot rot diseases and on populations of the eyespot fungus, Pseudocercosporella herpotrichoides, in winter wheat. Z. Pflanzen-krankh. Pflanzenpathol. Pflanzenschutz 97:508-516.
4. Bateman, G. 1994. Selection in populations of the eyespot fungus in con-tinuous wheat by repeated applications of carbendazim and prochloraz. BCPC Fung. Resist. Monogr. 60:219-224.
5. Bierman, S., Fitt, B., van den Bosch, F., Bateman, G., Jenkyn, J., and Welham, S. 2002. Changes in populations of Tapesia yallundae and Tapesia acuformis (eyespot) under different fungicide regimes in succes-sive crops of winter wheat, 1984-2000. Plant Pathol. 51:191-201. 6. Brent, K. 1995. Fungicide resistance in crop pathogens: How can it be
managed? GCPF, Brussels.
7. Chin, K. 1987. A simple model of selection for fungicide resistance in plant pathogen populations. Phytopathology 77:666-669.
8. Chin, K., Chavaillaz, D., Kaesbohrer, M., Staub, T., and Felsenstein, F. G. 2001. Characterising resistance risk of Erysiphe graminis f. sp. tritici to strobilurins. Crop Prot. 20:87-96.
9. Dahmen, H., and Staub, T. 1992. Biological characterization of uptake, translocation and deposition of difenoconazole in wheat, peanut, and tomato plants. Plant Dis. 76:523-526.
10. Doster, M., Milgroom, M., and Fry, W. 1990. Quantification of factors influencing potato late blight suppression and selection for metalaxyl resistance in Phytophthora infestans: A simulation approach. Phytopathol-ogy 80:1190-1198.
11. Edelstein-Keshet, L. 1988. Mathematical Models in Biology. McGraw-Hill, Boston.
12. Evans, D. 1999. How can technology feed the world safely and sustain-ably. Pages 3-24 in: The Food-Environment Challenge. G. Brooks and T. Roberts, eds. The Royal Society of Chemistry, Cambridge.
13. Fehrmann, H., Horsten, J., and Siebrasse, G. 1982. Five years results from a long-term field experiment on carbendazim resistance of Pseudocerco-sporella herpotrichoides (Fron) Deighton. Crop Prot. 1:165-168. 14. Gubbins, S., and Gilligan, C. 1999. Invasion thresholds for fungicide
resistance: Deterministic and stochastic analyses. Proc. R. Soc. Lond. Ser. B 266:2539-2549.
15. Heaney, S., Hall, A., Davies, S., and Olaya, G. 2000. Resistance to fungi-cides in the Qol-STAR cross-resistance group: Current perspectives. Proc. 2000 BCPC Conf. Pests Dis. 2:755-762.
16. Horn, H., and MacArthur, R. 1972. Competition among fugitive species in a harlequin environment. Ecology 53:749-752.
17. Josepovitis, G. 1989. A model for evaluating factors affecting the develop-ment of insensitivity to fungicides. Crop Prot. 8:106-113.
18. Josepovitis, G., and Dobrovolszky, A. 1985. A novel mathematical ap-proach to the prevention of fungicide resistance. Pestic. Sci. 16:17-22. 19. Julian, A., Hardy, J., and Lucas, J. 1994. The induction and
characteri-sation of isolates of Pseudocercosporella herpotrichoides with altered sensitivity to the fungicide prochloraz. Pestic. Sci. 41:121-128.
20. Kable, P., and Jeffrey, H. 1980. Selection for tolerance in organisms ex-posed to sprays of biocide mixtures: A theoretical model. Phytopathology 70:8-12.
21. Karaoglanidis, G., and Thanassoulopoulos, C. 2001. Fitness of Cerco-spora beticola field isolates resistant and sensitive to demethylation inhibitor fungicides. Eur. J. Plant Pathol. 107:337-347.
22. Levin, S. 1992. The problem of pattern and scale in ecology. Ecology 73:1943-1967.
23. Levy, Y., Levi, R., and Cohen, Y. 1983. Build-up of a pathogen subpopu-lation resistant to a systemic fungicide under various control strategies: A flexible simulation model. Phytopathology 73:1475-1480.
24. Milgroom, M. 1990. A stochastic model for the initial occurrence and development of fungicide resistance in plant pathogen populations. Phytopathology 80:410-416.
25. Milgroom, M., and Fry, W. 1988. A simulation analysis of the epidemi-ological principles for fungicide resistance management in pathogen populations. Phytopathology 78:565-570.
26. Milgroom, M., Levin, S., and Fry, W. 1989. Population genetics theory and fungicide resistance. Pages 340-367 in: Plant Disease Epidemiology. K. Leonard and W. Fry, eds. McGraw-Hill, New York.
Waterloo Maple, Waterloo.
28. Murray, T. 1996. Resistance to benzimidazole fungicides in the cereal eyespot pathogen, Pseudocercosporella herpotrichoides, in the Pacific Northwest, 1984 to 1990. Plant Dis. 80:19-23.
29. Peever, T., and Milgroom, M. 1994. Lack of correlation between fitness and resistance to sterol biosynthesis-inhibiting fungicides in Pyrenophora teres. Phytopathology 84:515-519.
30. Shaw, M. 1989. A model of the evolution of polygenically controlled fungicide resistance. Plant Pathol. 38:44-55.
31. Shaw, M. 1993. Theoretical analysis of the effect of interacting activities on the rate of selection for combined resistance to fungicide mixtures. Crop Prot. 12:120-127.
32. Shaw, M. W. 2000. Models of the effects of dose heterogeneity and escape on selection pressure for pesticide resistance. Phytopathology 90:333-339. 33. Skylakakis, G. 1981. Effects of alternating and mixing pesticides on the
build-up of fungal resistance. Phytopathology 71:1119-1121.