DEMOGRAPHIC RESEARCH
A peer-reviewed, open-access journal of population sciences
DEMOGRAPHIC RESEARCH
VOLUME 34, ARTICLE 38, PAGES 1063–1074
PUBLISHED 22 JUNE 2016
http://www.demographic-research.org/Volumes/Vol34/38/ DOI: 10.4054/DemRes.2016.34.38
Descriptive Finding
Convergence in male and female life
expectancy: Direction, age pattern, and causes
Benjamin Seligman
Gabi Greenberg
Shripad Tuljapurkar
c
2016 Seligman, Greenberg & Tuljapurkar.
1 Introduction 1064
1.1 The Lee-Carter model 1064
1.2 Trends in mortality 1065
2 Methods 1066
3 Results 1066
4 Discussion 1072
Demographic Research: Volume 34, Article 38
Descriptive Finding
Convergence in male and female life expectancy: Direction, age
pattern, and causes
Benjamin Seligman1, 3
Gabi Greenberg2
Shripad Tuljapurkar3
Abstract
BACKGROUND
The cornerstone of mortality- and life-expectancy forecasting in developed nations, the Lee-Carter model relies on assumptions of there being a dominant singular value that captures most of the variance within a matrix of age-specific mortality rates over time and that the time trend captured by this lead singular value is constant. We revisit the model’s predictive ability and trends in mortality decline among developed nations since the end of the Cold War.
OBJECTIVE
To understand the predictive power of the Lee-Carter model with mortality trends since 1990.
METHODS
Mortality data were obtained from the Human Mortality Database. Forecasts were made using R with random walk forecasts using the packageforecast.
RESULTS
While Lee-Carter forecasts of life expectancy for combined sexes were accurate, sex-specific forecasts tended to somewhat overestimate for females and significantly under-estimate for males. Further investigation of the trend for males shows that the first singu-lar value continues to capture the majority of the variation in mortality since 1990, with progress along this dimension moving at a constant rate.
1Stanford University, School of Medicine. U.S.A. E-Mail:[email protected].
2Stanford University, Department of Statistics. U.S.A.
CONCLUSIONS
Lee-Carter forecasts have significantly underestimated gains in male life expectancy with-out major changes to the model’s assumptions. We believe this represents more rapid progress in tackling male mortality in the G7 countries without major changes to the age pattern of these gains. Curiously, this has not affected combined-sex forecasts, potentially being offset by slight overestimation of female mortality progress.
CONTRIBUTION
We show that the Lee-Carter model has made inaccurate forecasts of mortality rates un-related to violations of its underlying assumptions.
1. Introduction
The Lee-Carter method has become the standard approach for forecasting mortality and life expectancy of human populations, particularly among developed countries. In addi-tion to representing a significant advance in forecasting methods when it was developed, its findings with respect to historical mortality trends are of significant substantive in-terest. Some twenty years after its initial development and widespread adoption among actuarial agencies, we revisit the model’s predictive capability and the trends in mortality decline in the developed world since the end of the Cold War.
1.1 The Lee-Carter model
In the Lee-Carter model (Lee and Carter 1992; Lee 1999), the log of mortality at age x in year t is represented in this form:
log(mx,t) =ax+bx∗kt
whereaxis a vector of average, across a given base set of years, log mortality rates by
age,bxis a vector that can be seen as representing the ‘slope’ of log mortality rates by
age over time, andktis a vector with each element representing the ‘level of mortality’
in a given year, which is explained further below.
The key methodological innovation behind this model was the application of singular value decomposition to a centered matrix of log age-specific mortality rates by year. One may think of this as a principal-components analysis of this matrix. Typically, the first principal component captures≥85%of the variance. The loadings onto the first principal component, usually normalized to sum to one, form the vectorb, while the scores, which would then be normalized to sum to zero, are theks. Higher-order components could, in principle, be used; however, none of them accounts for a substantial amount of the
Demographic Research: Volume 34, Article 38
residual after the first principal component is accounted for. During the 20thcentury, the
ks have been roughly linear over time in most developed countries (Tuljapurkar, Li, and Boe 2000). Asaandbare constant over time, a random walk with drift to forecast the
ks can in turn forecast mortality rates and life expectancy with meaningful prediction intervals. This is also of substantive interest as the forces that would produce a linear relationship over time – as opposed to a discontinuous form as new innovations emerge, or a flattening curve as improvements in mortality diminish – remain unclear.
Extensions to this model have been made since its initial publication, allowing for coherent forecasts of subpopulations (Li and Lee 2005; Hyndman, Booth, and Yasmeen 2013) and attempting to allow for changing age-specific responses to the main time trend (Li and Gerland 2012; Li, Lee, and Gerland 2013). However, the fundamental underpin-nings of the model have remained, namely 1) that there is a dominant single time trend that explains the overwhelming majority of the variation in mortality rates over time and 2) that this dominant time trend is linear. We investigate whether these assumptions still hold and discuss the implications for forecasts.
1.2 Trends in mortality
Over the past century, there has been dramatic change in mortality rates and life pectancy in developed countries. In the United States, for example, estimated life ex-pectancy rose from 47.3 years in 1900 to 76.8 in 2008. The causes of death, likewise, have changed from being largely infectious diseases to noncommunicable, usually chronic dis-eases (Armstrong, Conn, and Pinner 1999), in line with the ideas of the epidemiologic transition (Omran 1971; Olshansky and Ault 1986). This theory offers a framework for how causes of death change in populations that are also undergoing a demographic tran-sition: initially, life expectancy is in the 20s to 30s, with deaths primarily from hunger, epidemic disease, and perinatal causes. As societies develop economically, mortality rates from these causes gradually decline, and life expectancy rises into the 40s or 50s. Finally, chronic diseases such as cancer and cardiovascular disease dominate the causes of death, although mortality rates continue to decline. At this point life expectancy is often in the 60s or 70s. A fourth stage of so-called delayed degenerative diseases has also been proposed, as mortality from chronic diseases is pushed back to ever older ages (Olshansky and Ault 1986).
also explore the Lee-Carter model’s forecasts with actual trends in mortality since its inception.
The other major trend in mortality in developed countries has been the convergence of life expectancy between the sexes. Since the early 1970s the gap between male and female life expectancy, which had been widening, has narrowed. We assess what this has done to forecasts of life expectancy for combined and separate sexes.
2. Methods
Life tables and population size by age and sex for the G7 countries (Canada, France, Germany, Italy, Japan, the United Kingdom, and the United States) were taken from the Human Mortality Database (HMD) (University of California, Berkeley and Max Planck Institute for Demographic Research no year). The analysis of Germany was limited to the regions that comprised the former West Germany, while national populations for the UK and France were used out of the available options. Forecasts were made from 1990 to 2010 for each sex separately and both sexes combined, with the Lee-Carter model fit using data beginning in 1950 (1956 for West Germany) and ending in 1989.
To construct survival probabilities and life expectancies, mortality in the first year of life was estimated using formulae for males, females, and both sexes combined as appropriate (Preston, Keyfitz, and Schoen 1972; Preston, Heuveline, and Guillot 2001).
To explore the extent to which other principal components capture mortality trends, the orthogonal complement was calculated as a measure of the residual to the Lee-Carter fitted log mortality rates as the difference of the two vectors of mortality rates.
Analysis was conducted using R version 2.15.2 in the RStudio IDE version 0.97 with forecasting run using theforecastpackage (R Core Team 2012; Hyndman and Khandakar 2008; RStudio 2012).
3. Results
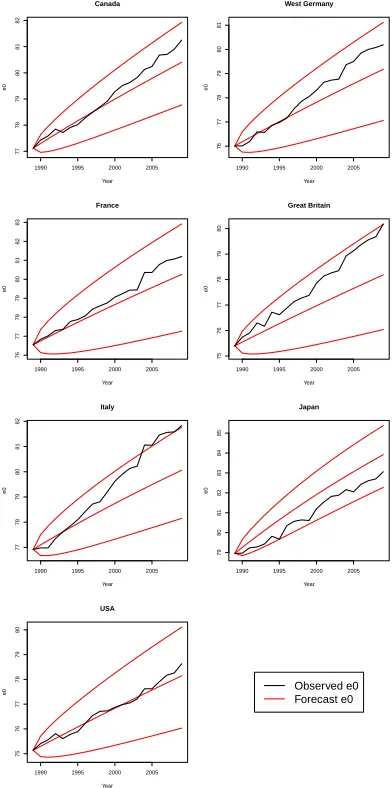
Figures 1–3 show the forecast results for combined sexes, males, and females. Overall, the observed trends in life expectancy remain linear over the period studied. Forecasts us-ing different base years do not differ substantially, although those usus-ing first and second stageks differ somewhat in the magnitude of difference between forecast and observed life expectancy (but not in the direction of the difference). Notably, for the four European countries and Canada, mean forecast life expectancy is substantially lower than what is observed, with the difference increasing over time. This is particularly striking for Italy, Germany, and the UK. In the United States, forecasts are approximately congruent with
Demographic Research: Volume 34, Article 38
observations.
Figure 1: Lee-Carter life expectancy forecasts, combined sexes
1990 1995 2000 2005
77 78 79 80 81 82 Canada Year e0
1990 1995 2000 2005
76 77 78 79 80 81 West Germany Year e0
1990 1995 2000 2005
76 77 78 79 80 81 82 83 France Year e0
1990 1995 2000 2005
75 76 77 78 79 80 Great Britain Year e0
1990 1995 2000 2005
77 78 79 80 81 82 Italy Year e0
1990 1995 2000 2005
79 80 81 82 83 84 85 Japan Year e0
1990 1995 2000 2005
75 76 77 78 79 80 USA Year
e0 Observed e0
Figure 2: Lee-Carter life expectancy forecasts, males
1990 1995 2000 2005
74 75 76 77 78 79 Canada Year e0
1990 1995 2000 2005
73 74 75 76 77 West Germany Year e0
1990 1995 2000 2005
72 73 74 75 76 77 78 France Year e0
1990 1995 2000 2005
73 74 75 76 77 78 Great Britain Year e0
1990 1995 2000 2005
74 75 76 77 78 79 Italy Year e0
1990 1995 2000 2005
76 77 78 79 80 81 82 Japan Year e0
1990 1995 2000 2005
72 73 74 75 76 USA Year
e0 Observed e0
Forecast e0
Demographic Research: Volume 34, Article 38
Figure 3: Lee-Carter life expectancy forecasts, females
1990 1995 2000 2005
80 81 82 83 84 85 86 Canada Year e0
1990 1995 2000 2005
79 80 81 82 83 84 West Germany Year e0
1990 1995 2000 2005
80 81 82 83 84 85 86 87 France Year e0
1990 1995 2000 2005
78 79 80 81 82 83 Great Britain Year e0
1990 1995 2000 2005
80 81 82 83 84 85 Italy Year e0
1990 1995 2000 2005
82 83 84 85 86 87 Japan Year e0
1990 1995 2000 2005
79 80 81 82 83 USA
e0 Observed e0
Among the results for females, most observed life expectancies were consistent with or somewhat above forecasts. The notable exceptions were the US and Canada, where observed life expectancy for women remained below forecasts throughout the period con-sidered. For men in Canada, France, Germany, Italy, the UK, and the US, observed life expectancy rose faster than was forecast, crossing the 95% forecast bound made with first-stageks in all cases except France. Coherent forecasts made using the Lee-Li method did not improve forecasts of male mortality.
Japan stands out as the exception to this overall pattern. For Japan, the median forecasts are consistently optimistic compared to observed life expectancy for each sex, although observed trends remain within the 95% prediction interval. This indicates a deceleration in mortality improvement for both sexes in Japan. Importantly, Japan under-went a significant epidemiologic transition and experienced exceptionally rapid mortality decline during the baseline years. The slower decline in recent years is likely the result of convergence with other industrialized countries. However, unlike the other countries studied here, there is no male-female convergence in life expectancy.
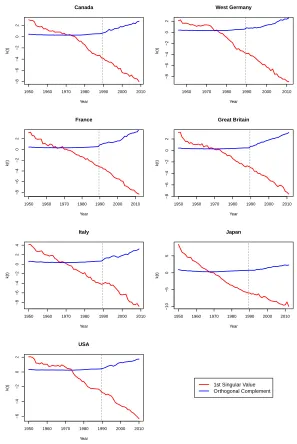
Figure 4 shows the projection of logged mortality rates for males onto the first prin-cipal component and its orthogonal complement. The latter measures other time trends. Although the orthogonal complement increases over time in most countries, the bulk of the trend is captured by the first principal component.
Demographic Research: Volume 34, Article 38
Figure 4: First principal component and orthogonal complement, males
1950 1960 1970 1980 1990 2000 2010
−8 −6 −4 −2 0 2 Canada Year k(t)
1960 1970 1980 1990 2000 2010
−8 −6 −4 −2 0 2 West Germany Year k(t)
1950 1960 1970 1980 1990 2000 2010
−8 −6 −4 −2 0 2 France Year k(t)
1950 1960 1970 1980 1990 2000 2010
−8 −6 −4 −2 0 2 Great Britain Year k(t)
1950 1960 1970 1980 1990 2000 2010
−8 −6 −4 −2 0 2 4 Italy Year k(t)
1950 1960 1970 1980 1990 2000 2010
−10 −5 0 5 Japan Year k(t)
1950 1960 1970 1980 1990 2000 2010
−6 −4 −2 0 2 USA Year
4. Discussion
The observed trends in life expectancy since 1990 show that life expectancy in the devel-oped world continues to rise in a monotonic, linear fashion, suggesting that the underlying structure of mortality decline has not changed. Further, this rise in life expectancy does not appear to have slowed compared to the historic trend as captured by the forecasts. We also find that male life expectancy has risen more rapidly than would be predicted using the standard Lee-Carter model, a feature that has been noted by others investigating the decline in the male-female difference in mortality (Wang and Preston 2009; Technical Panel on Assumptions and Methods 2011). The changes we observe in the separate-sex models cannot be explained by incorporating higher singular values into the model. The cause of the divergence between forecast and observed male life expectancy is uncertain. However, the cardiovascular revolution that began in the late 1960s is certainly part of the story. In general, CVD mortality among men has declined at a rate faster than in women (Roger et al. 2010; Parikh et al. 2009; Levi 2002). This lends itself to two hypotheses:
1. Improvements in the treatment of CVD and its risk factors since the 1980s – in-cluding use of ACE inhibitors, beta blockers, and statins – as well as advances in the care of myocardial infarction have generally benefitted men more than women. There has been some evidence for differential benefit, primarily in terms of uti-lization of new technologies in women versus men (Vaccarino et al. 2005; Gouni-Berthold et al. 2008).
2. Changes in health behavior, particularly tobacco use, has have occured more rapidly and dramatically among men than women and account, for this differential. This has recent support from work incorporating tobacco use into Lee-Carter forecast-ing (Preston and Wang 2006).
It is also notable that, while forecasts have diverged substantially from observed life ex-pectancy for males, they remain within prediction limits for combined sexes. While the evidence presented is not conclusive, it suggests that sex-composition effects may explain this particular observation.
Demographic Research: Volume 34, Article 38
References
Armstrong, G.L., Conn, L.A., and Pinner, R.W. (1999). Trends in infectious disease mortality in the United States during the 20th century. Journal of the American Medical Association 281(1): 61–66. doi:10.1001/jama.281.1.61. http://www.ncbi.nlm.nih.gov/pubmed/9892452.
Gouni-Berthold, I., Berthold, H.K., Mantzoros, C.S., B¨ohm, M., and Krone, W. (2008). Sex disparities in the treatment and control of cardiovascular risk factors in type 2 diabetes.Diabetes Care31(7): 1389–1391. doi:10.2337/dc08-0194.
Hyndman, R.J., Booth, H., and Yasmeen, F. (2013). Coherent mortality forecasting: The product-ratio method with functional time series models. Demography50(1): 261–
283. doi:10.1007/s13524-012-0145-5.
Hyndman, R.J. and Khandakar, Y. (2008). Automatic time series forecasting: The forecast package for R. Journal of Statistical Software 27(3): 1–22.
doi:10.18637/jss.v027.i03.
Lee, R. (1999). The Lee-Carter method for forecasting mortality, with various extensions and applications. North American Actuarial Journal 4(1): 80–93.
doi:10.1080/10920277.2000.10595882.
Lee, R.D. and Carter, L.R. (1992). Modeling and forecasting U.S. mortality. Journal of the American Statistical Association87(419): 659–671.doi:10.2307/2290204. Levi, F. (2002). Trends in mortality from cardiovascular and cerebrovascular
diseases in Europe and other areas of the world. Heart 88(2): 119–124.
doi:10.1136/heart.88.2.119.
Li, N. and Gerland, P. (2012). Modifying the Lee-Carter method to project mortality changes up to 2100. Paper presented at the Population Association of America.
Li, N., Lee, R., and Gerland, P. (2013). Extending the Lee-Carter method to model the rotation of age patterns of mortality decline for long-term projections. Demography
50(6): 2037–2051. doi:10.1007/s13524-013-0232-2.
Li, N. and Lee, R.D. (2005). Coherent mortality forecasts for a group of popu-lations: An extension of the Lee-Carter method. Demography 42(3): 575–594.
doi:10.1353/dem.2005.0021.
Olshansky, S.J. and Ault, A.B. (1986). The fourth stage of the epidemiologic transition: The age of delayed degenerative diseases. The Milbank Quarterly64(3): 355–391.
doi:10.2307/3350025. http://www.ncbi.nlm.nih.gov/pubmed/3762504.
population change.The Milbank Quarterly49(4): 509–38. doi:10.2307/3349375. Parikh, N.I., Gona, P., Larson, M.G., Fox, C.S., Benjamin, E.J., Murabito, J.M.,
O’Donnell, C.J., Vasan, R.S., and Levy, D. (2009). Long-term trends in my-ocardial infarction incidence and case fatality in the National Heart, Lung, and Blood Institute’s Framingham Heart study. Circulation 119(9): 1203–1210.
doi:10.1161/CIRCULATIONAHA.108.825364.
Preston, S., Heuveline, P., and Guillot, M. (2001). Demography: Measuring and model-ing population processes. Hoboken: Wiley.
Preston, S.H., Keyfitz, N., and Schoen, R. (1972).Causes of death: life tables for national population. Napier: Seminar Press.
Preston, S.H. and Wang, H. (2006). Sex mortality differences in the United States: The role of cohort smoking patterns. Demography 43(4): 631–646.
doi:10.1353/dem.2006.0037.
R Core Team (2012). R: A language and environment for statistical computing. Vienna: R Foundation for Statistical Computing. http://www.r-project.org/.
Roger, V.L., Weston, S.A., Gerber, Y., Killian, J.M., Dunlay, S.M., Jaffe, A.S., Bell, M.R., Kors, J., Yawn, B.P., and Jacobsen, S.J. (2010). Trends in incidence, sever-ity, and outcome of hospitalized myocardial infarction. Circulation121(7): 863–869.
doi:10.1161/CIRCULATIONAHA.109.897249.
RStudio (2012). RStudio : Integrated development environment for R. http://www.rstudio.org/.
Technical Panel on Assumptions and Methods (2011). Report to the Social Secu-rity Advisory Board. Tech. rep., Social Security Advisory Board, Washington, D.C. http://www.ssab.gov/Reports/2011 TPAM Final Report.pdf.
Tuljapurkar, S., Li, N., and Boe, C. (2000). A universal pattern of mortality decline in the G7 countries.Nature405(6788): 789–792.doi:10.1038/35015561.
University of California, Berkeley and Max Planck Institute for Demographic Research (no year). Human mortality database. www.mortality.org.
Vaccarino, V., Rathore, S.S., Wenger, N.K., Frederick, P.D., Abramson, J.L., Barron, H.V., Manhapra, A., Mallik, S., and Krumholz, H.M. (2005). Sex and racial differences in the management of acute myocardial infarction, 1994 through 2002. New England Journal of Medicine353(7): 671–682.doi:10.1056/NEJMsa032214.
Wang, H. and Preston, S.H. (2009). Forecasting United States mortality using cohort smoking histories. Proceedings of the National Academy of Sciences of the United States of America106(2): 393–398.doi:10.1073/pnas.0811809106.