www.ijper.org
Biomarker Quantification: Development of Fit for
purpose LC-MS/MS Method for Determination of
Methyl guanidine in Mice Urine
Mithbavkar Jay Rajaram1,Tapkir Amit Suryakant*1, Gaur Ashwani2, Chaudhary Pravin1 1Department of Quality Assurance Technique P.E.S. Modern College of Pharmacy, Pune-411044, Maharashtra, INDIA.
2Department of Drug metabolism and pharmacokinetic Advinus Therapeutics A TATA Enterprises, Pvt. Ltd. Pune, Maharashtra, INDIA.
ABSTRACT
Introduction: Accurate quantitation of biomarkers is always challenging, it becomes really tedious when biomarker has poor retention on chromatographic column and possess a chemical structure resistant for derivatisation. Methyl guanidine is product of protein catabolism, normally gets excreted in urine. Endogenous methyl guanidine concentrations in urine increases if there is reduce urine production or conversion of creatinine to methyl guanidine as proposed in patients with chronic renal failure. Increased level of methyl guanidine promotes apoptosis of renal proximal tubular cells in vitro, which in-turn could result in renal failure. Therefore Methyl guanidine can be considered as putative biomarker for renal failure studies. Method: Artificial urine was used as surrogate matrix for preparation of calibration standards, while quality control standards were prepared in authentic mice urine diluted 50 fold with artificial urine prior to extraction. For determination of basal levels of endogenous methyl guanidine urine samples from naïve mice were quantified. Moreover 50 fold dilution of quality control standards and study samples with artificial urine makes test matrix almost similar to that of calibration standards. Results: Developed method was found to linear 2ng/ml to 1000 ng/ml, with R2 more than 0.98.Basing on the mean endogenous basal levels of methyl guanidine determined in un-treated C57BL/6J mice urine, developed method can accurately quantify up to 10 fold up regulation and up to 20 fold down regulation of methyl guanidine concentrations. Conclusion: A fast, robust and cost effective LC-MS/ MS method was developed for determination of MG in mice urine. This is the first LC-MS/MS assay for direct quantitation of MG in mice urine samples. Approach followed for quantitation of MG is in-expensive over procurement of stable labeled standards, moreover 50 fold dilution of quality control standards and study samples with synthetic urine makes test matrix almost similar to that of calibration standards.
Key words: Methyl guanidine, Biomarker Quantification, Mice urine, Surrogate matrix,
Synthetic urine, LC-MS/MS method. DOI: 10.5530/ijper.52.4.78
Correspondence:
Tapkir Amit Suryakant, Department of Pharmaceutical Chemistry P.E.S. Modern College of Pharmacy, Pune. 411044.
Maharashtra, INDIA. Phone: +91-9970646090 E-mail: tapkiramit.s@gmail. com
INTRODUCTION
Accurate quantitation of biomarkers is always challenging, it becomes really tedious when biomarker has poor retention on chromatographic column and/or possess a chemical structure resistant for derivatisation. Literature suggests use of stable-labeled standard or usage of surrogate matrix for quantitation these endogenous molecules.1
Procurement/chemical synthesis of stable-labeled standards is expensive, and procedures
Submission Date: 10-09-2017;
Revision Date: 10-01-2018;
Accepted Date: 17-05-2018
followed to prepare to surrogate matrix sometimes renders test matrix (surrogate matrix) used for Calibration standards
signi-ficantly different from that study samples
them against calibration standards prepared in surrogate matrix.1,2
Methyl Guanidine (MG) is product of protein catabolism, normally gets excreted in urine. Endogenous MG concentrations in urine increases if there is reduced urine production or there is conversion of creatinine to MG, as proposed in patients with chronic renal failure.3,4
MG is also an important read out biomarker for Kidney
fibrosis model.5,6
Very few methods are available for quantitative deter-mination of MG in biological matrices. Marie et al.
published a method for quantification of MG in 1960
in plasma, that involves removal of protein with Ba (OH)2 /Zn SO4 , following by purification by strong
cation-exchange resin, methylation with dimethylsulfate
and finally sakaguchi reaction producing concentration
dependent pink coloration measured by spectropho-tometer.7 In 1973, Israel and coworker also reported
a colorimetric method to estimate MG concentrations in serum and urinary excretion in chronic renal failure
patients, with a modification of Voges-Proskauer reaction.8
In 1978, Yamamoto et al. developed high performance
liquid chromatographic procedure employing fluorometric
detection.9,10 Another method involves post column
derivatisation with aqueous ninhydrin solution.11 Most
of these analytical methods7-11 lack specificity,
selectivity and required sensitivity for sample analysis. Further these methods require more sample volume, are time consuming and arduous. Further, we could not
find any report utilizing Liquid chromatography Mass
spectrometry for determination of MG in biological
fluids, which is well-known for its sensitivity, selectivity
and precision. Developed method is simple, rapid and highly sensitive (LLOQ-2ng/ml). It is suitable for routine
analysis and perhaps the first LC-MS/MS based method
to quantify MG levels in mice urine. Material and method
Chemicals and reagents
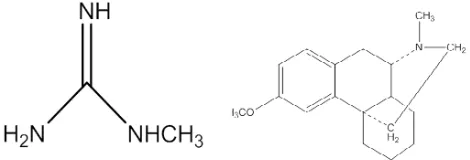
Methyl guanidine hydrochloride and Dextromethorphan hydrobromide monohydrate (IS) were purchased from sigma-aldrich (St. Louis, MO, USA). Chemical Structures for both analyte and internal standard are presented in Figure 1. Calcium chloride, sodium chloride, Potassium chloride, ammonium chloride, Disodium sulphate, potas-sium dihydrogen phosphate, creatinine and urea AR grade required for preparation synthetic urine were also purchased from sigma-aldrich (St. Louis, MO, USA).List of chemicals and their respective concentration used for the preparation of synthetic urine are shown in Table 1. All other solvents used in analysis were of LC-MS grade, Ammonium formate (Fluka), Acetonitrile,
meth-Figure 1: Chemical Structures for methyl guanidine (a) and Dextramethorphan (b) (internal standard)
anol and isopropyl alcohol, dimethyl sulphoxide were
obtained from JT Baker (California, USA). Purified water was obtained using water purification installation
system Milli-Q from waters. Un-treated C-57/6J mice urine samples were obtained from in-house vivarium. LC-MS Analysis
The liquid chromatograph (Prominence; Shimadzu,
Japan) was coupled to a triple quadrupole mass spectrometer with turbo electrospray ion source (API
3200, Applied Biosystems, Foster City, CA) used in positive ionization mode. Ion source parameters and optimized multiple reaction monitoring (MRM) param -eters for MG and Dextramethorphan are shown in Table 2. Chromatographic resolution of MG and IS
was achieved on waters HILIC (2.1 × 100mm, 5 µm)
column obtained from waters (USA).MG was eluted at
2.3 min and IS at 2.0 min by a gradient mobile phase system consisting of phase A (10mM Ammonium
formate) and phase B (acetonitrile). The gradient elution
was started with 80% mobile phase B for 0.5 min, after which the % B was linearly decreased from 80 to 20%
in 2 min, where it was held constant for 1.5 min. The gradient was then reversed back to initial conditions
in 0.1 min, and held for 1.4 min before the next injection.
Total run time was 5 min. The mobile phase was pumped
at a flow-rate of 0.5 mL/min and splitter was not used.
Data acquisition and analysis were performed using the analyst software version 1.5 (Applied Biosystem, Foster City, CA, USA).
Synthetic urine preparation
Synthetic urine was prepared as per composition shown in Table 1. All the listed chemicals were weighed and
dissolved in purified water from milliqwater system from water (Type-1). pH value of final solution was adjusted to 6.0 and filtered through 0.22µm filter paper.
It was stored at 2-8 °C until use.
Preparation of calibration and quality control standards
and detected well in positive polarity. The product ion spectrum of MG shows the formation of characteristic
daughter ions at m/z 57.2 and 43.1 generated via loss
of amine and methyl group respectively Figure 2(a). The product ion mass spectrum of internal standard dextramethorphan shows the formation of
charac-teristic product ions at m/z 147.2, 171.2, 211.5 and
215.2. Tentative structural assignments to daughter ions selected for developing MRM transitions are shown in Figure 2(b). To yield enhanced area counts two MRM transitions were clubbed for both analyte and IS.
METHOD DEVELOPMENT
There are no recent reports on LC-MS/MS based
method for quantification of MG in biological samples.
Previous published literature on analytical methodolo-gies indicated usage of ion-exchange chromatography/
colorimetric techniques/ HPLC with fluorescence
detection. Most of the methods based on these techniques
lack specificity, selectivity and adequate sensitivity for
sample analysis. Further these methods require more sample volume, are arduous andtime consuming. Considering the structure of MG, initially chemical derivatisation was tried with Diethydithiocarbamate
(DDTC),5% solution of DDTC was prepared with 0.2M sodium hydroxide to deritivise amine functional
group of MG, reaction mixture was incubated at 45°C
for 50 min to form adduct which was expected to improve ionization, chromatographic retention on column and extraction efficiency, but MG showed resis -tance to derivatisation. Hence with intent to quantify MG as such, extensive trials were made with available polar column chemistries, some of the columns those were tried includes Acclaim polar advantage, BDS Hypersil Phenyl, Zorbax PFP, Synergi Fusion and Separate weighing was made to prepare calibration and
quality control stock solutions. Working spiking solutions for calibration and quality controls standards were prepared
by appropriate dilution in acetonitrile-water (50:50, v/v,
diluent). The stock solutions and the spiking solutions
were stored at -20°C. IS working solution (1 µg/mL)
was prepared by diluting respective dimethyl sulphoxide
stock solution in acetonitrile. 2.5 µL of working spiking dilutions into 47.5 µL of syntheticurine to achieve final concentration of 2, 5,10,25,50,100,250,500 and 1000
ng/mL Quality control samples were made by spiking
5% of working solution in synthetic urine to achieve final concentration of 6,100,400 and 800 ng/mL. Addi -tionally, MG working spiking solutions was spiked at
10, 50, 500 and 1000 ng/mL in untreated mice urine, pre-diluted fifty fold with synthetic urine to validate
method performance in authentic sample matrix. Sample processing
The 150 µL of ice cold acetonitrile containing internal standard solution (1µg/mL of Dextromethorphan) was added to 50 µL of aliquot of spiked Calibration
curve/Quality control standards in centrifuge tubes.
Tubes were vortexed for 1min on VX-2500 multitube
vortexer (VWR Lab product pvt. Ltd, Mumbai) and the
centrifuged at 8000rpm for 10 min at 4⁰C (Centrifuge
5810R –Eppendorf Germany). 100 µL of supernatant
was transferred to HPLC vials for LC-MS/MS analysis.
RESULT AND DISCUSSION
Mass Spectrometry
Quantification of biomarker in biological matrices by LC-MS/MS is gaining significance due to better
selectivity and sensitivity of this technique over con-ventional radiometric assays.13 The product ion mass
spectrum of MG and Dextromethorphan (internal standard) are shown in Figure 2. [M+H]+ was the
predominant ion in Q1 spectrum and was used as precur-sor ion to obtain product ion spectra. Due to presence
of ionizable nitrogen, MG could easily be protonated
Table 1: Composition of artificial urine[12].
Compound Concentration (g/L)
Calcium Chloride. dihydrate 1.10
Sodium Chloride 2.92
Disodium sulphate 2.25
Potassium dihydrogen phosphate 1.40
Potassium chloride 1.60
Ammonium chloride 1.0
Urea 25.0
Creatinine 1.10
Figure 2: Product ion mass spectra and characteristic daughter ions used to develop MRM transitions of (a) methyl
Kinetex EVO from Phenomenex but best retention of MG with reasonable peak shape was achieved
on HILIC silica column from waters (Atlantis, 5 µm, 2.1× 100 mm), employing a gradient programme with mobile phase of 10mM ammonium formate and
acetonitrile. Dextramethorphan and verapamil both were tried as internal standard; however dextrametho-rphan showed more consistent mass spec response in
optimized chromatographic conditions.
Selection of surrogate matrix
Initial linearity trials were made in milliqwater, but later on it was replaced with synthetic urine. Synthetic urine devoid of MG was preferred to be used as surrogate
matrix over milliqwater because of its close proximity with authentic sample matrix.
Method Performance
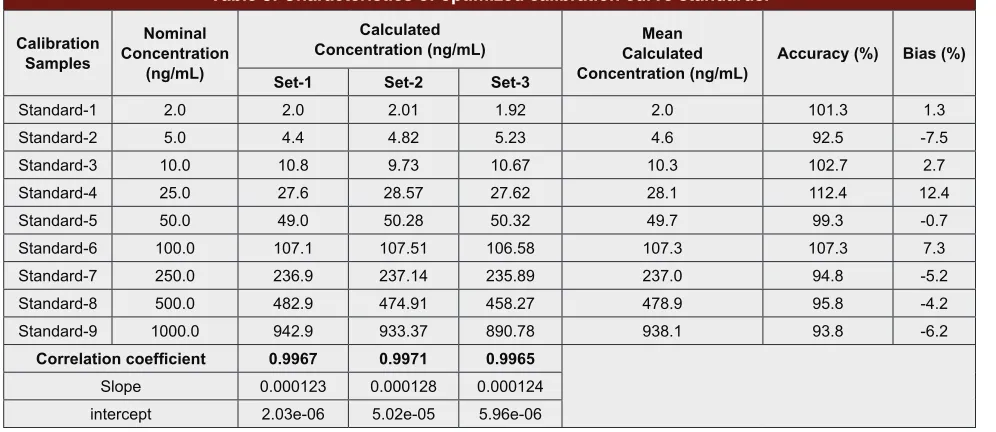
The nine point calibration curve for MG was linear over
the concentration range 2-1000 ng/mL. The calibration
model was selected based on the analysis of the data by linear regression with/without intercepts and weighing factors (1/x, 1/x2 and none). The best linear fit and
least-squares residuals for the calibration curve were achieved with 1/x2 weighing factor. Ruggedness of
the method was demonstrated set of three calibration
curves analyzed on separate day’s data shown in Table 3.
Intra-day and inter-day precision of the method was demonstrated by quality control samples spiked in
synthetic urine at concentration levels 6, 120, 400 and 800 ng/mL. Accuracy, relative standard deviation and %
bias is shown in Table 4. Selectivity and carry over
MRM chromatograms for MG and IS in double blank (a), LLOQ spiked in synthetic urine (b) and authentic
urine sample pre-diluted 50 fold with synthetic urine (c)
collected from naïve mice is shown in Figure 3. Selectivity of the developed method was performed in surrogate matrix. No interfering peak at retention time of MG and internal standard was observed against LLOQ standard.
Further, no quantifiable area counts were seen at
retention time of MG as well internal standard when
blank sample of synthetic urine was injected after
ULOQ calibration standard. Table 2: Retention times, MRM transitions,
and MS parameters for the determination of methyl guanidine and dextramethorphan (IS).
Compound guanidineMethyl Dextramethorphan
Retention time (min) 2.3 2.0
Parent Ion (M/Z)(Q1) 74.2 272.2 Daughter Ion (M/Z) (Q3) 57.2, 43.2 171.2, 147.2
Dwell time (ms) 200
Declustring Potential
(Volts) 30 53
Entrance Potential
(Volts) 10
Collision energy (Volts) 30 52 Collision cell exit
Potential (Volts) 10
Table 3: Characteristics of optimized calibration curve standards.
Calibration Samples
Nominal Concentration
(ng/mL)
Calculated
Concentration (ng/mL) CalculatedMean
Concentration (ng/mL) Accuracy (%) Bias (%)
Set-1 Set-2 Set-3
Standard-1 2.0 2.0 2.01 1.92 2.0 101.3 1.3
Standard-2 5.0 4.4 4.82 5.23 4.6 92.5 -7.5
Standard-3 10.0 10.8 9.73 10.67 10.3 102.7 2.7
Standard-4 25.0 27.6 28.57 27.62 28.1 112.4 12.4
Standard-5 50.0 49.0 50.28 50.32 49.7 99.3 -0.7
Standard-6 100.0 107.1 107.51 106.58 107.3 107.3 7.3
Standard-7 250.0 236.9 237.14 235.89 237.0 94.8 -5.2
Standard-8 500.0 482.9 474.91 458.27 478.9 95.8 -4.2
Standard-9 1000.0 942.9 933.37 890.78 938.1 93.8 -6.2
Correlation coefficient 0.9967 0.9971 0.9965
Slope 0.000123 0.000128 0.000124
Figure 3: MRM chromatograms for methyl guanidine (left pane) and dextramethorphan (right pane). (a) and (b) are chromatograms for double blank and LLOQ prepared with synthetic urine. Representative chromatogram (c) for
authen-tic urine sample pre-diluted 50 fold with syntheauthen-tic urine
Table 5: Selection of pre-dilution fold with synthetic urine (surrogate matrix).
Fold dilution with
synthetic urine mean ± SD RSD, % CV
10 fold 1701 ± 50 3.0
20 fold 1917 ± 47 2.5
50 fold 2034 ± 27 1.3
100 fold 2044 ± 58 2.9
50 fold dilution was selected based on SD and RSD
Table 4: Precision and accuracy of the developed method for quality control standards spiked in synthetic urine.
Nominal concentration
(ng/mL)
Intra-day Inter-day
Calculated concentration
(mean ± SD) (ng/mL)
Accuracy (%) % CVRSD, Bias (%)
Calculated concentration
(mean ± SD) (ng/mL)
Accuracy (%) % CVRSD, Bias (%)
6 5.6 ± 0.1 94.0 2.6 -6.0 5.6 ± 0.2 93.6 3.5 -6.4
120 109.4 ± 1.3 91.2 1.1 -8.8 113.6 ± 4.6 94.7 4.1 -5.3
400 356.7 ±2.7 89.0 0.8 -11.0 366.9 ± 10.5 91.7 2.9 -8.3
800 699.7 ±6.5 97.5 0.9 -12.5 734.1 ± 50.5 91.8 6.9 -8.2
Accuracy (%)= (average measured value/nominal value) × 100, Bias (%) = [(measured value-true value)/true value] × 100.
Selection of pre-dilution fold with surrogate matrix One lot of urine sample from un-treated mice was collected and dilution fold selection exercise was
performed at 10, 20, 50 and 100 folds. Dilution samples
at each fold dilution was executed in triplicate and read against calibration curve spiked in synthetic urine as
shown in Table 5. Fifty fold was selected as final pre-dilution factor for processing, since fifty fold dilution
showed relatively lower values for standard deviation and relative standard deviation. Further, selection of
fifty fold as pre-dilution step also looks appropriate as it is expected to reduce matrix effect significantly.
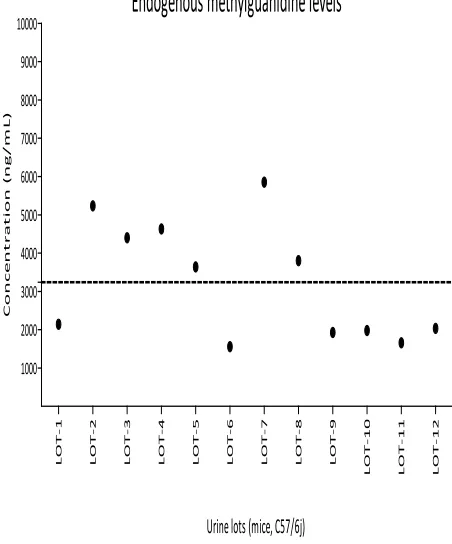
Determination of endogenous levels
Endogenous level of MG was established with 12 lot urine samples from 12 different naïve animals. These
were processed with 50 fold pre-dilution with synthetic
urine and determined against calibration curve prepared in synthetic urine. Endogenous level of MG in naïve
mice urine samples was found to be 3.2 ±1.5 µg/mL.
Endogenous methylguanidine levels
C
o
nc
e
nt
r
a
t
io
n (
ng
/
m
L
)
L
OT-1
L
OT-2
L
OT-3
L
OT-4
L
OT-5
L
OT-6
L
OT-7
L
OT-8
L
OT-9
L
OT-1
0
L
OT-1
1
L
OT-1
2
1000 2000 3000 4000 5000 6000 7000 8000 9000 10000
Urine lots (mice, C57/6j)
Figure 4: Methyl guanidine concentrations from 12 different lots of urine sample collected from un-treated C57/6j mice.
Samples were diluted 50 fold with synthetic urine prior to
processing and quantified against calibration curve spiked in
Table 6: Methyl guanidine concentrations from 12 different lots of urine sample collected from un-treated C57/6j mice. Samples were diluted 50 fold
with synthetic urine prior to processing and
quantified against calibration curve spiked in
synthetic urine alone as surrogate matrix.
Mice urine blanks MG Concentration (µg/mL)
Lot-1 2.1 Lot-2 5.2 Lot-3 4.4 Lot-4 4.6 Lot-5 3.6 Lot-6 1.6 Lot-7 5.9 Lot-8 3.8 Lot-9 1.9 Lot-10 2.0 Lot-11 1.7 Lot-12 2.0
mean ± SD 3 ± 1.5
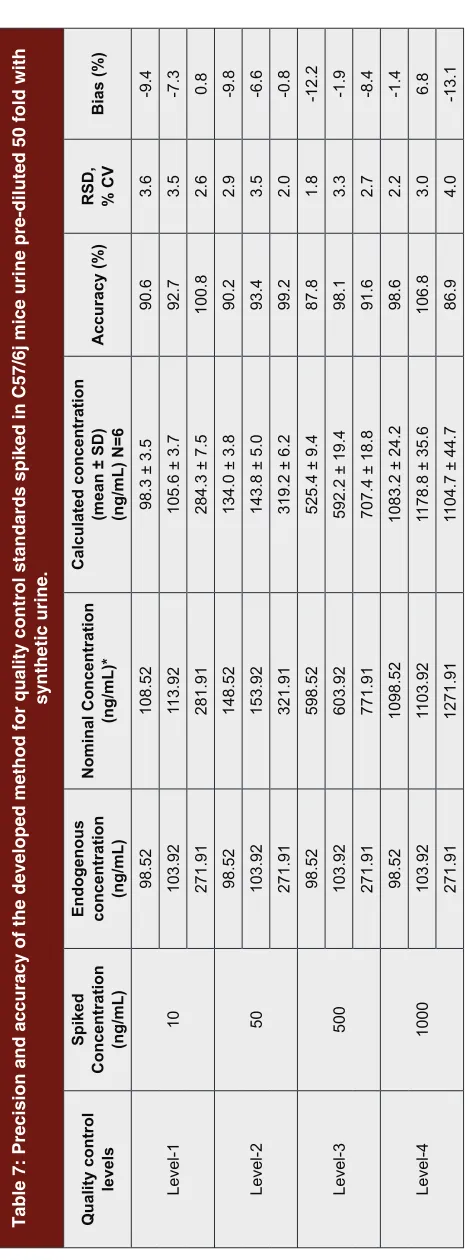
Table 7: Precision and accuracy of the developed method for quality control standards spiked in C57/6j mice urine pre-diluted 50 fold with
synthetic urine. Quality control levels Spiked Concentration (ng/mL)
Endogenous concentration (ng/mL)
Nominal Concentration
(ng/mL)*
Calculated concentration
(mean ± SD) (ng/mL) N=6
Accuracy (%)
RSD, % CV
Bias (%)
Level-1
10
98.52
108.52
98.3 ± 3.5
90.6
3.6
-9.4
103.92
113.92
105.6 ± 3.7
92.7
3.5
-7.3
271.91
281.91
284.3 ± 7.5
100.8 2.6 0.8 Level-2 50 98.52 148.52
134.0 ± 3.8
90.2
2.9
-9.8
103.92
153.92
143.8 ± 5.0
93.4
3.5
-6.6
271.91
321.91
319.2 ± 6.2
99.2 2.0 -0.8 Level-3 500 98.52 598.52
525.4 ± 9.4
87.8
1.8
-12.2
103.92
603.92
592.2 ± 19.4
98.1
3.3
-1.9
271.91
771.91
707.4 ± 18.8
91.6 2.7 -8.4 Level-4 1000 98.52 1098.52
1083.2 ± 24.2
98.6
2.2
-1.4
103.92
1103.92
1178.8 ± 35.6
106.8
3.0
6.8
271.91
1271.91
1104.7 ± 44.7
86.9
4.0
-13.1
* Nominal concentration= spik
ed concentration+endogenous concentration,
Ac
curacy (%) = (average measured value/nominal value
) × 100, Bias (%) = [(
measured value-true value
)/true value
] × 100.
Spread of MG endogenous levels with a batch of 12 lots is shown in Figure 4, while individual values are listed in Table 6.
Method performance with authentic sample matrix
To asses method precision in quantification MG levels
modulations in authentic urine samples, MG standard was spiked in urine sample at four concentration
levels covering the entire calibration range and quantified
against calibration curve prepared with synthetic urine. Similar exercise was performed three times on different days and results are shown in Table 7. Method showed robust performance at all four tested concentration levels. Developed method can accurately quantify upto 6 fold up regulation and 16 fold down regulation of endogenous MG concentrations of untreated mice.
CONCLUSION
A fast, robust and cost effective LC-MS/MS method was developed for determination of MG in mice urine.
This is the first LC-MS/MS assay for direct quantitation
of MG in mice urine samples. Approach followed for quantitation of MG is in-expensive over procurement
of stable labeled standards, moreover 50 fold dilution
3. Sorrentino R, Pinto A. Effect of methylguanidine on rat blood pressure: role of endothelial nitric oxide synthase. British Journal of Pharmacology. 1995;115(3):510-14.
4. Ozasa H, Horikawa S, Ota Kazuo. Methylguanidine Synthase from Rat Kidney Is Identical to Long –Chain L-2-Hydroxy Acid Oxidase. Nephron. 1994;68(2):279.
5. Wang F, Yang B, Ling G H, Yao C, Jiang YS. Methylguanidine Cytotoxicity on HK-2 cells and protective effect of antioxidants against MG-induced apoptosis in renal proximal tubular cells in vitro. Ren Fail. 2010;32(8):978-85. 6. Yokozawa T, Fujitsuka N, Oura H. Production of methylguanidine from
creatinine in normal rats with renal failure. Nephron.1990;56(3):249-54. 7. Carr MH, Schloerb PR. Analysis for Guanidine and Methylguanidine in
Uremic Plasma. Analytical Biochemistry.1960;1(3):221-7.
8. Stein IM, Micklus MJ. Concentrations in Serum and Urinary Excretion of Guanidine, 1-Methylguanidine, and 1,1-Dimethylguanidine in Chronic Renal Failure. CLIN.CHEM. 1973;19(6):583-5.
9. Yamamoto Y, Saito A, Manji T, Nishi H, Ito K, Maeda K, et al. A new automated analytical method for guanidino compounds and their cerebrospinal fluid levels in uremia. Am. Soc. Artif. Intern.Organs. 1978;24(1):61-9.
10. Yamamoto Yukio, Saito Akira, Manji Tadatomi, Maeda Kenji, Ohta Kazuhiro. Quantitative analysis of methylguanidine and guanidine in physiologic fluids by high performance liquid chromatography-Fluorescence detection method. Journal of Chromatography. 1979;162(1):23-9.
11. Hiraga Y, Kinoshita T. Post-column derivatisation of guanidine compounds in high-performance liquid chromatography using ninhydrin. Journal of chromatography. 1981;226(1):43-51.
12. Parra Kenia N, Gul Saima, Aquino Jose M, Miwa Douglas W, Motheo Artur J. Electrochemical degradation of tetracycline in artificial urine medium. J Solid state Electrochem. 2016;20(4):1011-9. DOI 10.1007/s10008-015-2833-8. 13. Quotient Bioresearch. A generic approach to the validation of small molecule
LC-MS/MS Biomarker Assays. Drug Discovery/Development & Delivery. 2010. Summer 2010, 32-34
ACKNOWLEDGEMENT
Authors wish to acknowledge the support received from Dr. Chaudhary Pravin Principal of modern college of pharmacy nigdi pune, Authors also wish to acknowledge help received from Mr. Ashwani gaur Principal Scientist
–II Drug metabolism and pharmacokinetic department
and Advinus Therapeutics Limited, Pune.
CONFLICT OF INTEREST
The authors have no conflict of interests to report.
ABBREVIATIONS
MG: Methyl Guanidine, LC-MS/MS: Liquid Chroma-tography and Mass Spectrometry, ng/ml-nano gram per millilitre, μL: micro liter, mM: milimolar.
REFERENCES
1. Van de Merbel NC. Quantitative determination of endogenous compounds in biological samples using chromatographic techniques.Trends in Analytical Chemistry. 2008;27(10):924-33.
2. Jones BR, Schultz GA, Eckstein James A, Ackermann Bradley L. Surrogate matrix and surrogate analyte approaches for definitive quantitation of endogenous biomolecules. Bioanalysis. 2012;4(19):2343-56.
. SUMMARY
• The present work deals development of fit for pu pose
A fast, robust and cost effective LC-MS/MS method was developed for determination of MG in mice urine.
This is the first LC-MS/MS assay for direct quantitation
of MG in mice urine samples. Approach followed for quantitation of MG is in-expensive over procurement of stable labeled standards
• The LC-MS/MS method development and validation parameters were observed and evaluated. All the
obser-vations are within the specified limits. Moreover 50 fold
dilution of quality control standards and study samples with synthetic urine makes test matrix almost similar to that of calibration standards. Developed method can accurately quantify upto 6 fold up regulation and upto 16 fold down regulation of MG
• Mobile phase consists of 10mM Ammonium formate
and Acetonitile (Gradient programme) at flow rate of 0.5 ml/min. The retention time for methyl guanidine and dextromethorphan was found to be 2.3 and 2.0
respectivly. The nine point calibration curve for MG
was linear over the concentration range 2-1000 ng/mL.
The calibration model was selected based on the
analy-sis of the data by linear regression r20.9968.
• The validation of developed method shows that the selectivity, accuracy and precision recovery in surrogate and authentic matrix is same and within the acceptance limit,
Mr. Jay Rajaram Mithbavkar: Master of pharmacy: Dept of quality assurance technique Modern college of pharmacy nigdi pune.
About Authors
PICTORIAL ABSTRACT
Cite this article:Jay RM, Amit ST, Ashwani G, Pravin C. Biomarker Quantification: Development of Fit for purpose LC-MS/MS Method for Determination of Methyl guanidine in Mice Urine. Indian J of Pharmaceutical Education and Research. 2018;52(4):676-83.
Dr. Praveen D. Chaudhari: Principal and Professor in Pharmaceutics, P. E. Society’s Modern College of Pharmacy, Pune. Dr. pravin has UG -18 Years & P.G. 12 Years teaching Experience. Dr. pravin has granted two patents and has 124Research publication 25 Review Articles. In 2011 he awarded with IDMA AWARD 2011 For Best Research Paper in Pharmaceutics: Stabilization of amorphous form of poorly water-soluble drug and hence solubility Enhancement using Polaxomer-188 and Gelucire-50/13, feb2011.
![Table 1: Composition of artificial urine[12].](https://thumb-us.123doks.com/thumbv2/123dok_us/8924088.1844522/3.612.316.549.56.202/table-composition-of-artificial-urine.webp)