Structural characterization of amylose-long chain fatty acid complexes produced
via
the acidification method
Shiran Zabar
a, Uri Lesmes
b,c, Itai Katz
d, Eyal Shimoni
b,c, Havazelet Bianco-Peled
a,c,* aDepartment of Chemical Engineering, Technion-Israel Institute of Technology, Haifa 32000, IsraelbDepartment of Biotechnology and Food Engineering, Technion-Israel Institute of Technology, Haifa 32000, Israel cThe Russell Berrie Nanotechnology Institute, Technion-Israel Institute of Technology, Haifa 32000, Israel dDepartment of Chemistry, Technion-Israel Institute of Technology, Haifa 32000, Israel
a r t i c l e
i n f o
Article history:
Received 13 August 2009 Accepted 30 October 2009
Keywords:
Amylose inclusion complexes Lamellar model
Encapsulation
Small angle X-ray scattering (SAXS) Unsaturated fatty acids
a b s t r a c t
Amylose molecular inclusion complexes, or V-amylose, have been studied as a possible nano-sized delivery system for unsaturated fatty acids. This study aimed to study three different structural levels of V-amylose produced via an acidification method. Molecular attributes were studied using XRD, DSC and13C CP/MAS NMR, nanostructures using SAXS and AFM, and the microscopic level by SEM and AFM.13C labeled fatty acids revealed head groups were entrapped in both COO- and COOH forms. SAXS data, showed that conjugated linoleic acid yield particles with the highest values for parameters like average crystalline lamellar thickness (4¼0.46) and characteristic particle dimension (Rg¼1011). AFM revealed surface roughness increases from 7.724.34 nm to 11.546.05 nm during the formation of V-amylose. The insights described contribute to the understanding of V-amylose structure and help establish a model for V-amylose structure which may prospectively be used in the fabrication of a novel delivery system.
Ó2009 Elsevier Ltd. All rights reserved.
1. Introduction
Consumption of poly-unsaturated fatty acids (PUFA) has been enthusiastically advocated due to their essential role in human health. Studies have shown PUFA support improved performance of the immune system, reduce blood pressure, decrease the chance for heart attacks and the recurrence rate of certain cancers (Shahidi & Miraliakbari, 2004, 2005). Familiar to the public as omega 3 and omega 6 fatty acids, PUFA include 2 or 3 methylenes interrupted by double bonds which render them susceptible to heat, light and oxidation. PUFA cannot be synthesized by the human body and should be provided with the diet however the daily uptake is, on average, lower than the recommended amount. Enrichment of food products with PUFA is a challenging technological task due to their tendency to degrade and autoxidize at high rates during production, storage, and passage in the digestive system. Various encapsulation platforms have been suggested to be suitable for the controlled delivery of lipophilic nutraceuticals such as PUFA and omega 3 rich oils (Barrow, Nolan, & Jin, 2007; Lalush, Bar, Zakaria, Eichler, & Shi-moni, 2005; McClements, Decker, & Weiss, 2007; Semo, Kesselman,
Danino, & Livney, 2007). This study focused on amylose-based molecular inclusion complexes or V-amylose as a prospective controlled delivery system for PUFA, as suggested in previous work (Lalush et al., 2005; Lesmes, Barchechath, & Shimoni, 2008; Lesmes, Cohen, Shener, & Shimoni, 2009; Zabar, Lesmes, Katz, Shimoni, & Bianco-Peled, 2009).
The molecular organization of amylose complexes with various fatty acids has been studied extensively and complex formation has been shown to be affected by parameters such as complexation temperature and lipid structure (monoglyceride or free fatty acid), with increased fatty acid (FA) chain length and decreased unsatu-ration increasing V-amylose thermal stability (Biliaderis & Galloway, 1989; Godet, Buleon, Tran, & Colonna, 1993; Godet, Bizot, & Buleon, 1995; Tufvesson, Wahlgren, & Eliasson, 2003b). Also, two main crystalline polymorphic forms have been identified. Type I is considered to be amorphous, while the semi-crystalline type II displays three peaks at Bragg angles of 7.4, 13.1and 19.8in its
X-ray diffraction pattern (Biliaderis & Galloway 1989; Lesmes et al., 2009). However, the nanostructure of V-amylose has been explored to a lesser extent compared to its molecular structure. Transmission electron microscopy (TEM) micrographs of amylose fatty acid complexes revealed uniaxial layout of amylose molecules, which were locally interrupted by amorphous segments with a thickness of no more than 4.6 nm (Godet, Bouchet, Colonna, Gallant, & Buleon, 1996). Other studies suggest amylose–alcohol complexes have *Corresponding author. Department of Chemical Engineering, Technion-Israel
Institute of Technology, Haifa 32000, Israel. Tel.:þ972 4 8293588; fax:þ972 4 8295672.
E-mail address:[email protected](H. Bianco-Peled).
Contents lists available atScienceDirect
Food Hydrocolloids
j o u r n a l h o m e p a g e : w w w . e l s e v i e r . c o m / l o c a t e / f o o d h y d
a lamellae folding length of about 10 nm (Biliaderis & Galloway 1989; Jovanovich & Maria, 1999). Recently AFM work has shown that V-amylose also exhibits an aggregative nature, with aggregates being comprised of small spherulites ofw50–100 nm, lamellae of a few microns in length andw10 nm of thickness and some other ill-defined structures (Lalush et al., 2005; Lesmes et al., 2009).
Understanding the structure and physicochemical properties of V-amylose is believed to be important for the future design and fabrication of such systems (Lesmes & McClements, 2009; Mccle-ments, Decker, & Park, 2009; McCleMccle-ments, Decker, Park, & Weiss, 2008). Accordingly, we have already investigated the effect of guest chemistry on the structure of V-amylose inclusion complexes produced via dilution of dimethylsulfoxide (Zabar et al., 2009). To the best of our knowledge, this was the first study to combine molecular level investigations with nanostructure and microscopic characterization. The effect of fatty acid unsaturation on V-amylose structure has been shown to span throughout the different struc-tural strata studied. In the current study, we broaden our previous research toward a different production method more suitable for food applications. Thus, amylose complexes with fully saturated 18:0 stearic acid (SA), 18:2 linoleic acid (LA) and naturally occurring 18:2 conjugated linoleic acid isomer mixture (CLA) were produced using a previously described acidification method. X-ray diffraction (XRD),13C solid sate CP/MAS NMR and differential scanning calo-rimetry (DSC) were used to study the molecular organization and thermal properties of the amylose complexes produced while Small angle X-ray scattering (SAXS), scanning electron microscopy (SEM) and atomic force microscopy (AFM) probed the nano and micro structures of the complexes. The effect of the production method as well as the effects of the various guest molecules on the structural characteristics is discussed.
2. Experimental
2.1. Materials
2.1.1. Potato amylose (Av. DP 900)
Potato Amylose (Av. DP 900) is essentially free of amylopectin was purchased from Sigma Co., Israel (A0512) and used as received.
2.1.2. Long chain fatty acids
The complexation experiments were conducted using three different fatty acids of various degrees of unsaturation. Fully satu-rated 18:0 (18 carbons and 0 double bonds) stearic acid (SA) (Sigma S-4751), 18:2 cis-9,cis-12-octadecadienoic acid or linoleic acid (LA) (Sigma L-1376); and 18:2 mixture of cis-and trans-9,11 and 10,12-octadecadienoic acids or conjugated linoleic acid (CLA) (a mixture of cis-and trans-9,11 and10,12-octadecadienoic acids. Linoleic acid <1%) – (Sigma O-5507); all of at least 99% purity. Additionally, molecular level studies aimed at determining the positioning of fatty acid in V-amylose used uniformly labeled13C18-stearic acid (605 581) and uniformly labeled13C18-linoleic acid (605 735), both with at least 99% isotope enrichment were used. Complexes Produced with these fatty acids were used in solid state13C CP/MAS NMR experiments.
2.1.3. Other reagents
Potassium Hydroxide (KOH), Hydrochloric Acid (HCl), and all other reagents were analytical grade chemicals.
3. Methods
3.1. Formation of V-amylose molecular inclusion complexes
Production of V-amylose complexes via acidification of an alkali solution mixture of amylose and guest fatty acid dilution was
carried out based on a method previously described (Eliasson & Krog, 1985; Karkalas, Ma, Morrison, & Pethrick, 1995; Lalush et al., 2005). 600 mg of amylose were dissolved in 40 mL of preheated (90C) 0.1 M KOH then cooled to crystallization temperature of
30C, 60C or 90C. Similarly, an alkali fatty acid (FA) solution
(60 mL, 1 mg/ml, 0.1 M KOH) preheated to 90C, was cooled to the
same crystallization temperature of 30C, 60C or 90C and then
mixed together with amylose solution. The solution mixture was titrated under gentle stirring to a final pH of 4.7 using 2 M HCl solution. The resulting suspension was incubated at a constant temperature for 24 h under gentle stirring. At the end of incubation phase, the suspension was cooled to 25C.
3.1.1. Separation of the complexes
Separation of the V-amylose from the suspensions was done by centrifugation (2000 g, 20 min). The wet pellet was washed using 50% ethanol/water mixture (v/v) and centrifuged as before. This step was repeated three times to remove residues of uncomplexed FA, and to obtain salt-free complexes, before the resulting pellet was transferred to petri dishes, freeze dried and pulverized into a fine powder.
3.2. Molecular level investigations
Investigation of the molecular level characteristics of the amylose-FA complexes powders produced was studied through X-ray diffraction (XRD),13C solid state CP/MAS NMR (ssNMR) and differential scanning calorimetry (DSC). These methods have already been successfully and extensively used by others to verify formation and study V-amylose inclusion complexes (Biais, Le Bail, Robert, Pontoire, & Buleon, 2006; Bulpin, Welsh, & Morris, 1982; Godet, Bizot, et al., 1995; Godet et al., 1993; Godet, Tran, Colonna, Buleon, & Pezolet, 1995; Jouquand, Ducruet, & Le Bail, 2006; Kawada & Marchessault, 2004; Lalush et al., 2005; Le Bail, Rondeau, & Buleon, 2005; Tozuka et al., 2006).
The formation of a V type amylose-FA complex was verified by measuring the X-ray diffraction of powders produced from the suspensions. These XRD measurements were carried out on a Philips PW 3020 powder diffractometer equipped with a graphite crystal monochromator (Philips, The Netherlands). The operating conditions were CuKa1 radiation (
l
¼0.154 nm), voltage 40 kV and current40 mA. Approximately 200 mg of sample powders were loaded onto a poly(methyl methacrylate) plate and scanned over the angular range of 2
q
from 5to 35with step size 0.02. Counting time was 4 sper step.
The thermal properties of the amylose-FA complexes were studied by DSC. These were obtained from the heating curves of obtained for 7 mg of powdered sample suspended using 21 mg of double distilled water placed in a sealed stainless steel DSC pan (Perkin–Elmer stainless steel pressure-tolerant pans). These curves were determined using a Perkin Elmer DSC- 7 system (The Perkin Elmer corp., Norwalk Conn, USA). The system was first calibrated using Indium and then samples were measured against a 20 mg pure water reference pan. Samples were scanned from 25C to
150C with a 5C/min ramping. The transition temperatures and
enthalpies were calculated using the Pyris thermal analysis system version 3.72 of Perkin Elmer LLC.
3.3. Nanometric level investigations
In order to study the structural properties of the amylose-FA complexes at the nanometric level small angle X-ray scattering (SAXS) was used. These analyses probed the nanostructure of amylose-FA complexes at two states: lyophilization dry powder and the powder suspended in distilled water.
SAXS experiments were performed with CuaK radiation at an
acceleration voltage of 20 kV and current of 10 mA radiating through a 20
m
m entrance slit leading to the collimation block, with slit length delimiters set at 15 mm. The X-ray scattering was collected using compact Kratky camera having a linear position sensitive detector system (Raytech) with pulse-height discrimination and a multichannel analyzer (Nucleos). Prior to analysis amylose-FA complex samples were suspended in miliQ water overnight and then placed in sealed quartz capillaries with 2 mm diameter (Muller). During measurments sample temperature was kept at 25C by a temperature controller (A. peer Co.).Scattering data was used to generate scattering curves, expressed in term of the scattering intensity I as a function of the scattering vector s¼2sin
q
/l
. Normalization of the data was ach-ieved using data obtained from the scattering of water as a stan-dard. The background was determined empirically using Equation(1)given by Balata-Calleja and Vonk (Balata-Calleja & Vonk, 1989), in whichk1andk2are empirical constants.
I ¼ k1þk2ðsÞn (1)
The background intensity was subtracted from the raw data. The correction of the effect of the beam dimension (desmearing) was performed according to the Indirect Transformation Method (Glatter, 1977; Porod, 1982) using the program ITP. Data analysis was based on fitting of the desmeared curve to an appropriate model using a least-square procedure.
3.4. Microscopic level investigation
The microscopic organization of the different amylose-FA complexes was done by Scanning Electron Microscopy (SEM) and Atomic Force Microscopy (AFM). SEM micrographs were obtained using a JEOL SEM (5400 model) from dry powders of amylose-FA complex samples sputter coated with gold, in an acceleration voltage of 15 kV. AFM images were obtained for samples dried on a mica specimen slide. Basically, right after the production of the amylose-based suspensions, 2
m
L of each sample were mounted on a freshly-cleaved mica slide (SPIChemÔMica, Grade V-4, 9.9 mm discs0.15 mm thick; West Chester, PA) attached to a plastic slide. These slides were then covered (to prevent any particles from the air to sediment on the mica) and allowed to dry overnight, before being placed on the AFM table for scanning. The air dried mica specimens were then observed on a JPK Nano Wizard II AFM (JPK Instruments Inc., Germany). Scanning was performed in a constant temperature in air while operating at contact mode using an uncoated Si probe (m
Masch CSC21/NoAI, Spain; tip curvatureRc<10 nm; typical force constant 2 N/m). AFM images were pro-cessed using SPM image processing software version 3 (JPK Instruments AG) which was also used to calculate the particle surface roughness. In order to obtain a representing data set for each sample multiple measurements were done on various images, generating at least 60 different measurements. All measurements were done by making cross sections (1
m
m cross sections done in at least 6 different angles) of aggregates in various 3m
m 3m
m images of each sample. Average values were calculated using Microsoft Excel software which was also used for the statistical comparison between values measured for different samples.4. Results and discussion
4.1. XRD, DSC and13C CP/MAS NMR – molecular level investigations
X-ray diffraction was used in order to verify the formation of the amylose-FA molecular inclusion complexes. The diffractograms (Fig. 1) confirm the formation of V type structures, as inferred from the peaks at Bragg angles of 2
q
¼7.4, 13.1and 19.8. Thedif-fractograms of amylose complexes with SA did not seem to be affected by crystallization temperatures. Contrary, diffractograms arising from complexes hosting LA or CLA and crystallized at 90C
showed additional low-intensity peaks at Bragg angles of 2
q
¼14.9,17.1and 22.6. This observation suggests that a high crystallization
temperature induces the formation of A-type amylose crystals along side with the V type structures. All complexes hosting SA show an additional peak at a Bragg angle of 2
q
¼21.7, which some studies30°C 90°C 60°C
30°C 90°C 60°C
b
c
Intensity (counts/sec)
Intensity (counts/sec)
Intensity (counts/sec)
30°C 90°C
60°C
a
0 500 1000 1500 2000 2500 3000 3500 4000
0 5 10 15 20 25 30 35
0 500 1000 1500 2000
0 5 10 15 20 25 30 35
0 500 1000 1500 2000 2500
0 5 10 15 20 25 30 35
2 (degree)
2 (degree)
[image:3.595.324.550.254.721.2]2 (degree)
(Biliaderis & Galloway 1989; Horii, Yamamoto, Hirai, & Kitamaru, 1987; Karkalas et al., 1995; Le Bail et al., 2005; Raphaelides & Kar-kalas, 1988) attribute to V-amylose polymorphism. It should be noted that the presence of uncomplexed FA can be excluded from the XRD data. This additional peak complies, to some extent, with that of pure SA probably physically trapped and not molecularly included, as recently suggested (Lesmes et al., 2009). This was not observed in the case of LA and CLA probably since they are not crystalline at room temperature.
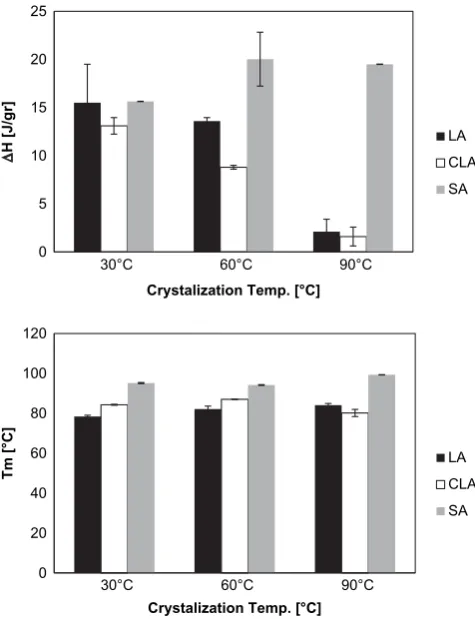
The thermal behavior of the complexes was studied by DSC.Fig. 2
summarizes the melting temperatures and the enthalpies calcu-lated from the thermograms obtained. As can be seen, the melting temperature increases slightly with increasing the production temperature, in agreement with previous reports (Eliasson, 1994;
Karkalas et al., 1995; Tufvesson, Wahlgren, & Eliasson, 2003a). The melting temperatures of the complexes seem to be correlated with the melting temperature of the fatty acids (LA<CLA<SA), however this dependence is not statistically significant. Notably, the melting enthalpy of the SA complexes crystallized at 60C and 90C is much
higher than the other two FA’s, which may suggest higher degree of crystallinity. The differences between the thermal behavior of the amylose-CLA and amylose-LA complexes are much less pronounced, as can be expected from their chemical similarity.
In the past years there has been a growing number of studies utilizing solid state13C CP/MAS NMR to probe the molecular level attributes of the V-amylose complexes with various ligands, mainly revealing insights regarding the host amylose (Biais et al., 2006; Biliaderis & Galloway 1989; Gidley & Bociek, 1988; Kawada & Marchessault, 2004; Snape, Morrison, Maroto-Valer, Karakals, & Pethrick, 1998). In this study, analysis of the solid powders was achieved by direct excitation of the13C nuclei and by1H–13C cross polarization (CP)13C magic angle spinning (MAS) NMR according to assignments previously described (Snape et al., 1998) and cross referenced with data from the Spectral Database for Organic Compounds (http://riodb01.ibase.aist.go.jp/sdbs/, National Institute of Advanced Industrial Science and Technology, accessed January 2nd, 2007). These experiments helped produce13C NMR spectra for amylose complexes with stearic acid or linoleic acid (Fig. 3), which concur with previous work (Kawada & Marchessault, 2004; Snape et al., 1998; Zabar et al., 2009).
As can be seen inFig. 3, the differences in the guest, namely of the fatty acid, were expressed in the13C NMR spectra of the samples. The first observation made was that the resolution of the C1 and C4 carbons of amylose was highly sensitive to the guest type. This was noted both for13C direct excitation and CP NMR spectra. In this respect, amylose complexes with linoleic acid yielded more resolved spectra than complexes produced with stearic acid. A similar and parallel trend, expressed in signal resolution, was also noted for the peaks assigned to the carbons of the fatty acids in the chemical shift range of 15–35 ppm. A possible explanation to these differences might be the mobility of the molecules in the samples which is generally considered to be inversely related to solid state NMR peak resolution. If so, one can argue that the data implies that both the amylose and the entrapped fatty acid have increased molecular mobility in the case of saturated stearic acid compared to the unsaturated linoleic acid. However, a reservation has to be made since solid state NMR peak resolution is directly related to the spatial localizability of the samples and vis a vi to molecular mobility depending on the molecules in question. Thus, it would be better to state that the findings directly suggest that amylose complexes produced with linoleic acid produce more spatially defined structures than complexes produced with stearic acid. 0
5 10 15 20 25
30°C 60°C 90°C
H [J/gr]
Crystalization Temp. [°C]
LA
CLA
SA
0 20 40 60 80 100 120
30°C 60°C 90°C
Tm [°C]
Crystalization Temp. [°C]
LA
CLA
[image:4.595.39.277.65.375.2]SA
Fig. 2.The dependence of the average melting temperatures (bottom panel) and the melting enthalpies (top panel) on the crystallization temperature of amylose com-plexed LA, CLA and SA.
180 160 140 120 100 80 60 40 20 ppm 180 160 140 120 100 80 60 40 20 ppm
A
B
Guest=LA
Guest=SA
Guest=LA
Guest=SA
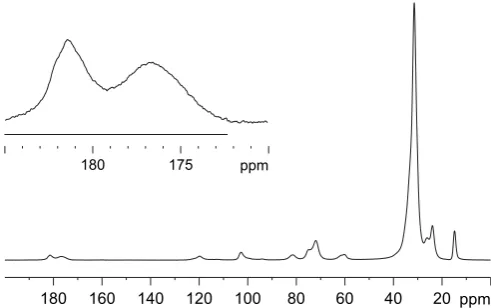
[image:4.595.113.477.595.728.2]Further molecular investigation of the structure of amylose complexes was achieved through the use of stearic acid and linoleic acid uniformly labeled with 13C. The corresponding complexes formed with these13C lablled FA’s were subjected to XRD analysis which is given inFig. 4. These XRD patterns fully correspond to various previously described studies (Conde-Petit, Escher, & Nuessli, 2006; Lalush et al., 2005; Lesmes et al., 2009; Zabar et al., 2009), thus, verifying the formation of a V type structure. Following these results and those previously described (Zabar et al., 2009), these samples were also subjected to solid state13C NMR experiments. The spectra obtained were used not only as a basis of comparison with previous studies but also to help provide some insights regarding the molecular state of the included fatty acid. Thus,13C CP/MAS NMR spectra of amylose-13 C-u-SA, given inFig. 5, did not show any marked changes in the chemical shift of the carbons assigned to the fatty acid tail. A slight difference was noted in the carboxyl carbon, which was expected to appear as a single peak in the range of 175–178 ppm since the fatty acids in question had pKa values of over eight (Kanicky & Shah, 2002) and the complexes where produced at slightly acidic pH values. Accordingly, the fatty acids’ carboxyl groups where expected to exist predominantly in the acid COOH form. As can be seen in the enlargement in Fig. 5, 13C CP/MAS NMR spectra revealed it to be otherwise, with two types of carboxyl carbons
present in the samples, one was the COOH acid form (
d
¼176 ppm) and the other was at a chemical shift of 182 ppm corresponding to the COOsalt form. Despite this unexpected finding, these results are in complete agreement with that of a previous study (Snape et al., 1998). One can proclaim that the existence of the salt form is induced and stabilized by the interactions dominating the V-amylose structure in the solid state. This notion is based on the finding that in V-amylose the carboxylic head group of undecanoic acid has been reported to be involved in hydrogen bonding crucial for the stabilization of the helical conformation and supporting the interactions between adjacent helices (Nimz, Gessler, Uson, Sheldrick, & Saenger, 2004).The fore mentioned differences in the amylose C1, C4 carbons and the entrapment of both the acid and salt form of the fatty acids may be related to different functional properties of the amylose complexes as delivery vehicles. This is conceivable since fatty acid release has been linked to amylose hydrolysis (Lalush et al., 2005; Lesmes et al., 2009). This hydrolysis is known to involve the breakage of the C1–O–C4 glycosidic bond shown here to be affected by the guest type. Comparing these results with our previous work (Zabar et al., 2009), shows that the acidification method yields less defined structures compared to production of the same complexes using dimethylsulfoxide (DMSO). Furthermore, as the salt form of fatty acids is more soluble than the acid form, the observation described here might imply complexation might help increase fatty acid solubility which could be linked to the bioavailability of the fatty acids.
4.2. SAXS based nanometric level investigations
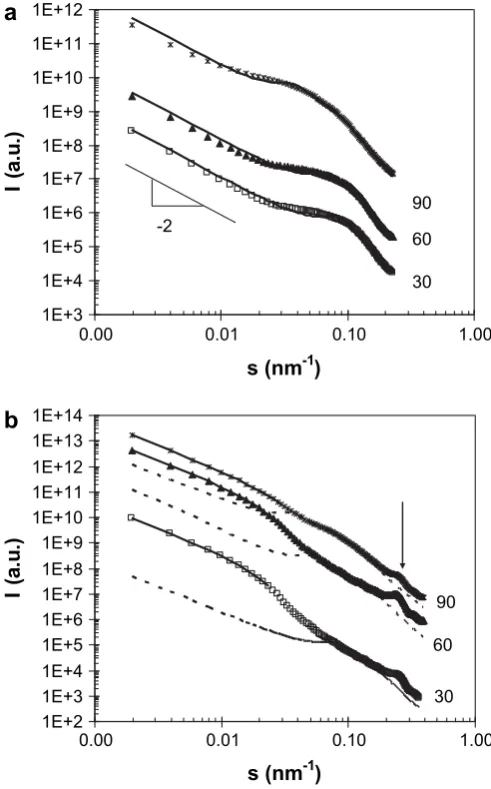
Characterization of the nanostructure of various complexes was performed using SAXS.Fig. 6compares the scattering patterns from dry powders of V-amylose LA complexes to the scattering patterns of the same complexes suspended in water. The scattering patterns of both the dry and the suspended complexes display a2 slope, indicative to lamellar structures. While dry powders display a smooth pattern with no distinct peaks (Fig. 6b), suspending the powders in water resulted in the appearance of a shoulder at sw0.08 nm1 (Fig. 6a). This shoulder indicates that a slightly ordered structure with a typical Bragg distance of ca. 12.5 nm exist in the sample. Since the complex is not soluble in water, suspending in water is not expected to alter its nanostructure thus the changes in the shape of the scattering pattern can be attributes to changes in the contrast – the electron density difference between the complex and the medium (air or water). The fact that changing the contrast modifies not only the scattered intensity but also its s-dependence suggests that the complexes have heterogeneous internal structure with at least two electron densities (Glatter, 1980). We note that the scattering pattern of complexes produced of at high crystallization temperature of 90C could not be acquired due to high adsorption.
A better characterization of the nanostructure was gained by fitting the desmeared SAXS curves to appropriate theoretical models. We have followed the same analysis procedure detailed in our previous publication (Zabar et al., 2009). Briefly, curves from the suspended samples were fitted using the ‘‘modified lamellar model’’, describing randomly oriented finite ‘‘domains’’ made up of alternating layers of crystalline and amorphous material, embedded in an amorphous background material (Wenig & Bramer, 1978). This model was previously used to analyze scat-tering patterns from native starches (Cameron & Donald, 1992; Wenig & Bramer, 1978) and resistant starch (Shamai, Bianco-Peled, & Shimoni, 2003; Shamai, Shimoni, & Bianco-Peled, 2004; Zabar, Shimoni, & Bianco-Peled, 2008). For an overall isotropic sample, where the domains are randomly oriented with respect to the beam, the scattering intensity i(s) is given by:
5
10
15
20
25
30
Bragg angle [2θ]
[image:5.595.50.286.66.218.2]Arb. Intesity
Fig. 4.X-ray diffractograms of V-amylose complexes powders produced with13C
uniformly labeled stearic acid (13C-u-SA) or13C uniformly labeled linoleic acid
(13C-u-LA).
180 160 140 120 100 80 60 40 20 ppm
175
180 ppm
Fig. 5.X-ray diffractograms of V-amylose complexes powders produced with13C
uniformly labeled stearic acid (13C-u-SA).Top left:enlargement of the chemical shift
[image:5.595.44.290.555.709.2]i1ðsÞ ¼ ð
D
r
Þ28
p
3s4DReð1FcÞð1FaÞ
ð1FcFaÞ þ
1 NFa
ð1FcÞ2
ð1FcFaÞ2
h
1 ðFaFcÞN
i!
þ ð
D
r
Þ2
8
p
3s4NDReð
D
r
uÞ2 ðD
r
Þ2h
1 ðFaFcÞN
i
D
r
uD
r
ð1þFaÞð1ð1FcÞ
FcFaÞ
h
1 ðFaFcÞN
i!
ð2Þ
whereFcandFaare Fourier transformation of the Gaussian thick-ness distribution functionsfðxcÞandfðxaÞ, respectively; the average lamellar repeat distance,D, is given byD¼CxcDþCxaDwhereCxcD andCxaDare the average thickness of the crystalline and amorphous regions, respectively;
D
r
¼(r
cr
a) is the electron density differ-ences between the crystalline lamellaer
c and the amorphous lamellaer
aandD
r
u¼(r
ur
a) is the electron density differences between the amorphous lamellae and the background materialr
u; N is the number of repeats in a stack;4
is the crystalline fraction of the total lamellar thickness; andb
is a factor related to the width of the distributions of lamellar thickness.The fitting procedure involved fixing the value of
D
r
uto 1 and fitting the values of the other 5 parametersD
r
,N,D,4
andb
usinga least-square procedure. The solid line inFig. 6a, which represents the best fit to Equation (2), was calculated from the best-fit parameters listed inTable 1. The values of the average crystalline lamellar thicknessCxcD ¼
4
*Dand the average amorphous lamellarCxaD¼ ð1
4
Þ*Dare also listed.Next, an attempt to fit the same ‘‘modified lamellar model’’ to the SAXS curve of the dry complexes was made. As the only structural difference between the dry and suspended samples is the contrast, we used
D
r
as the only fitted parameter while keeping the values of all other parameters at their previously determined values. This fit, shown as a dashed line inFig. 6b, clearly underestimates the scat-tering intensity at low angles. A probable cause for this excess scattering is surface scattering, arising from the shape of the parti-cles, which is masked in the suspended samples due to the lower contrast (Suzuki, Akio, & Yano, 1997). The2 slope suggests that the overall shape is two dimensional. Although several structural models could be considered here, we decided to avoid complicated models that would add several additional parameters to the five already fitted. Alternatively, we fitted the appropriate Giunier approximationIzexpðð2p
Þ2R2g=s2Þ=s2, whereRgis the radius of gyration. This fit is shown as a solid line inFig. 6b. The fitted values of
Rg, a measure to the particle’s size, are listed inTable 1.
The fitting procedure described above was also found to be suitable for the complexes hosting CLA and SA at all three temper-atures (Figs. 7 and 8). The ‘‘modified lamellar model’’ gave a good fit to the scattering from the suspended powders (solid lines in Figs.7a and 8a), however underestimated the scattering from the dry powders. As for the LA containing complex, an initial2 slope was observed in the patterns from the dry powders, and an appropriate Guinier approximation was fitted to this data (solid lines in Figs.7b and8b). The best–fit parameters, and the values of the average crystalline lamellar thickness and the average amorphous lamellar, are summarized inTable 2. Notably, the scattering curves of dry samples hosting SA produced at all crystallization temperatures a significant peak at sw0.25 nm1(a Bragg distance ofw4 nm). This observation indicates that the complexes hosting SA are more organized compared to the complexes prepared with the other fatty acids, in accordance with the DSC and the SEM results.
To summarize this part of the study, crystallization of LA-amylose complexes at high temperature of 90 C leads to formation of
[image:6.595.34.283.58.452.2]isotropic nanostructure with large dimensions. Other complexes produced via the acidification method are characterized by crystal-line regions embedded in an amorphous medium. Inside the crys-talline regions, folded amylose chains (cryscrys-talline lamellae) are separated from one another be regions of imperfections, chain ends, and possibly residues of the fatty acid (amorphous lamellae). An important point to be made is that although the structural model used in this work was adopted from SAXS studies of native starch, the overall structure of the V type complex is expected to be funda-mentally different than that of native starch. In native starch, radial orientation of the amylopectin molecules leads to the formation of Fig. 6.SAXS curves of amylose-LA complexes produced at crystallization temperatures
of (,) 30C and (:) 60C. (a) Suspended powders (b) dry powders. Data and the
[image:6.595.301.553.648.742.2]corresponding fits were offset for clarity.
Table 1
Structural parameters obtained by fitting the scattering intensities of LA complexes to the ‘‘modified lamellar model’’ (Zabar et al., 2009).
Crystallized at 30C Crystallized at 60C
4 0.17 0.11
b 0.42 0.37
D(nm) 14.2 25.3
Dr 5.9 9.1
Dru 1.0 1.0
N 35 20
Rg 505 506
4D(nm) 5.7 4.5
concentric regions of alternating amorphous and crystalline struc-tures known as the growth rings. The lamellae of the VIIcomplexes are formed by crystallization from solution and thus a typical crys-tallization pattern of linear polymers, i.e. laminated structures arranged in spherulites, could be expected. Nevertheless, from SAXS point of view, the measured dimensions are very small compared to the spherulite or the growth ring dimension. Therefore, the analytic calculations of both systems can be based on models of ideal lamella. When examining the values of the fitted parameters, summa-rized inTables 1 and 2, it seems that increasing the crystallization temperature results in increasing the order within the lamella: higher crystalline fraction
4
, larger average crystalline lamellar thickness and larger characteristic particle dimensionRg, the only exception being LA-amylose complexes produced at 90C. Similarly,decreasing the molecular flexibility (from LA to CLA to SA) leads to formation of more ordered structures. The complexes formed from the stiffest fatty acid (i.e. stearic acid) have a significantly more ordered structure which can explain the additional peak in the scattering pattern from the dry powders. Furthermore, comparing the values inTables 1 and 2to those described in our previous work (Zabar et al., 2009) reveals that producing V-amylose through the acidification method produces larger particles than when produced via DMSO method. This trend is also supported by the particle size
distribution curves described in other work (Eliasson,1994; Karkalas et al., 1995; Lesmes et al., 2009; Tufvesson et al., 2003a).
4.3. Microscopic level characterization using AFM and SEM
Atomic force microscopy was applied as a novel nanotechnology tool to help elucidate the micro and nano scale attributes of V-amylose complexes. Since the link between fatty acid unsaturation
1E+3
1E+4
1E+5
1E+6
1E+7
1E+8
1E+9
1E+10
1E+11
1E+12
1E+13
1E+14
0.00
0.01
0.10
1.00
s (nm
-1)
).
u.
a(
I
1E+3
1E+4
1E+5
1E+6
1E+7
1E+8
1E+9
1E+10
1E+11
1E+12
0.00
0.01
0.10
1.00
s (nm
-1)
).
u.
a(
I
30
60
90
-2
a
[image:7.595.313.559.67.462.2]b
Fig. 7.SAXS curves of amylose-CLA complexes produced at crystallization tempera-tures of (,) 30C, (:) 60C and (*) 90C. (a) Suspended powders (b) dry powders.
Data and the corresponding fits were offset for clarity.
1E+3
1E+4
1E+5
1E+6
1E+7
1E+8
1E+9
1E+10
1E+11
1E+12
0.00
0.01
0.10
1.00
s (nm
-1)
).
u.
a(
I
30
60
90
-2
1E+2
1E+3
1E+4
1E+5
1E+6
1E+7
1E+8
1E+9
1E+10
1E+11
1E+12
1E+13
1E+14
0.00
0.01
0.10
1.00
s (nm
-1)
).
u.
a(
I
30
60
90
a
[image:7.595.45.288.68.458.2]b
Fig. 8.SAXS curves of amylose-SA complexes produced at crystallization temperatures of (,) 30C, (:) 60C and (*) 90C. (a) suspended powders (b) dry powders. Data
and the corresponding fits were offset for clarity.
Table 2
Structural parameters obtained by fitting the scattering intensities of CLA and SA complexes to the ‘‘modified lamellar model’’ (Zabar et al., 2009).
CLA SA
30 60 90 30 60 90
4 0.18 0.17 0.46 0.26 0.24 0.16 b 0.40 0.43 0.62 0.45 0.43 0.45
D(nm) 14.0 15.6 17.3 9.9 11.6 21.5
Dr 5.7 5.9 3.1 3.9 4.2 6.2
Dru 1.0 1.0 1.0 1.0 1.0 1.0
N 36 32 58 39 44 47
Rg 506 506 1011 390 508 1017
4D(nm) 6.9 6.6 7.6 7.4 6.4 4.9
[image:7.595.310.562.635.742.2]and particle size distribution and morphology was recently estab-lished based on light scattering particle sizing and AFM (Lesmes et al., 2009), this study aimed to probe the structural changes occurring during complexation. Thus, sampling amylose-SA complexes after titration to acidic conditions (t¼0) and at the end of the crystalli-zation process (t¼24 h) illustrated the structural changes occurring during complexation (Fig. 9).
These AFM images not only demonstrated the aggregative nature of amylose complexes but also reveal a marked change occurs in the morphology of the amylose particles during complexation. The structures viewed after titration (Fig. 9A) appear to be in agreement with a structural model in which amylose chains closely interact with each other to form unique structures, as put forth by others (Cui, 2005). After 24 h of complexation such structures were not detected, but rather aggregates of spheroids (Fig. 9B), coinciding with previous
AFM work (Lalush et al., 2005; Lesmes et al., 2009). This visual structural change was also noted in surface roughness measure-ments. Cross sectioning of corresponding AFM images revealed the average surface roughness of the amylose particles increases from 7.724.34 nm att¼0 to 11.546.05 nm after 24 h.
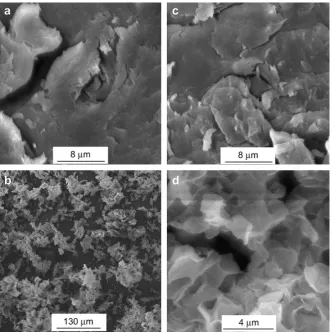
Scanning electron microscopy images of complexes hosting all three fatty acids aimed to study the microscopic attributes of the complexes. Complexes with LA produced at 30C and 60C appear to
be smooth, with no distinct features on the micronic level (Fig. 10a and b). Contrary, production at 90 C lead to the formation of
[image:8.595.120.471.69.179.2]a porous structure (Fig. 10c and d), presumably due to the presence of bubbles at this temperature with is close to the boiling point of the aqueous solution from which the complex was precipitated. The pores are few microns is size, however the SAXS results suggest that smaller pores exist as well.
Fig. 9.Atomic Force Microscopy (AFM) topography images (3mm3mm) of V-amylose complexes hosting stearic acid. [A] Sample immediately after titration to acidic condition (crystallization timet¼0). [B] Sample at the end of the crystallization process (crystallization timet¼24 h). Samples deposited on mica and freely dried.
[image:8.595.128.461.394.729.2]For complexes with CLA and SA, the production temperature did not have a significant effect on the results, therefore only repre-sentative micrographs taken from samples produced at 60C are
shown in Fig. 11. Complexes with CLA appear to be smooth. Contrary, SEM micrographs of the amylose-SA complexes showed large crystals in complexes embedded in the matrix. The crystals thickness is estimated as 1
m
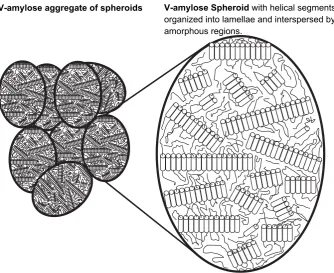
m.In summary, data presented in this paper shows amylose inter-actions with fatty acids lead to the formation of molecular inclusion complexes organized in lamellae packed in spheroids which tend to aggregate, as illustrated inFig. 12. Basically, the presence of fatty acids induces segments in the amylose chain to form helices entrapping the fatty acids. These molecular segments tend to form lamellae of distinct nanometric dimensions as described here and elsewhere (Biais et al., 2006; Godet et al., 1996; Zabar et al., 2009).
Furthermore, this study shows that the lamellae are interspersed by amorphous segments of the amylose chains into spheroids of submicron size which tend to form aggregates well into the micro-scopic range. Thus, this study not only provides quantitative insights into the lamellar structures of V-amylose but also links molecular insights with microscopic ones, allowing the extension of a previous model suggested for V-amylose (Biais et al., 2006) well into the microscopic range.
5. Conclusion
[image:9.595.135.471.66.231.2]This research aimed to study three different strata of V-amylose structure harboring long chain fatty acids. To the best of knowledge this is the first study to use SAXS to probe the nanostructures of V-amylose formed by acidification and combine the results with Fig. 11.SEM micrographs of (a) amylose-CLA (b) amylose-SA complexes produced at 60C. The arrow points to an SA crystal.
V-amylose aggregate of spheroids
V-amylose Spheroid
with helical segments
organized into lamellae and interspersed by
amorphous regions.
[image:9.595.134.469.268.541.2]molecular and microscopic level investigations. This study shows that all FA’s induce V-amylose formation however to a varying extent. As in other studies, molecular level investigations show that increased fatty acid unsaturation leads to the formation of ill-defined crystallites with decreased thermostability and spatial localizability, as inferred from solid state NMR spectra and DSC thermograms. SAXS experiments show this trend also exists in the nanostructures of V-amylose and SEM micrographs indicate this trend extends even to the microscopic level of structure. Thus, the effect of fatty acid unsaturation on V-amylose structure has been shown to span throughout the different structural strata studied. Moreover comparison of the results with previous work suggests the acidification method leads to the formation of larger particles compared to the particles formed through the use of dime-thylsulfoxide (DMSO) (Lesmes et al., 2009; Zabar et al., 2009).
These insights demonstrate that guest chemistry universally affects some of the structural attributes of V-amylose probably manifesting in other aspects of V-amylose such as susceptibility to hydrolysis by amylases. This in turn may affect the release of the guest molecules and/or other aspects of its functionality as a controlled release system targeted to the lower gastrointestinal tract, as recently suggested (Gelders, Goesaert, & Delcour, 2006; Lalush et al., 2005; Lesmes & McClements, 2009). The insights described in this paper contribute to the understanding of V-amylose structure which to the best of our understanding support the model illustrated inFig. 12. Such insights along with others may prospectively be used in designing and exploiting V-amylose inclusion complexes as a novel delivery system for fatty acids, nutraceuticals and even drugs.
Acknowledgments
The authors would like to thank the generous financial support of the Technion – Israel Institute of Technology (Israel) and the Russell Berrie Nanotechnology Institute at the Technion. Addi-tionally we would like to thank Dr. Yael Balazs and Prof. Asher Schmidt for their kind assistance and guidance.
References
Balata-Calleja, F. J., & Vonk, C. G. (1989).X-ray scattering of synthetic polymers. New York: Elsevier Science Publishers.
Barrow, C. J., Nolan, C., & Jin, Y. (2007). Stabilization of highly unsaturated fatty acids and delivery into foods.Lipid Technology, 19(5), 108–111.
Biais, B., Le Bail, P., Robert, P., Pontoire, B., & Buleon, A. (2006). Structural and stoichiometric studies of complexes between aroma compounds and amylose. Polymorphic transitions and quantification in amorphous and crystalline areas.
Carbohydrate Polymers, 66(3), 306–315.
Biliaderis, C. G., & Galloway, G. (1989). Crystallization behavior of amylose-v complexes: structure-property relationships.Carbohydrate Research, 189, 31–48. Bulpin, P. V., Welsh, E. J., & Morris, E. R. (1982). Physical characterization of amylose
fatty acid complexes in starch.Starch, 34, 335–339.
Cameron, R. E., & Donald, A. M. (1992).Polymers, 33(12), 2628–2635.
Conde-Petit, B., Escher, F., & Nuessli, J. (2006). Structural features of starch–flavor complexation in food model systems.Trends in Food Science & Technology, 17(5), 227–235.
Cui, S. W. (2005).Food carbohydrates: Chemistry, physical properties, and applications. Boca Raton, FL: Taylor & Francis.
Eliasson, A. C. (1994). Interactions between starch and lipids studied by DSC.
Thermochimica Acta, 246(2), 343–356.
Eliasson, A. C., & Krog, N. (1985). Physical properties of amylose-monoglyceride complexes.Journal of Cereal Science, 3, 239–248.
Gelders, G. G., Goesaert, H., & Delcour, J. A. (2006). Amylose-lipid complexes as controlled lipid release agents during starch gelatinization and pasting.Journal of Agriculture and Food Chemistry, 54(4), 1493–1499.
Gidley, M. J., & Bociek, S. M. (1988).13C CP/MAS NMR-studies of amylose inclusion complexes, cyclodextrins, and the amorphous phase of starch granules. Rela-tionships between glycosidic linkage conformation and solid-state C-13 chemical shifts.Journal of the American Chemical Society, 110, 3820–3829. Glatter, O. (1977). A new method for evaluation of small angle scattering data.
Journal of Applied Crystallography, 10, 415.
Glatter, O. (1980). Determination of particle-size distribution functions from small-angle scattering data by means of the indirect transformation method.Journal of Applied Crystallography, 13, 7–11.
Godet, M. C., Bizot, H., & Buleon, A. (1995). Crystallization of amylose-fatty acid complexes prepared with different amylose chain lengths.Carbohydrate Poly-mers, 27, 47–52.
Godet, M., Bouchet, B., Colonna, P., Gallant, D. J., & Buleon, A. (1996). Crystalline amylose-fatty acid complexes: morphology and crystal thickness.Journal of Food Science, 61(6), 1196–1201.
Godet, M. C., Buleon, A., Tran, V., & Colonna, P. (1993). Structural features of fatty acid-amylose complexes.Carbohydrate Polymers, 21, 91–95.
Godet, M. C., Tran, V., Colonna, P., Buleon, A., & Pezolet, M. (1995). Inclusion/ exclusion of fatty acids in amylose complexes as a function of the fatty acid chain length.International Journal of Biological Macromolecules, 17(6), 405–408. Horii, F., Yamamoto, H., Hirai, A., & Kitamaru, R. (1987). Structural study of amylose polymorphs by cross-polarization magic-angle spinning13C NR spectroscopy.
Carbohydrates Research, 160, 29–40.
Jouquand, C., Ducruet, V., & Le Bail, P. (2006). Formation of amylose complexes with C6-aroma compounds in starch dispersions and its impact on retention.Food Chemistry, 96, 461–470.
Jovanovich, G., & Maria, C. A. (1999). Amylose-lipid complex dissociation, a study of the kinetic parameters.Biopolymers, 49, 81–89.
Kanicky, J. R., & Shah, D. O. (2002). Effect of degree, type, and position of unsatu-ration on the pKa of long-chain fatty acids.Journal of Colloid and Interface Science, 256, 201–207.
Karkalas, J., Ma, S., Morrison, W., & Pethrick, R. A. (1995). Some factors determining the thermal properties of amylose inclusion complexes with fatty acids.
Carbohydrate Research, 268, 233–247.
Kawada, J., & Marchessault, R. H. (2004). Solid state NMR and x-ray studies on amylose complexes with small organic molecules.Starch, 56, 13–19. Lalush, I., Bar, H., Zakaria, I., Eichler, S., & Shimoni, E. (2005). Utilization of
amylose-lipid complexes as molecular nanocapsules for conjugated linoleic acid. Bio-macromolecules, 6(1), 121–130.
Le Bail, P., Rondeau, C., & Buleon, A. (2005). Structural investigation of amylose complexes with small ligands: helical conformation, crystalline structure and thermostability.International Journal of Biological Macromolecules, 35(1–2), 1–7. Lesmes, U., Barchechath, J., & Shimoni, E. (2008). Continuous dual feed homogeni-zation for the production of starch inclusion complexes for controlled release of nutrients.Innovative Food Science & Emerging Technologies, 9(4), 507–515. Lesmes, U., Cohen, S. H., Shener, Y., & Shimoni, E. (2009). Effects of long chain fatty
acid unsaturation on the structure and controlled release properties of amylose complexes.Food Hydrocolloids, 23(3), 667–675.
Lesmes, U., & McClements, D. J. (2009). Structure-function relationships to guide rational design and fabrication of particulate food delivery systems.Trends in Food Science & Technology, 20(10), 448–457.
Mcclements, D. J., Decker, E. A., & Park, Y. (2009). Controlling lipid bioavailability through physicochemical and structural approaches.Critical Reviews in Food Science and Nutrition, 49(1), 48–67.
McClements, D. J., Decker, E. A., Park, Y., & Weiss, J. (2008). Designing food structure to control stability, digestion, release and absorption of lipophilic food components.Food Biophysics, 3(2), 219–228.
McClements, D. J., Decker, E. A., & Weiss, J. (2007). Emulsion-based delivery systems for lipophilioc bioactive components.Journal of Food Science, 72(8), R109–R124. Nimz, O., Gessler, K., Uson, I., Sheldrick, G. M., & Saenger, W. (2004). Inclusion complexes of V-amylose with undecanoic acid and dodecanol at atomic reso-lution: X-ray structures with cycloamylose containing 26 D-glucoses (cyclo-hexalcosaose) as host.Carbohydrate Research, 339(8), 1427–1437.
Porod, G. (1982).Small angle X-ray scattering. New York: Academic Press. Raphaelides, S., & Karkalas, J. (1988). Thermal dissociation of amylose-fatty acid
complexes.Carbohydrate Research, 172(1), 65–82.
Semo, E., Kesselman, E., Danino, D., & Livney, Y. D. (2007). Casein micelle as a natural nano-capsular vehicle for nutraceuticals.Food Hydrocolloids, 21(5–6), 936–942.
Shahidi, F., & Miraliakbari, H. (2004). Omega-3 (n-3) fatty acids in health and disease: Part I – Cardiovascular disease and cancer.Journal of Medicinal Food, 7(4), 387–401.
Shahidi, F., & Miraliakbari, H. (2005). Omega-3 fatty acids in health and disease: part 2-health effects of omega-3 fatty acids in autoimmune diseases, mental health, and gene expression.Journal of Medicinal Food, 8(2), 133–148. Shamai, K., Bianco-Peled, H., & Shimoni, E. (2003). Polymorphism of resistant starch
type III.Carbohydrate Polymers, 54(3), 363–369.
Shamai, K., Shimoni, E., & Bianco-Peled, H. (2004). Small angle X-ray scattering of resistant starch type III.Biomacromolecules, 5, 219–223.
Snape, C. E., Morrison, W. R., Maroto-Valer, M. M., Karakals, J., & Pethrick, R. A. (1998). Solid atate13C NMR investigation of lipid ligands in v-amylose inclusion
complexes.Carbohydrate Polymers, 36, 225–237.
Suzuki, T., Akio, C., & Yano, T. (1997). Interpretation of small angle x-ray scattering from starch on the basis of fractals.Carbohydrate Polymers, 34(4), 357–363. Tozuka, Y., Takeshita, A., Nagae, A., Wongmekiat, A., Moribe, K., Oguchi, T., et al.
(2006). Specific inclusion mode of guest compounds in the amylose complex analyzed by solid state NMR spectroscopy.Chemical & Pharmaceutical Bulletin, 54(8), 1097–1101.
Tufvesson, F., Wahlgren, M., & Eliasson, A. C. (2003b). Formation of amylose lipid complexes and effect of temperature treatment. Part 1: monoglycerides.Starch, 55, 61–71.
Wenig, W., & Bramer, R. (1978). Significance of mean sample density for quantita-tive interpretation of small-angle X-ray-scattering of partially crystalline poly-mers.Colloid and Polymer Science, 256(2), 125–132.
Zabar, S., Lesmes, U., Katz, I., Shimoni, E., & Bianco-Peled, H. (2009). Studying different dimensions of amylose-long chain fatty acid complexes: molecular, nano and micro level characteristics.Food Hydrocolloids, 23(7), 1918–1925. Zabar, S., Shimoni, E., & Bianco-Peled, H. (2008). Development of nanostructure in