ORIGINAL ARTICLE
A Reliability Allocation Method of CNC
Lathes Based on Copula Failure Correlation
Model
Hao Wang
1, Yi‑Min Zhang
2*and Zhou Yang
1Abstract
The current research of reliability allocation of CNC lathes always treat CNC lathes as independent series systems. However, CNC lathes are complex systems in the actual situation. Failure correlation is rarely considered when reliabil‑ ity allocation is conducted. In this paper, drawbacks of reliability model based on failure independence assumption are illustrated, after which, reliability model of CNC lathes considering failure correlation of subsystems is established based on Copula theory, which is an improvement of traditional reliability model of series systems. As the failure time of CNC lathes often obeys Weibull or exponential distribution, Gumbel Copula is selected to build correlation model. After that, a reliability allocation method considering failure correlation is analyzed based on the model established before. Reliability goal is set first and then failure rates are allocated to subsystems according to the allocation vector through solving the correlation model. Reliability allocation is conducted for t= 1. A real case of a CNC lathe and a numerical case are presented together to illustrate the advantages of the reliability model established consider‑ ing failure correlation and the corresponding allocation method. It shows that the model accords to facts and real working condition more, and failure rates allocated to all the subsystems are increased to some extent. This research proposes a reliability allocation method which takes failure correlation among subsystems of CNC lathes into consid‑ eration, and costs for design and manufacture could be decreased.
Keywords: CNC lathe, Copula, Failure correlation, Reliability model, Reliability allocation
© The Author(s) 2018. This article is distributed under the terms of the Creative Commons Attribution 4.0 International License (http://creat iveco mmons .org/licen ses/by/4.0/), which permits unrestricted use, distribution, and reproduction in any medium, provided you give appropriate credit to the original author(s) and the source, provide a link to the Creative Commons license, and indicate if changes were made.
1 Introduction
CNC lathes take an important role in mechanical equip-ment, the reliability technology of which is improved and developed gradually by scholars at home and abroad. Zhang et al. [1, 2] put forward the reliability syl-labus of mechanical products including CNC lathes and researched the essence of reliability-based design. Wu et al. [3] presented a novel reliability assessment meth-odology with machining performance degradation data for estimating the reliability level of equipment. Li et al. [4] presented a reliability optimization design method considering the failure caused by overlarge static defor-mation of the CNC lathe spindle, so that reliability was
improved and reliability robustness increased at the same time. CNC lathes are traditionally regarded as series sys-tems [5], and it’s commonly seen in some researches that failures of different subsystems are independent, which means that failure of a certain subsystem cannot be influenced by any other subsystem. However, according to engineering experience and practical situation, fail-ure independence hypothesis is not accurate enough [6], which may cause unnecessary costs. Problems such as changes in environment or uneven distribution of mate-rials may lead to the same variation tendency of subsys-tems’ reliability, resulting in fluctuation of the reliability of the lathe. Failure of a subsystem is not only related to fatigue caused by long time operation, but also related to failures of other systems, which is so-called failure cor-relation [7, 8]. Therefore, failure correlation should be given full consideration when assessing reliability of CNC lathes.
Open Access
*Correspondence: [email protected]
2 Equipment Reliability Institute, Shenyang University of Chemical Technology, Shenyang 110142, China
In recent years, many researches about failure correla-tion of different systems and structures have been con-ducted by scholars. Shen et al. [9] proposed an average maintenance time calculation method for CNC machine tools. Copula connection function was used to calculate failure rate function of components with failure correla-tion. Wang et al. [10] employed Gaussian Copula function to construct joint distribution of the random variables, and developed a novel model to describe the deteriora-tion of aging structures in reliability analysis. Huang et al. [11] established avionics reliability assessment model based on Copula theory considering two kinds of failure modes. Mou et al. [12] researched reliability model of planetary steering gear using fault tree analysis and fuzzy theory. Zhang et al. [13] discussed failure correlation of CNC equipment taking CNC machine as an illustrative example, and compared the results with that of traditional series model. Chen et al. [14] proposed a reliability alloca-tion method considering failure dependence, whose effect of cost reduction was demonstrated through a numerical case. Liu et al. [15] proposed a dimensionality reduction calculation method for multidimensional Copula, which enhanced computing efficiency to a large extent.
Based on the statement above, this paper established reliability model of CNC lathes considering failure cor-relation of subsystems using Copula theory, and then proposed a reliability allocation method based on the model. The rationality and effectiveness of the allocation method were explained and verified through two exam-ples compared with traditional method based on failure independence assumption. Therefore, this paper pro-vides reference and support for reliability design of CNC lathes.
2 Copula Theory
2.1 Definition and Properties of Copula
Copula function was first proposed by Sklar in 1959, which is a description for dependency relationship. It has been widely used in many fields, such as financial field, mechanical field and electronic field. Copula function can provide a link between joint distribution and mar-ginal distribution of two or more random variables [16]. It can describe failure dependency or correlation roundly and reflect what’s real of the relationships among differ-ent subsystems. Introducing Copula function into reli-ability analysis of CNC lathes can make up the shortage of traditional failure independence assumption.
Assuming that there are random variables, x1, x2, …, xn, the marginal distribution of which are respectively F1(x1),
F2(x2), …, Fn(xn). Fi(xi) obeys uniform distribution between 0 and 1. Copula function that can describe these variables is written as C(F1(x1), F2(x2), …, Fn(xn)). n-Dimensional Copula has the following characteristics [17].
(1) Domain of definition of C(F1(x1), F2(x2), …, Fn(xn)) is [0,1]n = In.
(2) For any F1(x1), F2(x2),…, Fn(xn) ∈In, C(F1(x1),
F2(x2),…, Fn(xn)) is an increasing function.
(3) For any F1(x1), F2(x2),…, Fn(xn) ∈In, if there exists Fi(xi) = 0, C(F1(x1), F2(x2),…, Fn(xn)) = 0.
(4) For any F1(x1), F2(x2),…, Fn(xn) ∈In, if all of them are equal to 1 except for Fi(xi), C(F1(x1), F2(x2),…,
Fn(xn)) =Fi(xi).
2.2 Sklar Theorem
It has been pointed out in Sklar theorem [18] that if joint distribution function of n-dimensional random vari-ables is denoted as F(x1, x2, …, xn), there exists a Copula function
where if F1(x1), F2(x2), …, Fn(xn) are continuous, C(F1(x1),
F2(x2), …, Fn(xn)) is unique, otherwise, C(F1(x1), F2(x2), …,
Fn(xn)) is unique in RanF1× RanF2×···× RanFn. Accord-ing to the joint distribution function and marginal dis-tribution function, and making ui=Fi(xi), Eq. (1) can be rewritten as
where Fi−1(xi) is the inverse function of Fi (xi).
According to Sklar theorem, f(x1, x2, …, xn), which is the density function of F(x1, x2, …, xn) can be written as
where c(·) is the density function of Copula function, and c(u1,u2, . . ., un)= ∂C(u∂u11∂u,u22···,...∂un,un). fi(xi) is the density function of marginal distribution function Fi(xi).
2.3 Archimedean Copula Function
There are many kinds of Copula functions, among which, Archimedean Copula function is widely used including Frank Copula, Clayton Copula and Gumbel Copula, and so on [19]. Expression of Archimedean Copula function is
(1) F(x1,x2, . . ., xn)=C(F1(x1), F2(x2), . . ., Fn(xn)),
(2) C(u1,u2,. . ., un)=F
F1−1(x1),F2−1(x2), . . ., Fn−1(xn)
,
(3)
f(x1, x2, . . ., xn)
= ∂F(x1, x2, . . ., xn) ∂x1∂x2. . . ∂xn
= 1
2
∂C(F1(x1),F2(x2), . . ., Fn(xn)) ∂x1∂x2· · ·∂xn
=c(F1(x1),F2(x2), . . ., Fn(xn))× n
i=1 fi(xi),
where 0 ≤ui≤ 1, ϕ is a non-increasing continuous func-tion, called Copula generator. ϕ : [0, +∞) → [0, 1], ϕ
(0) = 1, limx→+∞ ϕ(x) = 0, and ϕ is strictly monotone
decreasing in [0, ϕ−1(0)].
In mechanical systems, Gumbel Copula is mostly used, which is suitable for exponential distribution or Weibull distribution [11]. When the Copula generator
φ(ui) equals to (− lnui)1/θ, Gumbel Copula is formed, the expression of which is
where θ in (0,1] is a parameter that describes correla-tion among variables. When θ→ 0, it shows strong cor-relation, When θ= 1, there is no correlation among the variables. The estimated value θˆ of θ can be obtained through maximum likelihood estimation method. Likeli-hood function L(θ) is just what in Eq. (3). θˆ should make L(θ) reach its maximum, which can be expressed as L(θˆ;x1, x2, . . ., xn)=maxL(θ;x1, x2, . . ., xn). θˆ can be obtained through solving ∂C(u1,u2,...,un)
∂θ =0.
3 Reliability Model of CNC Lathes Based on Copula Function
CNC lathes are composed of several subsystems, denoted as X1, X2, …, XN. Assuming that lifetime of subsys-tems are T1, T2, …, TN, reliability of the ith subsystem is
(4) C(F1(x1), F2(x2), . . ., Fn(xn))
=exp(−{[−ln(F1(x1))]1/θ+ [−ln(F2(x2))]1/θ + · · · + [−ln(Fn(xn))]1/θ}θ),
Ri(t) =P(Ti > t) = 1 −Fi(t), where Fi(t) is the unreliability of the ith subsystem. According to independence assump-tion for series systems, reliability of the lathe is [20]
To be more consistent with actual situation and give a more precise description of failure correlation among different subsystems, it’s hypothesized that n (n≤N) sub-systems are dependent in terms of failure, while the other
m (m=N−n) subsystems are independent. Reliability of failure dependent subsystems R˜(t) can be calculated
with Copula function. Assuming that the joint distribu-tion funcdistribu-tion of lifetime of the n subsystems with failure dependency is H(t) =P(T1≤t, T2≤t, …, Tn≤t). Fi(t) is the marginal distribution function of Ti, which is contin-uous. According to Sklar theorem, there exists the only
n-dimensional Copula function and H(t) =C(F1(t), F2(t), …, Fn(t)). Therefore, expression of R˜(t) is
Equation (6) can be rewritten with Copula function as
(5) Rsys(t)=R1(t)·R2(t)· · · ·RN(t).
(6)
˜
R(t)=P(T1>t, T2>t, . . ., Tn>t)
=1−
n
i=1
P(Ti≤t)+
1≤j<k≤n
P(Tj≤t, Tk ≤t)
+ · · · +(−1)m
1≤i1<i2<···<im≤n
P(Ti1 ≤t,Ti2 ≤t,. . .Tim ≤t)
+ · · · +(−1)nP(T1≤t, T2≤t, . . ., Tn≤t).
(7)
˜
R(t)=C(1, 1, . . ., 1)− n
i=1
C(1, 1, . . ., Fi(t), 1, . . ., 1)
+
1≤j<k≤n
C(1, 1, . . ., Fj(t), 1, . . ., Fk(t), 1, . . ., 1)+ · · · +(−1)m
×
1≤ii<i2<···<im≤n
C(1, 1, . . ., Fi1(t), 1, . . ., Fi2(t), 1, . . .,Fim(t), 1, . . ., 1)
+ · · · +(−1)nC(F1(t), F2(t), . . ., Fn(t))=1− n
i=1 Fi(t)
+(−1)q
1≤i1<i2<···<iq≤n
C(1, 1, . . . Fi1(t), 1, . . ., Fi2(t), . . ., Fiq(t), 1, . . ., 1)
=�1F 1(t)�
1
F2(t)· · ·� 1
where Δ is difference sign, and �baΘ(x)=Θ(b)−Θ(a) , in which Θ can be any function.
Finally, the failure dependent reliability model of the CNC lathe is obtained when considering failure correla-tion, which is
It needs to explain that if there are n1 subsystems with failure correlation, while other n2 subsystems with failure correlation, and so on, then reliability model of the CNC lathe is that
where N1, N2, …, Nσ are the numbers of subsystems with failure correlation respectively, the sum of which is
N−m.
The upper bound of R˜
sys is the result of the weakest link theory, denoted as Rw, where Rw= min(R1, R2, …, RN). The lower bound of R˜
sys is the result of independence hypoth-esis, denoted as Rp, where Rp=
N
i=1
Ri. So, there exists
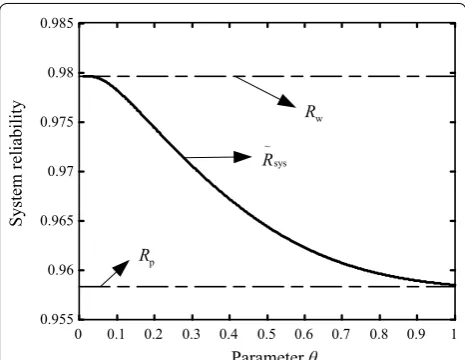
Rp≤R˜sys≤Rw. Assuming that there is a system including four failure dependent subsystems, reliability of which are respectively R1= 0.9992, R2= 0.9796, R3= 0.9903,
R4= 0.9888. Then, Rp=R1×R2×R3×R4= 0.9585, and
Rw= min(R1, R2, R3, R4) = 0.9796. Based on the statement above, reliability of the system using Copula function is
The change situation of R˜
sys(t) along with parameter θ is shown in Figure 1. It can be seen that reliability con-sidering failure correlation is between the result of the weakest link theory and that of independence hypothesis. With the increase of θ, the result is close to that of inde-pendence hypothesis.
(8) ˜
Rsys(t)= ˜R(t)· m
i=1 Ri(t).
(9) ˜
Rsys(t)= ˜Rn1(t)· ˜Rn2(t)· · · ˜Rnσ(t)·
m
i=1
Ri(t)
=
σ
γ=1 ˜
Rnγ(t)· m
i=1
Ri(t),
(10) ˜
Rsys(t)=1− � 4
�
i=1
Fi
�
+ �
1≤i<j≤4 exp
�
−�(−lnFi)1/θ +(−lnFj)1/θ
�θ�
− �
1≤i<j<k≤4 exp
�
−�(−lnFi)1/θ+(−lnFj)1/θ+(−lnFk)1/θ
�θ�
+exp
−
� 4 �
i=1
(−lnFi)1/θ
�θ
4 A Reliability Allocation Method of CNC Lathes Considering Failure Correlation
Reliability allocation is to allocate reliability index to products of each level from top to bottom according to certain principles and methods [21, 22]. Traditional ARINC allocation method [23] takes the failure rates of subsystems into consideration, which are used to calcu-late weight factors for allocation. The target failure rate is then allocated to each subsystem in proportion to the values of the weight factors. Wang et al. [24] considered seven factors, such as frequency and criticality of failure, and proposed a comprehensive allocation method for CNC lathes. Kim et al. [25] transformed the traditional severity level into exponential type to avoid the occur-rence of unacceptable failure effects. Yadav et al. [26] proposed an allocation method through modifying tra-ditional calculation method of criticality and introducing the potential for reliability improvement into allocation factor. In addition, Liu et al. [27] established a fuel cell vehicle model considering factors such as subsystem cost and limit reliability, and employed a genetic algorithm to reallocate the reliability of the overall vehicle system. Sriramdas et al. [28] evaluated allocation factors in lin-guistic terms and proposed an allocation approach.
All the methods mentioned above are based on inde-pendence hypothesis, however, failures of a subsystem are not only caused by fatigue and aging of the compo-nents, but also by failures of other subsystems. Many researchers have developed and improved the corre-sponding allocation methods. Zhuang et al. [29] pro-posed an allocation method using two-dimensional mapping of components and functions considering func-tional dependency and modified criticality factor. Yang et al. [30] gave an overall consideration of several allo-cation factors, established coefficient matrix of failure
correlation, calculated correlated failure severities of sub-systems, and finally allocated the target reliability value to each subsystem.
reliability model established in Section 3. The final allo-cation failure rates of each subsystem are denoted as
ˆ
1,ˆ2, . . ., ˆN. It can be concluded from the allocation methods for series systems that there will be an alloca-tion vector A= {A1, A2, …, AN}. The target value of failure rate is allocated to each subsystem in accordance with A, so the failure rate allocated to the ith subsystem is
where λobj is the target value of failure rate that needed to be allocated to subsystems.
The following part focuses on allocation considering failure correlation. For all the N subsystems, reliability allocation process is still carried out in accordance with the values in A, which means that the ratio between fail-ure rate of the ith subsystem and that of the jth subsys-tem is that λi*:λj*=Ai:Aj. Therefore,
Failure time of CNC lathes usually obey exponential dis-tribution or Weibull disdis-tribution. Here, reliability allocation is discussed taking exponential distribution as an example. Failure rate is constant for exponential distribution, and the relationship between reliability and failure rate is
Reliability allocation is the primary stage of the life cycle of CNC lathes, which is conducted in this paper when t= 1.
Setting the failure rate to be allocated to the ith sub-system λi* as the standard, the failure rates to be allo-cated to other subsystems can be expressed with λi*
(11) ˆ
i= Ai N
i=1
Ai
obj,
(12) ∗
1:
∗
2: · · ·
∗
N =A1:A2: · · · :AN.
(13)
R∗i(t)=e−∗it.
according to Eq. (12). λi* can be solved through substitut-ing Eq. (12) into the reliability model which is shown in Eq. (9), where, F(t) = 1 −R(t), and letting Eq. (9) be equal to e−obj . Then, failure rates of the other N− 1 subsys-tems can be obtained according to Eq. (12). Reliability results of each subsystem after allocation when t= 1 are
R1=e− ∗
1,R2=e−2∗,. . .,RN =e− ∗ N.
The following part illustrates the allocation method through an example, which is reliability allocation of a structure composed of four subsystems. Denoting observed failure rates as λ1, λ2, λ3 and λ4 respectively. For convenience, ARINC method is selected here, in which the allocation vector A= {A1:A2:A3:A4=λ1:λ2:λ3:λ4}. Assuming that among all the four subsystems, N1, N2 and
N3 are failure dependent, and failure rate allocated to N3 denoted as λ3* is selected as the standard, then ∗1=
1
3
∗ 3 , ∗
2=
2
3
∗
3 , ∗4=
4
3
∗
3 . Making θ= 0.3 for Gumbel Copula
and Eq. (14) be equal to e−obj , λ
3
* can be obtained by solv-ing the equation.
It can be concluded that failure rates allocated to sub-systems are higher when considering failure correlation than that based on independence hypothesis, while the failure rate of the overall system remains the same, which still meets the design requirement. For a certain subsys-tem, if the acceptable failure rate is higher, then the cost of design and manufacture could be decreased, which makes it easier to make the subsystem up to standard. Therefore, the allocation method is more reasonable and consistent with engineering practice.
5 Real Case and Discussions
5.1 Reliability Model of CNC Lathes Considering Failure Correlation
This section establishes reliability calculation model of a CNC lathe using the theory in Section 3. The CNC lathe is divided into eight key subsystems such as main driv-ing system (M), feeddriv-ing system (F), cooldriv-ing system (B), turret (T), clamping system (C), hydraulic system (H),
(14) ˜
Rsys=�1F1�
1
F2�
1
F3C(F1,F2,F3)×R4
= {1−(F1+F2+F3)
+exp(−[(−ln(F1))(1/0.3)+(−ln(F2))(1/0.3)]0.3)
+exp(−[(−ln(F1))(1/0.3)+(−ln(F3))(1/0.3)]0.3)
+exp(−[(−ln(F2))(1/0.3)+(−ln(F3))(1/0.3)]0.3)
−exp(−[(−ln(F1))(1/0.3)+(−ln(F2))(1/0.3)
+(−ln(F3))(1/0.3)]0.3)} ×R4 =Robj=e−obj,
(F1=1−R1=1−e− ∗
1 =1−e−
1
3
∗
3,
F2=1−e
−2
3
∗
3,F
3=1−e−
∗
3,R4 =e−
4
3
∗
3). 0 0.1 0.2 0.3 0.4 0.5 0.6 0.7 0.8 0.9 1
0.955 0.96 0.965 0.97 0.975 0.98 0.985
Parameter θ
System reliability
w R
p R
~ sys R
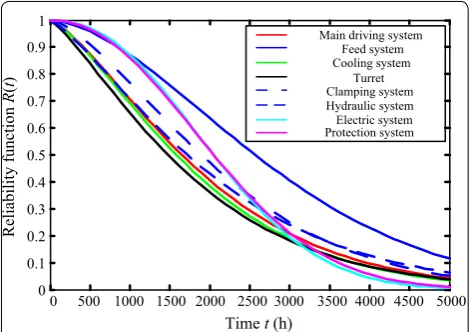
electric system (E) and protection system (P). Reliability functions (Weibull distribution as an example) and linear correlation coefficients are listed in Table 1. Reliability curves are shown in Figure 2.
When assuming that all the eight subsystems are failure independent, reliability model of the lathe is
According to Ref. [13], subsystems with relatively low linear correlation coefficient are seen as failure depend-ent. From Table 1, correlation coefficients of feeding system (F) and clamping system (C) are 0.956 and 0.949 respectively, which are the lowest of all. Therefore, relia-bility model of the lathe is discussed in the following part considering failure correlation between feeding system (F) and clamping system (C).
According to Ref. [14], for systems like CNC lathes, Gumbel Copula is the most optimum choice to describe dependency among subsystems. Reliability model of the system including feeding system (F) and clamping system (C) is
(15) Rsys(t)=RM(t)RF(t)RB(t)RT(t)RC(t)RH(t)RE(t)RP(t)
=exp
−
t 2157.8
1.3739 −
t 3184.8
1.7069
−
t 2066.2
1.3727 −
t 1971.0
1.2691
−
t 2415.7
1.5017 −
t 2279.9
1.2946
−
t 2410.2
2.2501 −
t 2435.2
2.1227 .
(16)
˜
RFC(t)=�1FF(t)�
1
FC(t)C(FF(t),FC(t))
=1− [1−RF(t)] − [1−RC(t)]
+exp{−[(−ln(1−RF(t)))(1/θ )
+(−ln(1−RC(t)))(1/θ )]θ}.
Changing situation of R˜FC(t) along with time is shown in Figure 3 when parameter θ takes different values, where, feeding system (F) and clamping system (C) are independent when θ= 1. When t remains unchanged, the smaller θ is, the stronger the correlation, and the higher the reliability will be. θ is set as 0.3 in this case.
To establish reliability model of the lathe, feeding system (F) and clamping system (C) are seen as an integrated sys-tem. Then, there are seven independent subsystems in series. Therefore, reliability model of the lathe when θ= 0.3 is
(17) ˜
Rsys(t)= ˜RFC(t)×RM(t)RB(t)RT(t)RH(t)RE(t)RP(t)
=�1FF(t)�1FC(t)C0.3(FF(t),FC(t))
×RM(t)RB(t)RT(t)RH(t)RE(t)RP(t) = {1− [1−RF(t)] − [1−RC(t)]
+exp(−[(−ln(1−RF(t)))(1/0.3)
+(−ln(1−RC(t)))(1/0.3)]0.3)} ×RM(t)RB(t)RT(t)RH(t)RE(t)RP(t).
Table 1 Reliability functions and linear correlation coefficients of the subsystems
Symbol
of subsystems Reliability function Linear correlation coefficient r
M RM(t) = exp[− (t/2157.8)1.3739] 0.985
F RF(t) = exp[− (t/3184.8)1.7069] 0.956
B RB(t) = exp[− (t/2066.2)1.3727] 0.993
T RT(t) = exp[− (t/1971.0)1.2691] 0.982
C RC(t) = exp[− (t/2415.7)1.5017] 0.949
H RH(t) = exp[− (t/2279.9)1.2946] 0.987
E RE(t) = exp[− (t/2410.2)2.2501] 0.984
P RP(t) = exp[− (t/2435.2)2.1227] 0.985 00 500 1000 1500 2000 2500 3000 3500 4000 4500 5000
0.1 0.2 0.3 0.4 0.5 0.6 0.7 0.8 0.9 1
Main driving system Feed system Cooling system
Turret Clamping system Hydraulic system Electric system Protection system
Time t(h)
Reliability function
R
(
t
)
Figure 2 Changing curve of reliability of subsystems along with time
Time t (h)
Reliability of system including
feeding system and clamping system
~ FC
()
Rt
0 1000 2000 3000 4000 5000 6000
0 0.1 0.2 0.3 0.4 0.5 0.6 0.7 0.8 0.9 1
=1
θ=0.3 θ
Further, reliability model of the lathe considering fail-ure correlation among all the subsystems is
Figure 4 shows the reliability curves of the lathe when all the subsystems are independent, considering failure correlation between feeding system (F) and clamping system (C) and considering failure correlation among all the subsystems. It can be seen from the figure that reli-ability of the lathe is the lowest when failure correlation is not considered, while reliability is becoming higher when considering failure correlation among more subsystems.
5.2 Reliability Allocation of CNC Lathes
Taking the data in Ref. [24] as a reference, an exam-ple of reliability allocation is presented by using the method in section 4, and comparison is made between the results of the method proposed in this paper and that of the method in Ref. [24]. Target value of failure rate
λobj= 1/MTBFobj= 0.002, where, MTBFobj denotes the reliability goal of the overall CNC lathe in Ref. [24].
In Ref. [24], there were total 15 subsystems of CNC lathes and seven allocation factors are considered such as frequency of failure, criticality of failure, maintainability, complexity, manufacturing technology, working condi-tion and cost. For each allocacondi-tion factor, relative ratios for failure rate allocation between every two subsystems were calculated to get ratio matrix B(k). Then, a matrix Γ can be obtained by calculating the average values of the entries in each row of the matrix B(k) for the seven allocation factors. There is a vector W in Ref. [22] called weighting vector, representing the weight or importance
(18)
˜
Rsys(t)∗=�1FM(t)� 1 FF(t)�
1 FB(t)�
1 FT(t)�
1 FC(t)�
1 FH(t)�
1 FE(t)�
1 FP(t) C0.3(FM(t),FF(t),FB(t),FT(t),
FC(t),FH(t),FE(t),FP(t)). of each allocation factor, which was obtained by expert rating method. The comprehensive failure rate alloca-tion vector for all subsystems A was defined by A=W·Γ. Based on the data in Ref. [22], the allocation vector is finally obtained as follows:
A= {0.68 0.61 0.53 0.54 0.59 0.59 0.39 0.46 0.52 0.41 0.45 0.51 0.45 0.49 0.29}.
Allocation results according to the method proposed in Ref. [24] are shown in Table 2, which are on the basis of independence hypothesis.
Considering failure correlation among all the 15 sub-systems, target value of failure rate is still λobj= 0.002. Failure rate of Turret (M) λ1* is selected as the standard, and it can be obtained according to allocation vector A that
where λi* denotes the failure rate to be allocated to the ith subsystem by using the method proposed in this paper. Parameter θ of Gumbel Copula is taken as 0.3, and expo-nential distribution is considered for the failure time, reliability model of the lathe can be obtained
(19)
∗1:∗2: · · · :15∗ =1:0.8971:0.7794:0.7941:
0.8676:0.8676:0.5735:0.6765:0.7647:0.6029:
0.6618:0.7500:0.6618:0.7026:0.4265,
(20)
˜
Rsys(t)∗=�1F1(t)� 1
F2(t)� 1
F3(t)· · ·� 1
F15(t)
×C0.3(F1(t),F2(t),F3(t),. . .,F15(t)), 0 200 400 600 800 1000 1200 1400 1600 1800 2000
0 0.1 0.2 0.3 0.4 0.5 0.6 0.7 0.8 0.9 1
Traditional series system based on independence
assumption
Considering correlation between feeding system and clamping
system( ) Considering correlation among all the
subsystems( )
Timet (h) Reliability of the lathe when considering different situations of failure correlatio
n
=0.3 θ
=0.3 θ
Figure 4 Reliability curves when considering different situations of failure correlation
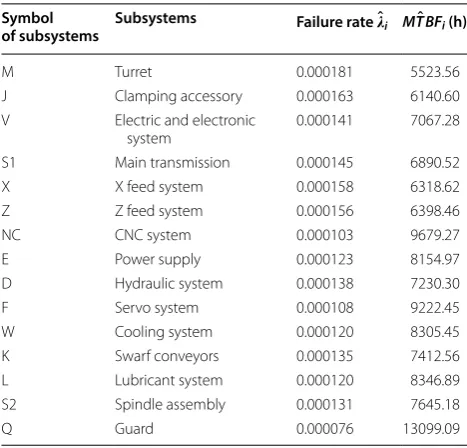
Table 2 Allocation results according to the method proposed in Ref. [24]
Symbol
of subsystems Subsystems Failure rate ˆi MT BFˆ i (h)
M Turret 0.000181 5523.56
J Clamping accessory 0.000163 6140.60
V Electric and electronic
system 0.000141 7067.28
S1 Main transmission 0.000145 6890.52
X X feed system 0.000158 6318.62
Z Z feed system 0.000156 6398.46
NC CNC system 0.000103 9679.27
E Power supply 0.000123 8154.97
D Hydraulic system 0.000138 7230.30
F Servo system 0.000108 9222.45
W Cooling system 0.000120 8305.45
K Swarf conveyors 0.000135 7412.56
L Lubricant system 0.000120 8346.89
S2 Spindle assembly 0.000131 7645.18
where Fi(t)=1−Ri(t)=1−e−i(t). Substituting Eq. (19) into Eq. (20) and letting Eq. (20) be equal to Robj=e−obj=e−0.002(t=1) , then λ
1
*= 0.000263. Allocation results are obtained according to Eq. (19) and MTBFi= 1/λi, which are shown in Table 3. It needs to state here that in this case, failure rate of Turret (M) is selected as the calculation standard. In fact, failure rate of any other subsystem will be the choice for the standard, and it will not cause change to the allocation results.
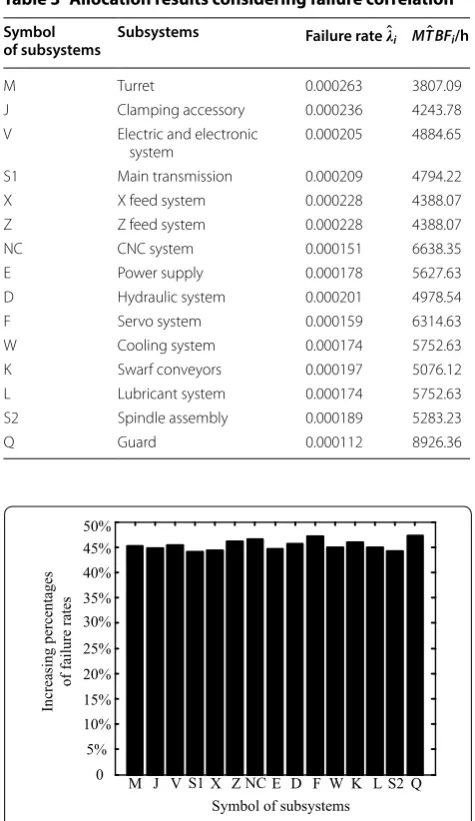
The increasing percentages of failure rates when failure correlation is considered compared with that in Ref. [24] are shown in Figure 5. It can be concluded that failure rates of each subsystem have been increased by 40% to 50%, while failure rate of the lathe is still 0.002. Therefore,
under the premise that MTBF of the lathe remains the same, reliability demands are lowered so that costs will be reduced to a large extent, which takes away unnecessary wastes and trouble for designers.
6 Conclusions
In this paper, a reliability model of CNC lathes consid-ering failure correlation among subsystems is established by using Copula function, and a reliability allocation method is proposed based on the model. Reliability of failure dependent subsystems is first calculated, which is multiplied by reliability expressions of other systems that are failure independent so that reliability model of the lathe is obtained. A reliability allocation method considering failure correlation is proposed by using the allocation vector calculated in any method based on fail-ure independence assumption and the model established before. From the theoretical analysis and the cases, the following conclusions can be drawn.
(1) CNC lathes are treated as failure dependent sys-tems considering failure correlation among subsys-tems, which are described based on Copula theory. Gumbel Copula is applied to establish reliability model. By comparing the model established in this paper and that based on independence hypothesis, it can be concluded that failure correlation model can give a more precise description of the actual running state and increase estimated or predicted reliability of CNC lathes.
(2) Based on the established model, a reliability alloca-tion method considering failure correlaalloca-tion is pro-posed. Ratios among failure rates to be allocated to each subsystem are obtained according to the allocation vector of any existing allocation method based on independence hypothesis, which are sub-stituted into the model established before to get the final results. The allocated failure rates by the method in this paper are higher than that of the method based on independence hypothesis while the MTBF of the lathe remains the same, so that the advantage of the proposed method lies in that costs for design and manufacture can be reduced to a large extent.
(3) Through a numerical case applying the theory in this paper, practicability, rationality and accuracy of the method in this paper is verified. Therefore, the present study can be helpful to the reliabil-ity design and analysis of series systems like CNC lathes or other mechanical systems having similar structures.
Table 3 Allocation results considering failure correlation
Symbol
of subsystems Subsystems Failure rate ˆi MT BFˆ i/h
M Turret 0.000263 3807.09
J Clamping accessory 0.000236 4243.78
V Electric and electronic
system 0.000205 4884.65
S1 Main transmission 0.000209 4794.22
X X feed system 0.000228 4388.07
Z Z feed system 0.000228 4388.07
NC CNC system 0.000151 6638.35
E Power supply 0.000178 5627.63
D Hydraulic system 0.000201 4978.54
F Servo system 0.000159 6314.63
W Cooling system 0.000174 5752.63
K Swarf conveyors 0.000197 5076.12
L Lubricant system 0.000174 5752.63
S2 Spindle assembly 0.000189 5283.23
Q Guard 0.000112 8926.36
Symbol of subsystems
M J V S1 X Z NC E D F W K L S2 Q 0
5% 10% 15% 20% 25% 30% 35% 40% 45% 50%
Increasing percentages
of failure rates
Authors’ Contributions
Y‑MZ was in charge of the whole trial; HW wrote the manuscript; ZY assisted with sampling and laboratory analyses. All authors read and approved the final manuscript.
Author Details
1 School of Mechanical Engineering and Automation, Northeastern University, Shenyang 110819, China. 2 Equipment Reliability Institute, Shenyang Univer‑ sity of Chemical Technology, Shenyang 110142, China.
Authors’ Information
Hao Wang, born in 1991, is currently a PhD candidate at Mechanical Reliability and Dynamics Research Center, Northeastern University, China. His research inter‑ ests include reliability design and reliability evaluation of mechanical systems.
Yi‑Min Zhang, born in 1958, is currently a professor and PhD candidate supervisor at Equipment Reliability Institute, Shenyang University of Chemical Technology, China. He is also the Chang Jiang Scholar. His main research interests include mechanical reliability engineering and mechanical dynamic design.
Zhou Yang, born in 1979, is currently an associate professor at Mechanical Reliability and Dynamics Research Center, Northeastern University, China. Her research interests include mechanical reliability design and fluid dynamics.
Competing Interests
The authors declare that they have no competing interests. Funding
Supported by National Natural Science Foundation of China (Grant Nos. 51135003, U1234208), National Basic Research Program of China (973 Program, Grant No. 2014CB046303), High‑class CNC Machine Tools and Basic Manufacturing Equipment of Important National Science and Technology Specific Projects (Grant No. 2013ZX04011‑011), National Key Laboratory of Mechanical System and Vibration Project (Grant No. MSV201402), Scientific Research Business Fund of Central Colleges and Universities (Grant No. N150304006), Excellent Talents Support Program for Colleges and Universities in Liaoning Province of China (Grant No. LJQ2014030).
Publisher’s Note
Springer Nature remains neutral with regard to jurisdictional claims in pub‑ lished maps and institutional affiliations.
Received: 12 April 2017 Accepted: 26 November 2018
References
[1] Y M Zhang. Connotation and development of mechanical reliability‑ based design. Journal of Mechanical Engineering, 2010, 46(14): 167–188. (in Chinese)
[2] Y M Zhang, Z L Sun. The reliability syllabus of mechanical products. Journal of Mechanical Engineering, 2014, 50(14): 14–20. (in Chinese) [3] J Wu, C Deng, X Y Shao, et al. A reliability assessment method based on
support vector machines for CNC equipment. Science in China Series E: Technological Sciences, 2009, 52(7): 1849–1857.
[4] C Y Li, S Guo, Y M Zhang, et al. Reliability optimization design for sto‑ chastic static deformation of computer numerical control lathe spindle. Proceedings of the Institution of Mechanical Engineers, Part B: Journal of Engineering Manufacture, 2016, 230(1): 83–90.
[5] Z Yang, P X Liu, Y P Zhu, et al. A comprehensive reliability allocation method for series systems based on failure mode and effects analy‑ sis transformed functions. Proceedings of the Institution of mechanical Engineers, Part B: Journal of Engineering Manufacture, 2016, 230(12): 2239–2248.
[6] Y Sun, L Ma, J Mathew, et al. An analytical model for interactive failures. Reliability Engineering & System Safety, 2006, 91(5): 495–504.
[7] Y Cheng, X P Du. System reliability analysis with dependent component failures during early design stage ‑ a feasibility study. Journal of Mechani-cal Design, 2016, 138(5): 051405.
[8] Y Chen, L Yang, C Ye, et al. Failure mechanism dependence and reliability evaluation of non‑repairable system. Reliability Engineering & System Safety, 2015, 138: 273–283.
[9] G X Shen, W B Zeng, Y Z Zhang, et al. Determination of the average main‑ tenance time of CNC machine tools based on type II failure correlation. Maintenance and Reliability, 2017, 19(4): 604–614.
[10] C Wang, H Zhang, Q W Li. Reliability assessment of aging structures subjected to gradual and shock deteriorations. Reliability Engineering & System Safety, 2017, 161: 78–86.
[11] M S Huang, Q H Wang, Y H Li, et al. An approach for improvement of avionics reliability assessment based on copula theory. 9th International Conference on Reliability, Maintainability and Safety, Guiyang, China, June 12–15, 2011: 179–183.
[12] P B Mou, F H Tao, C Z Jia, et al. A copula‑based function model in fuzzy reliability analysis on the planetary steering gear. International Conference on Quality, Reliability, Risk, Maintenance, and Safety Engineering, Chengdu, China, July 15–18, 2013: 375–378.
[13] Y Z Zhang, R Zheng, G X Shen, et al. Failure dependency of CNC equip‑ ment based on copula theory. Journal of Jilin University (Engineering and Technology Edition), 2011, 41(6): 1636–1640. (in Chinese)
[14] Z Z Chen, Y Liu, H Z Huang, et al. A reliability allocation method consider‑ ing failure dependence. ASME 2013 International Design Engineering Technical Conferences and Computers and Information in Engineering Conference, Portland, USA, August 4–7, 2013: V008T12A006.
[15] Z Liu, F H Tao, C Z Jia. Reliability analysis of series system based on copula function. China Measurement & Test, 2013, 39(1): 125–128. (in Chinese) [16] R B Nelsen. An introduction to Copulas. 2nd ed. New York: Springer Press,
2006.
[17] X Li. Methods and applications of COPULA. Beijing: Economy & Manage‑ ment Publishing House, 2014.
[18] A Sklar. Random variables, distribution functions, and copulas: a personal look backward and forward. Lecture Notes-Monograph Series, 1996, 28: 1–14.
[19] Y P You, R Fang, X H Li. Allocating active redundancies to k‑out‑of‑n reliability systems with permutation monotone component lifetimes. Applied Stochastic Models in Business and Industry, 2016, 32(5): 607–620. [20] J Y Tang, Y X Zhao, P He, et al. Copula new theory for reliability calculation
involving correlation in mechanical systems. Mechanical Science and Tech-nology for Aerospace Engineering, 2009, 28(4): 532–535, 541. (in Chinese) [21] T Chen, S L Zheng, H T Liao, et al. A multi‑attribute reliability allocation method considering uncertain preferences. Quality and Reliability Engi-neering International, 2016, 32(7): 2233–2244.
[22] S Chatterjee, J B Singh, A Roy. A structure‑based software reliability allocation using fuzzy analytic hierarchy process. International Journal of Systems Science, 2015, 46(3): 513–525.
[23] K H Chang. A novel reliability allocation approach using the OWA tree and soft set. Annals of Operations Research, 2016, 244(1): 3–22. [24] Y Q Wang, R Yam, M J Zuo, et al. A comprehensive reliability allocation
method for design of CNC lathes. Reliability Engineering & System Safety, 2001, 72(3): 247–252.
[25] K O Kim, Y Yang, M J Zuo. A new reliability allocation weight for reducing the occurrence of severe failure effects. Reliability Engineering & System Safety, 2013, 117: 81–88.
[26] O P Yadav, X Zhuang. A practical reliability allocation method considering modified criticality factors. Reliability Engineering & System Safety, 2014, 129: 57–65.
[27] X T Liu, S L Zheng, J Z Feng, et al. Reliability reallocation for fuel cell vehicles based on genetic algorithm. Quality and Reliability Engineering International, 2015, 31(8): 1495–1502.
[28] V Sriramdas, S K Chaturvedi, H Gargama. Fuzzy arithmetic based reliability allocation approach during early design and development. Expert Systems with Applications, 2014, 41(7): 3444–3449.
[29] X Zhuang, S Limon, O P Yadav. Considering modified criticality factor and functional dependency for reliability allocation purposes. Proceedings of the 2014 Industrial and Systems Engineering Research Conference, Montreal, Canada, May 31–June 4, 2014: 2602–2611.