Diffusion-Weighted Imaging Study in Euthymic
Patients with Bipolar I Disorder
Aslıhan C. Erden
1, Nesim Kugu
2, Ibrahim Oztoprak
3, Orhan Dogan
4, Gamze Akyuz
51MD, The Department of Psychiatry, Numune Hospital, Sivas-Turkey
2MD, Prof., Department of Psychiatry, School of Medicine, Cumhuriyet University, Sivas- Turkey
3MD, Assoc. Prof., Department of Radiology, School of Medicine, Cumhuriyet University, Sivas-Turkey
4MD, Prof., NP Hospital, Uskudar University, Istanbul-Turkey
5MD, Assoc. Prof., Retired, Izmir-Turkey Ya zış ma Ad re si / Add ress rep rint re qu ests to: Nesim Kugu, Prof., Department of Psychiatry, School of Medicine, Cumhuriyet University, Sivas-Turkey
Elekt ro nik pos ta ad re si / E-ma il add ress: [email protected]
Ka bul ta ri hi / Da te of ac cep tan ce: 6 Ağustos 2012 / August 6, 2012
Bağıntı beyanı:
A.C.E., N.K., I.O., O.D., G.A.: Yazarlar bu makale ile ilgili olarak herhangi bir çıkar çatışması bildirmemiştir.
Declaration of interest:
A.C.E., N.K., I.O., O.D., G.A.: The authors reported no conflict of interest related to this article.
ÖZET:
Ötimik iki uçlu I bozukluğu olan hastalarda diffüz-yon ağırlıklı görüntüleme çalışması
Amaç: Ötimik iki uçlu I bozukluğu olan hastalarda
dif-füzyon ağırlıklı MR görüntüleme kullanılarak olası beyaz madde anormalliklerinin varlığı ve görünür difüzyon katsa-yısı (GDK) değişiklikleri araştırıldı.
Yöntem: Bu çalışmaya 30 hasta (12 kadın,18 erkek) alındı.
Dört hafta boyunca Young Mani Derecelendirme ölçeğin-den en az 5 veya altında puan alan ve Hamilton Depresyon Derecelendirme Ölçeğinden 7 veya altında puan alan hastalar ötimik olarak kabul edildi. Kontrol grubuna yaş ve cinsiyet olarak iki uçlu olgularla eşleştirilmiş 30 sağlıklı birey dahil edildi. GDK değişiklikleri, beyaz madde dokusu-nun en çok bulunduğu corpus callosum genusu ve frontal, temporal ve oksipital loblardan simetrik olarak elde edildi.
Sonuçlar: İki uçlu bozukluk grubundaki ortalama GDK
değeri 856.53±88.31x10⁻³mm/s ve kontrol grubundaki
ortalama GDK değeri 778.89±89.67x10⁻³mm/s bulundu.
Kontrol grubuna gore iki uçlu hastalarda sağ frontal bölge ortalama GDK değerleri daha düşük bulundu ancak fark-lılık istatistiksel olarak anlamlı değildi. Bununla birlikte, sol hemisferde anlamlı düşüklük vardı (p<0.05). İki uçlu bozukluk grubunda kontrol grubuna göre oksipital loblar ve hem sağ hem de sol temporal bölgeden elde edilen ortalama GDK değerlerindeki yükseklik, istatistiksel olarak anlamlıydı (p<0.05).
Tartışma: Bu çalışmanın sonuçlarına gore, ötimik iki uçlu
bozukluk hastalarında artmış GDK değerleri, beyaz mad-dedeki bozulma ile ilişkili olabilir. Ayrıca, frontal bölgeden elde edilen azalmış GDK değerleri, bu bozulmanın geri dönüşlü olabileceğini düşündürmektedir.
Anahtar sözcükler: iki uçlu bozukluk, diffusion-ağırlıklı
görüntüleme, ötimi, beyaz madde
Journal of Mood Disorders 2012;2(3):95-101
ABS TRACT:
Diffusion-weighted imaging study in euthymic patients with bipolar I disorder
Objective: To examine the possible presence of white
matter abnormalities and apparent diffusion coefficient (ADC) changes by using diffusion-weighted magnetic resonance (MR) imaging, in patients with euthymic bipolar I disorder.
Method: Thirty patients (12 women, 18 men) were
included in this study. The patients, whose total Young Mania Rating Scale points were 5 or less at least for four weeks, and whose total Hamilton Depression Rating Scale points were 7 or less were considered as euthymic. The control group was consisted of age and gender matched 30 healthy individuals. ADC values were obtained symmetrically from the frontal, temporal, and occipital lobes and the genu of the corpus callosum, where white matter tissue was the largest.
Results: The mean ADC value of the bipolar group was
determined as 856.53±88.31x10⁻³mm/s, and that of the
control group was 778.89±89.67x10⁻³mm/s. The mean ADC
values on the right frontal area was found to be lower in bipolar patients as compared to that of the control group, but the difference was statistically insignificant. However, it was found significantly lower on the left hemisphere (p<0.05). The increases of the mean ADC values obtained from both right and left temporal and occipital lobes of bipolar group were found to be statistically significant as compared to those of the control group (p<0.05).
Conclusions: According to the results of this study, the
increased ADC values in euthymic bipolar patients may probably be related to the disintegration of white matter. Besides, decreased ADC values obtained from the frontal areas suggest that the disintegration might be reversible.
Key words: bipolar disorder, diffusion-weighted imaging,
euthymia, white matter
Journal of Mood Disorders 2012;2(3):95-101
INTRODUCTION
Although bipolar disorder is a widespread and i m p o r t a n t p s y c h i a t r i c d i s o r d e r , t h e t r u e neurophysiological basis of this disorder is yet unknown
(1). In patients with bipolar disorder many cerebral imaging studies have revealed volume changes in spesific areas of brain, such as temporal lobes, frontal lobes, and subcortical areas (2).
communication between brain areas, thus, white matter studies may give some information about the integrity of the neuronal circuitry (3). Diffusion Tensor Imaging (DTI) and Diffusion-weighted Imaging (DWI) can demonstrate microstructural changes in the white matter via the quantitative evaluation of diffusion of water in brain tissue (4,5). The rate of water diffusion is measured by apparent diffusion coefficient (ADC) and it is inversely related to the integrity of the tissue examined (5). Therefore DWI can show focal or diffuse abnormalities in white matter integrity (6). DTI, on the other hand, gives information about the direction of the diffusion via the measurement of anisotropy, which quantitatively shows the course of water diffusion in brain tissue (4).
Although many studies concerning the detection of morphometric abnormalities in white matter in bipolar disorder exist, their results are not consistent (5). In a study by Adler et al., DWI and ADC measurements were obtained from prefrontal white matter in bipolar patients and no significant difference was found as compared with the control group (7). In a DTI study left and right orbital frontal white matter ADC values were found to be significantly higher in bipolar group than that of the control group (8). In addition, ADC values of bipolar group were found significantly higher as compared with ADC values of control group in a recent DWI study carried out by Regenold et al. (5).
The present study is hypothesized on the idea that white matter abnormalities is also present in euthymic period of the bipolar disorder. So we aimed to test this hypothesis by studying the presence or absence of white matter abnormalities in euthymic bipolar disorder patients by using DWI.
METHODS
In this study, DWI was performed on 30 patients with euthymic bipolar I disorder and 30 healthy individuals.
Subjects
The study protocol was submitted to the Ethical Committee of Cumhuriyet University School of Medicine and a written approval was obtained.
Patients with bipolar disorder who were admitted to the Psychiatry Outpatient Clinics of the Hospital of
Cumhuriyet University School of Medicine between August 2005 and April 2006 were included in this study. The DSM-IV diagnostic criteria were used for the diagnosis of bipolar disorder and diagnoses was validated by applying Structured Clinical Interview for DSM-IV Axis-I Disorders (SCID-I) (9). Sociodemographic data form, which included questions about age, gender, education level, duration of disorder, and number of episodes, was applied to 30 bipolar patients composed of 12 women and 18 men, and to the control group. SCID-I and Structured Clinical Interview for DSM-III-R Personality Disorders (SCID-II) (9,10) criteria were used to determine the presence of any psychiatric disorders in the bipolar group and the control group.
The patients were selected according to the following criterias: being within the age range of 18-45, having no previous or current history of alcohol or drug use, abuse, or dependence, having intelligence quotient (IQ) level of higher than 70, being right-handed, not having any major medical illness, neurological diseases, or Axis-I or Axis-II disorders other than bipolar disorder, and having a negative pregnancy test for female participants.
The patients involved in this study had been followed up and treated at least for two years in our outpatient clinics. The patients whose Young Mania Rating Scale total points were 5 or less for at least four weeks, and the ones whose total Hamilton Depression Rating Scale points were 7 or less were accepted as euthymic (11,12). At the same time, the patients were followed up for one month or longer to determine whether they kept being euthymic after the DWI or not. One of the patients was excluded from the study, since he/she developed a manic episode during the follow up session performed two weeks after the DWI.
In the course of sampling of the patient and the control groups, detailed history of the individuals was recorded and their physical examinations were performed. The routine laboratory tests included complete blood count, blood glucose level, liver and kidney function tests, serum electrolyte levels, erythrocyte sedimentation rate, and complete urine analysis. The postero-anterior chest radiographs and electrocardiograms of patients were performed. The individuals, who had any pathological findings, were excluded from the study.
group matched with the patient group according to age, gender, education level, and cigarette smoking frequency. The individuals, who had head trauma or a history of alcohol or drug usage, were not included.
Eighteen patients were on mood stabilizers during the study. Eleven patients were on lithium, three patients were on carbamazepine, and four patients were on valproic acid therapy, and the average doses for these drugs were 1000 mg/day, 1000 mg/day, and 1125 mg/day, respectively.
MR Imaging
MR examinations were performed with a 1.5-Tesla scanner (Exelart, Toshiba, Tokyo, Japan) using standard head coils. T2-weighted fast spin-echo images was obtained using following parameters (TR:5000; TE:94; flip angle:90/180; number of excitation:2; field of view: 180x220 mm; matrix: 224x320; slice thickness: 5 mm; slice interval:1 mm) and DWI was obtained using an echo planar imaging (EPI) sequence (TR:5000ms; TE:130 ms; flip angle:90/180; number of excitation 1; field of view: 270x320 mm; matrix: 128x128; slice thickness: 5 mm; interslice gap: 2 mm; b value: 0, and 1000 s/mm2).
Diffusion gradients were applied in the three orthogonal directions to generate three sets of DWI (x, y, and z axes).
Individuals whose T2 images revealed normal findings were included in the study. ADC maps were automatically generated by the MR unit. ADC measurements were performed using standard region of interest (ROI) (10 mm2) on ADC maps. For constructing sampling area,
measurements were carried out on the areas where frontal and occipital lobes were able to be observed at the
same time and where white matter was largest on each lobe. On temporal lobes as well, the areas were chosen where white matter was largest. Attention was paid for the sampling area not to include gray matter. The parietal lobes were excluded from the study for MR apparatus was only able to perform DWI on limited amount of area. On corpus callosum, on the other hand, measurements were carried out within a 0.40 mm2 area on genu region.
Statistical Analysis
Statistical analysis was performed using the SPSS 12.0 software. Student-t test and chi-square test were used for data analysis. Results were displayed on tables as arithmetical mean ± standard deviation, subject number, and their percentages.
RESULTS
The mean ages of the patient group and the control group were 31.26±8.34 and 31.96±6.17 years, respectively. The age range of bipolar group was 19-43 and that of the control group was 22-42. The average duration of the disorder was 9.63±5.64 year and the average number of episodes was 4.06±2.11. First degree relatives of eight patients also had a history of mood disorder. The difference between the patient and the control group with respect to their ages, gender, and education level was not statistically significant (p>0.05). Sociodemographic and clinical findings of the patient and the control groups are shown in Table 1.
A negative but statistically insignificant correlation was found between age and ADC values of right frontal
Tab le 1: Sociodemographic and clinical characteristics of the patient and the control group
Patient group Control group
Characteristics N (%) N (%) t χ2 p
Age (mean±SD) 31.26 ± 8.34 31.96 ± 6.17 0.36 0.71
Gender 0.27 0.60
Female 12 (40) 14 (46.7)
Male 18 (60) 16 (53.3)
Education level 4.45 0.21
Primary school 18 (60) 21 (70)
High school 9 (30) 7 (23.3)
University 3 (10) 2 (6.7)
Duration of disorder (yr) 9.63 ± 5.64
(r=-0.01), left frontal (r=0.12), right temporal (r=-0.07), left temporal (r=0.12) right occipital (r=-0.33), and left occipital (r=-0.32) areas and corpus callosum (r=0.06).
No significant difference was found between ADC values of bipolar and control group with respect to their gender. When women in bipolar group compared to women in control group, a statistically significant difference (p<0.05) was found between the ADC values of left temporal (p=0.03), right occipital (p=0.03), and left occipital (p=0.01) regions. ADC values of these regions were higher in bipolar group than the control group. As a result of comparison of men in bipolar group to men in control group, the difference in ADC values in the left frontal (p=0.40), right temporal (p=0.00), left temporal (p=0.00), right occipital (p=0.00), and left occipital (p=0.00) regions were found to be statistically significant (p<0.05). In these regions as well, the ADC numbers of bipolar group were higher than that of the control group. A negative but statistically insignificant (p>0.05) correlation was found between the duration of the disorder and the ADC values of the right frontal (r=-0.40), right temporal (r=-0.04), right occipital (r=-0.15), and left occipital (r=-0.24) regions. A positive but insignificant correlation was found (p>0.05) between the duration of the disorder and the ADC values of the left frontal (r=0.08), and left temporal (r=0.03) region, and the corpus callosum (r=0.12).
The difference between ADC values of smoking and nonsmoking bipolar patients and healthy controls was found to be statistically insignificant (p>0.05)
Total ADC values of the patient group (856.53±88.31x10⁻³mm2/s) were significantly higher than
those of the control group (778.89±89.67x10⁻³mm2/s)
(t=3.18, p=0.00).
The ADC values of right frontal region in bipolar group were lower than those of the control group, but the
difference was statistically insignificant (p>0.05); however they were significantly lower in left frontal region (p<0.05). The ADC values obtained from the right and the left temporal lobes, and the right and the left occipital lobes of the patient group were found to be significantly higher as compared to those of the control group (p<0.05) (Table 2). The ADC values obtained from the genu of the corpus callosum were lower in the bipolar group, and the difference was statistically significant (p<0.05).
DISCUSSION
ADC Measurements
Our study is the DWI study focusing on patients with bipolar I disorder only in their euthymic period. Total ADC values (856.53±88.31x10⁻³mm2/s) in patients with bipolar I
disorder in our study was significantly higher than the ADC values of the control group (778.89±89.67x10⁻³mm2/s).
This finding was consistent with the results of other studies which revealed ADC variations in bipolar disorder (5,8).
It was suggested that microstructural variations were high on frontal lobes in functional and morphometric brain imaging studies (13,14). The ADC values obtained from the frontal lobes of bipolar group were lower on the right lobe as compared to that of control group but the difference was not statistically significant. In the literature Regenold et al. (2006) had performed in patients with bipolar disorder and on their DWIs, they found total ADC values of bipolar group to be higher than the control group and their results were similar to our findings. In the same study, they found ADC values of the right and the left frontal lobes to be significantly higher in patients with bipolar disorder. On the contrary, our study revealed lower ADC numbers in right frontal areas of the bipolar
Tab le 2: ADC values of the patient and the control group
Patient group Control group
Areas of measurement Mean±SDx10-3 mm2/s Mean±SDx10-3 mm2/s t p
Right frontal (743.43±92.82)x10-3 (772.16±75.99)x10-3 1.31 0.19
Left frontal (729.03±91.51)x10-3 (781.73±64.69) x10-3 2.85 0.00
Right temporal (847.96±54.05)x10-3 (786.10±96.12)x10-3 3.07 0.00
Left temporal (821.03±49.10)x10-3 (775.20±95.52)x10-3 2.33 0.02
Right occipital (861.90±74.15)x10-3 (789.93±116.97)x10-3 2.85 0.00
Left occipital (842.66±58.54)x10-3 (781.06±83.94)x10-3 3.29 0.00
group, which were statistically insignificant. The patient group in Regenold et al.’s (2006) study, consisted of a small number of relatively older patients with a severe course, mostly in their manic and mixed episodes, and the control group consisted of individuals who had any neurological disorder other than stroke, and who did not show any evident diffusion pathology. Our findings related to frontal lobes may suggest restriction of intercellular water movement within the white matter during the euthymic episode of patients with bipolar disorder. Although it is difficult to explain, when our findings are evaluated together with the findings of the Regenold et al.’s (2006) study, it could be thought that the ADC values increase during manic and mixed episodes
and decrease during the euthymic period, and increase in ADC values during manic and mixed episodes could be as a result of a reversible functional deficiency occurring in the frontal lobes. However, the findings of our study do not confirm this hypothesis, and further studies are required for better understanding of the true pathophysiological mechanisms underlying the white matter diffusion abnormalities in bipolar disorder.
In another DTI study carried out by Adler et al. (7), no significant difference was found in ADC values with respect to control group. They measured ADC values only on a quite limited number of patients and only from their frontal lobes. The group size was small and clinical conditions of patients were not mentioned. We found
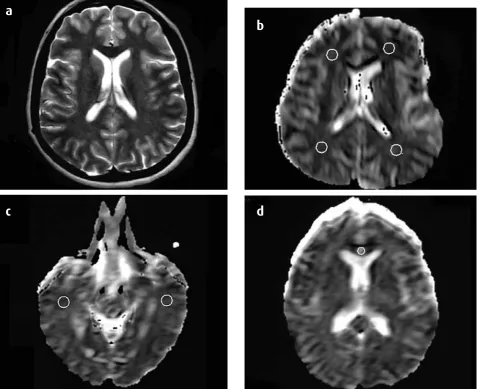
Figure 1: Axial T2-weighted image shows white matter areas that do not include focal hyperintensities (a). Axial ADC maps showing determined measurement areas (ROIs) on bilateral frontal and occipital lobes (b), temporal lobes (c), and the genu of the corpus callosum (d).
a
c
d
diminished ADC values in the left frontal lobe and we compared ADC values of 30 patients with bipolar I disorder who were in their euthymic phase to those of 30 healthy individuals. The difference between these two studies may be due to the latter facts.
There are studies which revealed volume changes in temporal lobes of bipolar patients, such as volume decrease in bilateral temporal lobes (15) and volume increase in left temporal lobe (16). In our study, the ADC values obtained from temporal lobes of bipolar group were significantly higher. Higher, but statistically insignificant on the right, the ADC values on both sides were determined in Regenold et al.’s (2006) study, which, as far as we know, is the only study in which ADC values were obtained from the temporal lobes. In our study, the ADC values obtained from both occipital lobes were significantly higher compared to the control group. Similarly, Regenold et al. (2006) also determined high ADC values in the same region, but the difference has been found to be statistically insignificant.
Even though recent studies have shown increased (17) or decreased (18,19) corpus callosum fractional anisotrophy (FA) values, these results seems to be contradictory. In our study, an important limitation was the absence of DWI data from other sub-regions of corpus callosum, including anterior body, posterior body, and splenium. Therefore, we have to assess the findings we obtained from corpus callosum with caution.
Limitations
Our study has certain limitations. More than half of our patients were using mood stabilizers. Although potential neurotoxic and neurotrophic effects of psychotropic drugs were known, it has been mentioned that they do not cause any evident alteration in DTI study findings (7). On the other hand, in an MRI study, it has been shown that lithium shortened T1 relaxation time of water hydrogen protons by diminishing free movement of water (5). Although a relation between smoking and increase in the hyperintense
areas in white matter has been demonstrated in some studies, in some other studies, this finding has not been supported (20,21). In our study, no significant difference was found among smokers and nonsmokers when the ADC values were compared. A DWI study revealed an increase in the ADC values within the hyperintense areas of white matter (22). We did not focus on the white matter hyperintensities in our study but, since the white matter hyperintensities have been encountered in nearly half of the bipolar patients, special attention has been paid for not to perform measurements in hyperintense areas determined in T2 spin echo images. Despite the tendency of increase in the ADC values with increasing age, total ADC values we measured in our study was quite near to those obtained from the study performed by Regenold et al. (2006). No significant relation was established between ADC values and age in our study. No significant difference between the ADC numbers of women and men has been observed, either, similar to many previous studies in which emphasis have been made on the absence of any significant influence of gender on diffusion (5,23,24).
In spite of these limitations, our study has the feature of being the first to demonstrate an insignificant decrease of ADC values on right frontal lobes, a significant decrease on left frontal lobes, and on the other hand, a significant increase on temporal and occipital lobes of euthymic patients with bipolar disorder.
CONCLUSION
In conclusion, further studies with larger samples and more than one imaging methods, should be conducted, and the same patients should be scanned in various episodes of their disorder, and repeating those studies with individuals who carry risk for this disorder, such as the first degree healthy relatives of the patients, with adolescents who have family history, with patients who have never used medication before, and with patients in their first manic episode would yield more specific data about this disorder.
References:
1. Strakowski SM, DelBello MP, Adler CM. The functional neuroanatomy of bipolar disorder: a review of neuroimaging findings. Mol Psychiatry 2005; 10:105-116.
3. Sun Z, Wang F, Cui L, Breeze J, Du X, Wang X, Cong Z, Zhang H, Li B, Hong N, Zhang D. Abnormal anterior cingulum in patients with schizophrenia: a diffusion tensor imaging study. NeuroReport 2003; 14:1833-1836.
4. Kalus P, Buri C, Slotboom J, Gralla J, Remonda L, Dierks T, Strik WK, Schroth G, Kiefer C. Volumetry and diffusion tensor imaging of hippocampal subregions in schizophrenia. NeuroReport 2004; 15: 867-871.
5. Regenold WT, D’Agostino CA, Ramesh N. Diffusion - weighted magnetic resonance imaging of white matter in bipolar disorder: a pilot study. Bipolar Disord 2006; 8:188-195.
6. Papanikolaou N, Karampekios S, Papadaki E, Malamas M, Maris T, Gourtsoyiannis N. Fractional anisotropy and mean diffusivity measurements on normal human brain: comparison Between low - and high - resolution diffusion tensor imaging sequences. Eur Radiol 2006; 16:187-192.
7. Adler CM, Holland SK, Schmithorst V, Wilke M, Weiss KL, Pan H, Strakowski SM. Abnormal frontal white matter tracts in bipolar disorder: a diffusion tensor imaging study. Bipolar Disord 2004; 6:197-203.
8. Beyer JL, Taylor WD, MacFall JR, Kuchibhatla M, Payne ME, Provenzale JM, Cassidy F, Krishnan KR. Cortical white matter microstructural abnormalities in bipolar disorder. Neuropsychopharmacology 2005; 30:2225-2229.
9. Ozkurkcugil A, Aydemir O, Yildiz M, Esen Danaci A, Koroglu E. The reliability of Structured clinical interview for DSM – IV clinical version (SCID -I / CV) for Turkey (in Turkish). Ilac ve Tedavi Dergisi 1999; 12:233-236.
10. Coskunol H, Bagdiken I, Sorias S. The reliability of SCID-II
interview in personality disorders (in Turkish). 28th National
Congress of Psychiatry 1992, Ankara, Turkey.
11. Hamilton M. A rating scale for depression. J Neurol Neurosurg Psychiatry 1960; 23:56-62.
12. Young RC, Biggs JT, Ziegler VE, Meyer DA. A rating scale for mania: reliability, validity and sensitivity. Br J Psychiatry 1978; 133:429-435.
13. Soares JC, Mann JJ. The anatomy of mood disorders review of structural neuroimaging studies. Biol Psychiatry 1997; 41:86-106.
14. Strakowski SM, DelBello MP, Adler CM, Cecil DM, Sax KW. Neuroimaging in bipolar disorder. Bipolar Disord 2000; 2:148-164.
15. Altshuler LL, Conrad A, Hauser P, Li XM, Guze BH, Denikoff K, Tourtellotte W, Post R. Reduction of temporal lobe volume in bipolar disorder: a preliminary report of magnetic resonance imaging. Arch Gen Psychiatry 1991; 48:482-483.
16. Harvey I, Persaud R, Ron MA, Baker G, Murray RM. Volumetric MRI measurements in bipolar compared with schizophrenics and healthy controls. Psychol Med 1994; 24:689-699.
17. Heng S, Song AW, Sim K. White matter abnormalities in bipolar disorder: insights from diffusion tensor imaging studies. J Neurol Transm 2010; 117:639-654.
18. Wang F, Kalmar JH, Edmiston E, Chepenik LG, Bhagwagar Z, Spencer L, Pittman B, Jackowski M, Papademetris X, Constable RT, Blumberg HP. Abnormal corpus callosum integrity in bipolar disorder: diffusion tensor imaging study. Biol Psychiatry 2008; 730-733.
19. Macritchie KA, Lloyal AJ, Bastin ME, Vasudev K, Gallagher P, Eyre R, Marshall I, Wardlaw JM, Ferrier IN, Moore PB, Young AH. White matter microstructural abnormalities in euthymic bipolar disorder. Br J Psychiatry 2010; 196:52-58.
20. Liao D, Cooper L, Cai J. The prevalence and severity of white matter lesions, their Relationship with age, ethnicity, gender and cardiovascular disease risk factors: the ARIC Study. Neuroepidemiology 1997; 16:149-162.
21. Yetkin FZ, Fischer ME, Papke RA, Haughton VM. Focal hyperintensities in cerebral White matter on MR images of asymptomatic volunteers: correlation with social and medical histories. Am J Roentgenol 1993; 161:855-858.
22. Taylor WD, Sionne L, Perkio J. Evidence of white matter tract disruption in MR hyperintensities. Biol Psychiatry 2001; 50:179-183.
23. Helenius J, Soinne L, Perkio J, Salonen O, Kangasmaki A, Kaste M, Carano RA, Aronen HJ, Tatlisumak T. Diffusion - weighted MR imaging in normal human brains in various age groups. Am J Neuroradiology 2002; 23:194-199.