O R I G I N A L A R T I C L E
Open Access
Effect of quantity and intensity of pulsed
light on human non-visual physiological
responses
Qianying Dai
1*, Yuria Uchiyama
1, Soomin Lee
2, Yoshihiro Shimomura
1and Tetsuo Katsuura
1Abstract
Background:Exposure to pulsed light results in non-visual physiological responses in humans. The present study aims to investigate whether such non-visual effects are influenced to a greater extent by the intensity of lighting or by the power (quantity) of lighting.
Methods:>Twelve healthy young male participants (23 ± 0.3 years, 21–24 age range) were recruited for the present study. Participants were exposed to light of varying levels of intensity and quantity whose frequency was held constant across the conditions, which consisted of exposure to blue (different intensity, constant quantity) and white (constant intensity, different quantity) LEDs. Pupillary constriction, electroencephalogram (EEG) alpha band ratio, subjective sleepiness, concentration and perception of blueness were measured.
Results:Pupillary constriction and subjective concentration were significantly greater under the high-intensity and short pulse width (HS) condition than under the low-intensity and long pulse width (LL) conditions at three time points during exposure to high-intensity light. However, no significant differences were observed among the results at the three time points during exposure to different quantities of pulsed light.
Conclusions:The results of the present study indicate that non-visual influences of pulsed light on
physiological function are mainly determined not by the quantity but by the intensity of the emitted light, with relatively higher levels of intensity producing more significant physiological changes, suggesting potent excitation of intrinsically photosensitive retinal ganglion cells.
Keywords: Non-visual effect, Pulsed light, Quantity, Radiant flux, Power, Intensity, Irradiance, Pulse width, Pupillary constriction, Subjective evaluation, EEG, ipRGC
Introduction
Recent research has indicated that exposure to light results in non-visual physiological effects in humans [1–9], as well as visual effects (brightness or spectral distribution). Such research has resulted in the discovery of a third class of pho-toreceptors in the mammalian retina known as intrinsically photosensitive retinal ganglion cells (ipRGCs), which have a peak sensitivity to short-wavelength light of around 480 nm [10, 11]. Therefore, the strongest non-visual effects should result from exposure to blue light [10]. Indeed, research has indicated that exposure to blue light results in increased
pupillary constriction [12], increased alertness [13–16], im-proved cognitive performance [17], suppression of mela-tonin [18] and phase advanced circadian rhythms [19].
Further, recent reports have revealed that intermittent pulses of light evoked greater non-visual responses than continuous light [20–22]. In our previous study, we mixed short pulses (100μs) of blue light with white light and ob-served increased pupillary constriction even when partici-pants could not perceive the light as blue [23]. This result suggests that such illumination, which participants per-ceive as white, may allow workers to maintain higher levels of arousal in an office setting.
The irradiance of light refers to the radiant flux (power or quantity: the product of pulse width and intensity) re-ceived by a surface per unit area (W/m2). The irradiance
* Correspondence:[email protected];[email protected]
1Graduate School of Engineering, Chiba University, 1-33 Yayoicho, Inage-ku,
Chiba 263-8522, Japan
Full list of author information is available at the end of the article
of pulsed light is often termed “intensity” (W/m2/s), though this term actually refers to the irradiance of a sur-face per unit frequency (W/m2/Hz or W/m2/s) or wave-length (W/m2/nm) in radiometry, leading to confusion with quantity or intensity of light (https://en.wikipe-dia.org/wiki/Irradiance). The aim of the present study was to investigate the non-visual effects of irradiance of pulsed light, in different levels of intensity and quantity via assess-ment of human pupillary constriction, electroencephalogram (EEG) alpha band ratio and subjective experiences of sleepi-ness in order to determine whether the intensity or quantity of light is the main factor influence non-visual physiological responses in humans under pulsed light conditions. The re-sults of this analysis may further enhance our understanding of the non-visual effects of pulsed lighting and clarify the mechanisms underlying the differential responses for varying combinations of intensity and quantity of pulsed light.
We chose to analyse pupillary constriction for two rea-sons. First, measurements of pupillary constriction can be obtained relatively quickly, facilitating the testing of many stimulus combinations. Second, the amplitude and time course of pupillary constriction parallel to those of ipRGC photoresponses [24], suggesting that this behav-iour can serve as a readout of ipRGC activity. That is, a stimulus inducing robust pupillary constriction may be inferred to strongly excite ipRGCs. We further evaluated the EEG alpha band, concentration and sleepiness in order to assess the non-visual effects of light on alert-ness [13–16] and cognitive performance [17], which have been reported to be associated with the activity of ipRGCs. Perceived blueness was also measured in order to distinguish whether the observed responses were re-lated to the visual or non-visual effects of light.
Methods
Twelve healthy males (23 ± 0.3 years, 21–24 age range) pro-vided informed consent to participate in the present study. All participants were classified as having normal colour per-ception after completing the Farnsworth-Munsell 100 Hue Test [25]. Participants were instructed to avoid caffeinated beverages, alcohol and pain medication and to obtain seven consecutive hours of sleep one day prior to participation in the experiment. The present study was approved by the Bioethics Committee of the Graduate School of Engineer-ing at Chiba University (No. 24–17).
Air temperature and relative humidity in the experiment room were controlled at 23 °C and 50%, respectively. An integrating sphere with light-emitting diodes (LEDs) was used as the lighting device. Participants sat on a chair with their heads facing a diffusion panel, which was located in front of the integrating sphere, as depicted in Fig. 1.
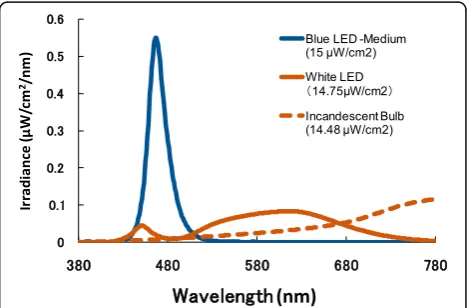
An incandescent bulb (irradiance 14.48 μW/cm2; colour temperature 2524 K) was used as the base light, while the blue and white LEDs (irradiance 14.75 μW/cm2; colour
temperature 2878 K) of the stimulus light source were arrayed in the integrating sphere. The spectral distribution curves for the blue LEDs, white LEDs, and incandescent bulb were using a spectroradiometer (HSR-8100, Maki Manufacturing Co., Ltd., California, USA). The spectral dis-tribution curves are depicted in Fig. 2. The peak wavelength of the pulsed blue light emitted by LEDs was 467 nm.
In the present study, in order to distinguish the effects of the intensity and quantity of pulsed light, we compared re-sponses across three pulsed lighting conditions consisting of blue light (different intensity, constant quantity) and white light (constant intensity, different quantity) of equal frequencies (1 ms, 1000 Hz). The irradiance of all three conditions was measured at the participant’s eye level, as depicted in Fig. 3. Three blue pulsed lighting conditions with constant quantity (products of both intensity and pulse width) were implemented as follows: high intensity
Fig. 1Layout of the experiment. An integrating sphere with light-emitting diodes (LEDs) was used as the lighting device, and the irradiance of lights was controlled by a computer programme. Participants sat on a chair with their heads facing a diffusion panel, which was located in front of the integrating sphere. Pupil diameter was measured in the left eye using an EMR-8 eye-tracking system with an infrared camera (Nac Image Technology, Inc., Japan)
(30μW/cm2) and short pulse width (50μs) (HS condition); medium intensity (15 μW/cm2) and medium pulse width (100μs) (MM condition); low intensity (7.5μW/cm2) and long pulse width (200 μs) (LL condition). White pulsed light conditions of equal intensity (14.75μW/cm2) were im-plemented as follows: long pulse width (950μs) (HS condi-tion); medium pulse width (900μs) (MM condition); short pulse width (800μs) (LL condition).
The intensity of blue light was highest in the HS condi-tion, followed by the MM condition and reaching its lowest value in the LL condition. The quantity of white light was the highest in the condition HS, followed by the MM con-dition and reaching its lowest value in the LL concon-dition. Longer durations of exposure to pulsed light were associated with larger differences in quantity among the three light
conditions, such that the quantity was highest after 8 min than after 4 min, which was higher than that after 5 s. All light conditions resulted in light of equivalent frequency (1 ms, 1000 Hz). The pulsed blue and white lights of the stimulus light source were turned on and off in a constant, alternating fashion, with light pulses occurring every 1 ms (1000 Hz).
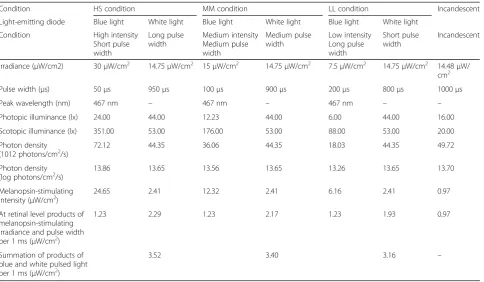
The characteristics of each pulsed light condition at the participant’s eye level for the three light conditions are shown in Table 1. The irradiance was calculated in the range of 380 to 780 nm. The melanopsin-stimulating irradi-ance and photon density at the retinal level during each light condition are also described in Table 1. Melanopsin-stimulating irradiance and photon density were estimated [26] based on the spectral absorption of the crystalline lens [27] and a template [28] indicating the spectral absorption characteristics of the photopigment with a peak wavelength of 484 nm [10].
Study protocol
The experimental protocol is summarised in Fig. 4. Partici-pants were instructed to sit quietly at rest and maintain the same posture in order to ensure similar exposure during each lighting condition. Participants rested for 11 min under the base lighting condition (15 μW/cm2; 2524 K) prior to exposure to stimulus lighting conditions. In addition to measuring pupillary constriction and EEG alpha band ratio (8–13 Hz), we assessed subjective sleepiness and concentration using the Visual Analogue Scale (VAS). Fur-ther assessment of subjective sleepiness was conducted using the Kwansei Gakuin Sleepiness Scale (KSS). The KSS estimates wakefulness according to the presence of sleep symptoms and is often used in conjunction with the VAS assessment of sleepiness and other physiological indices for more effective overall evaluation of sleepiness [29, 30]. Par-ticipants were also asked to report subjective blueness for each light condition. Changes from before and during ex-posure to stimulus lighting conditions were also recorded. Each stimulus lighting condition lasted 12 min. In order to ensure sufficient recovery of pupil diameter, an interval of approximately 5 min was included between successive stimulus lighting conditions. The three stimulus lighting conditions were performed at approximately the same time on two different days. The order of the three lighting condi-tions was counterbalanced among the participants.
Pupil diameter of the left eye was measured using an eye-tracking system (EMR-8; NAC Image Technology Inc., Japan), and the extent of pupillary constriction was calculated as follows (Formula 1):
Fig. 3Three lighting conditions. Participants were exposed to three lighting conditions whose product was held constant. HS condition: high irradiance (30 kμW/cm2) and short pulse width (50μs); MM condition: medium irradiance (15μW/cm2) and medium pulse width (100μs); LL condition: low irradiance (7.5μW/cm2) and long pulse width (200
μs)
percentage of pupillary constrictionð Þ ¼% ½ðbaseline pupil diameter–pupil diameter during stimulus lighting conditionÞ=baseline pupil diameter
Baseline pupil diameter was recorded as the mean value obtained 20 s prior to pulsed light exposure. Pupil diameters for the stimulus lighting conditions were re-corded as the mean value obtained over 20 s following an initial exposure period of 5 s and then again after 4 and 8 min.
Based on the international 10–20 system for electroen-cephalography, three EEG electrode locations were se-lected for evaluation of the non-visual effects of light on alertness: Fz (frontal region), Cz (central region) and Pz (occipital region). EEG activity was recorded at the Fz, Cz and Pz electrode sites using the linked earlobe elec-trodes as a reference. EEG signals were amplified using a multichannel bioamplifier (MP150 system, BIOPAC Sys-tems, California, USA) with a time constant of 0.3 s using a low-pass filter of 35 Hz and a high-pass filter of 0.05 Hz. Alpha band signals were defined as those falling within the 8–13 Hz frequency band. Changes in alpha band signals under stimulus lighting conditions were calculated relative to those obtained under base lighting conditions.
The VAS assessments for subjective evaluation of con-centration, sleepiness and perception of blueness, as well as the KSS, were conducted both prior to and following the experiment, as indicated in Fig. 4. Participants were asked to report their “perceived level of blueness” after the 8-min point during the initial exposure period along a VAS with“Does not seem blue”and“Seems very blue”
at opposite ends of a 10-cm line. Participants pointed out the level of perceived blueness along the line, and the subjective results were digitised after the experiment. Changes in these parameters were also calculated rela-tive to values obtained under base lighting conditions.
One-way repeated-measures analysis of variance (ANOVA) (SPSS version 11, IBM Analytics, Illinois, United States) was used to examine the effect of lighting condition on pupillary constriction and EEG activity, as well as subjective parameters. A significance level of 0.05 was used in all comparisons.
Results
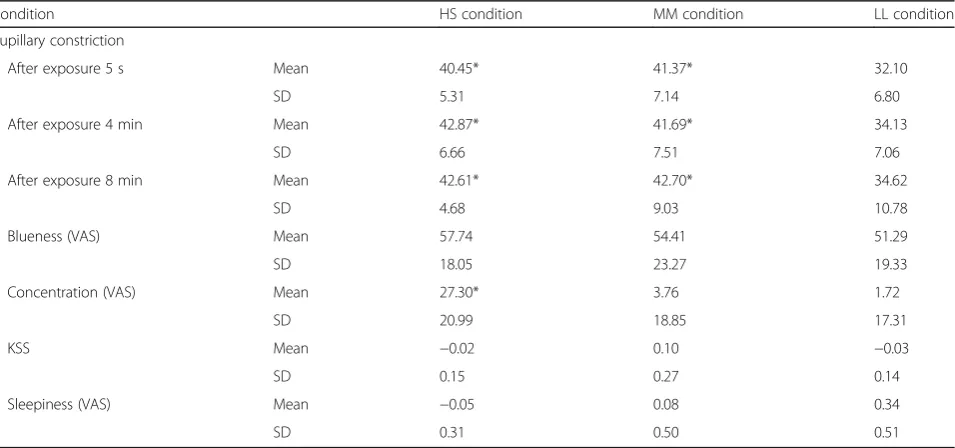
Table 2 shows the results for pupillary constriction and other subjective indices obtained during the three light conditions. Significantly greater changes were observed in pupillary constriction under both the HS (Blue 30μW/cm2; 50 μs) and MM (Blue 15μW/cm2; 100μs) conditions at the 5-s and 4- and 8-min points following initiation of the stimulus lighting condition than under the LL condition (Blue 7.5 μW/cm2; 200 μs) (p< 0.05) (Fig. 5). No significant differences were observed in pupillary constriction among the three time points under each lighting condition.
Changes in subjective concentration scores were sig-nificantly larger under the HS (Blue 30 μW/cm2; 50μs) condition than under the LL (Blue 7.5μW/cm2; 200 μs) condition (p< 0.05) (Fig. 6). No significant differences in Table 1Characteristics of each light condition
Condition HS condition MM condition LL condition Incandescent Light-emitting diode Blue light White light Blue light White light Blue light White light
Condition High intensity Short pulse width
Long pulse width
Medium intensity Medium pulse width
Medium pulse width
Low intensity Long pulse width
Short pulse width
Incandescent
Irradiance (μW/cm2) 30μW/cm2 14.75μW/cm2 15μW/cm2 14.75μW/cm2 7.5μW/cm2 14.75μW/cm2 14.48μW/
cm2
Pulse width (μs) 50μs 950μs 100μs 900μs 200μs 800μs 1000μs Peak wavelength (nm) 467 nm – 467 nm – 467 nm – – Photopic illuminance (lx) 24.00 44.00 12.23 44.00 6.00 44.00 16.00 Scotopic illuminance (lx) 351.00 53.00 176.00 53.00 88.00 53.00 20.00 Photon density
(1012 photons/cm2/s)
72.12 44.35 36.06 44.35 18.03 44.35 49.72 Photon density
(log photons/cm2/s) 13.86 13.65 13.56 13.65 13.26 13.65 13.70
Melanopsin-stimulating intensity (μW/cm2)
24.65 2.41 12.32 2.41 6.16 2.41 0.97 At retinal level products of
melanopsin-stimulating irradiance and pulse width per 1 ms (μW/cm2)
1.23 2.29 1.23 2.17 1.23 1.93 0.97
Summation of products of blue and white pulsed light per 1 ms (μW/cm2)
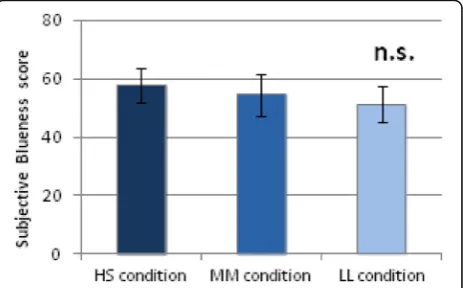
perception of blueness were observed among the three pulsed lighting conditions (Fig. 7). Further, no significant effects of light condition were observed with respect to KSS score, subjective sleepiness.
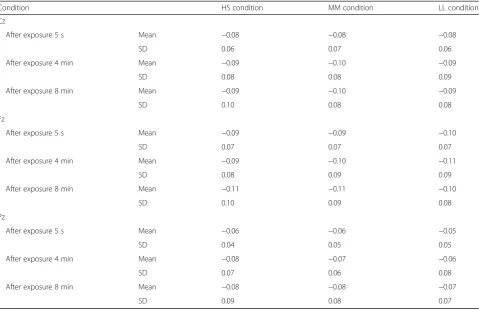
Table 3 shows the EEG alpha band ratio results ob-tained during the three light conditions at each time point. No significant differences in EEG alpha band ratio were observed in the three selected regions of the brain at any time point.
Discussion
The present study aimed to investigate whether non-visual effects of pulsed light are influenced to a greater extent by the intensity of lighting or by the quantity of lighting. Since this aim could not be attained using the results of a two-factor ANOVA that utilises intensity and quantity as independent factors, we examined the effects of different levels of intensity and quantity during three lighting conditions using a one-way
repeated-measures ANOVA, with the frequency of pulsed light held constant at 1000 Hz.
In the present study, we observed significantly different effects of varying light conditions on pupillary constriction and subjective concentration even when the quantity of pulsed blue light remained constant across conditions. However, no significant difference was observed in the subjective perception of blueness under the three pulsed stimulus lighting conditions, suggesting that differential non-visual effects of light exposure may occur even when participants perceive no differences in the colour of blue light emitted.
We also observed that, although the three pulsed blue light conditions maintained an equal product of irradi-ance and pulse width at all three time points, greater pupillary constriction was observed under the high- and medium-intensity conditions than under the low-intensity condition. Previous studies have suggested that the pupillary response to light is controlled by rods in
Table 2Pupillary constriction and subjective indices during the three light conditions
Condition HS condition MM condition LL condition Pupillary constriction
After exposure 5 s Mean 40.45* 41.37* 32.10
SD 5.31 7.14 6.80
After exposure 4 min Mean 42.87* 41.69* 34.13
SD 6.66 7.51 7.06
After exposure 8 min Mean 42.61* 42.70* 34.62
SD 4.68 9.03 10.78
Blueness (VAS) Mean 57.74 54.41 51.29
SD 18.05 23.27 19.33
Concentration (VAS) Mean 27.30* 3.76 1.72
SD 20.99 18.85 17.31
KSS Mean −0.02 0.10 −0.03
SD 0.15 0.27 0.14
Sleepiness (VAS) Mean −0.05 0.08 0.34
SD 0.31 0.50 0.51
SDstandard deviation
*p< 0.05 compared with LL condition
conditions of low irradiance but by ipRGCs under condi-tions of high irradiance [12, 31]. For example, Panda et al. [31] reported that ipRGCs contribute to the pupillary response in mice at an irradiance level greater than ap-proximately 13 log photons/cm2/s when animals are ex-posure to 470-nm light at eye level. Takahashi et al. [12] also estimated that the irradiance level at which the role of rods in pupillary constriction is replaced by ipRGCs is ap-proximately 10.4 × 10¹²photons/cm2/s when participants are exposed to eye-level 457-nm light. They further re-ported that the threshold retinal irradiance for depolarization of ipRGCs in rats is approximately 12.7 log photons/cm2/s of 500-nm light at eye level [12]. In the present study, only melanopsin-stimulating irradiance and photon density of blue pulsed light were equivalent in the HS condition (72.1 × 10¹² or 13.9 log photons/cm2/s), MM condition (36.1 × 10¹² or 13.6 log photons/cm2/s), and LL condition (18.0 × 10¹²or 13.3 log photons/cm2/s). Levels of 467 nm of pulsed blue light were high enough to result in increased pupillary constriction associated with ipRGCs rather than rods, which controls the pupillary re-sponse under conditions of low irradiance.
Perhaps most interesting is the finding that, although the difference in exposure quantity was largest at the 8-min point during the HS condition than that in the MM and LL conditions at 4-min and 5-s points, no significant differences in pupillary constriction were observed among the three time points. We therefore propose that the non-visual effects of light on pupillary constriction, which occur via stimulation of ipRGCs, are determined by ex-posure to relatively higher intensities of lighting, but not determined by exposure to relatively larger quantities of pulsed light. Do et al. reported that the density of ipRGCs in the retina is extremely low compared to that of cones and rods, resulting in a very low photon catch. However, another study has indicated that the higher and prolonged responses of ipRGCs to single photon may be responsible for these results [32], consistent with our findings.
Prolonged exposure to intense light may lead to dam-age of the retinal photoreceptors [33]. According to re-sults of the present study, reducing the pulsed width of intermittent lighting may make phototherapy safer. Con-tinued research in this field may help to generate new methods for both therapeutic and functional lighting.
Fig. 5Changes (%) in pupillary constriction under three light conditions (mean ± SE). Average changes (%) in pupillary constriction after exposure to stimulus lighting 5 s. Greater pupillary constriction was observed under the high- and medium-irradiance conditions than under the low-irradiance condition. *p< 0.05
Fig. 6Changes (%) in subjective concentration under three light conditions (mean ± SE). Changes (%) in subjective concentration under the high-irradiance condition were significantly larger than under the low-irradiance condition. *p< 0.05
Fig. 7Subjective blueness score under three lighting conditions. No significant differences (n. s.) in perception of blueness
Conclusion
In the present study, participants were exposed to three pulsed light conditions in which the frequency remained equal for varying levels of intensity and quantity of pulsed light. Significant differences were observed in non-visual effects (e.g., pupillary constric-tion and subjective concentraconstric-tion) even though partic-ipants reported no differences in their perception of the light’s blueness, suggesting that the mechanisms underlying the visual and non-visual physiological re-sponses to light are different.
Furthermore, exposure to pulsed light of higher in-tensity and shorter pulsed width resulted in signifi-cant increases in pupillary constriction after 5 s even when the quantity (product of irradiance and pulse width) of blue pulsed light was held constant. How-ever, exposure to pulsed light with larger differences in quantity after 8 min resulted in no significant in-crease in pupillary constriction relative to that at the 5-second and 4-min points when the intensity of light was constant.
The results of present study indicate that, relatively higher intensity and shorter pulsed-widths of blue light (HS condition, after 5 s) produced a more significant influence on ipRGCs and physiological
functions even when the quantity of blue pulsed light are held constant. Relatively larger differences in the quantity of white pulsed light associated with longer exposure time (HS condition, after 8 min) produced no significantly different influence on ipRGCs and physiological functions when compared with HS con-ditions at the 5-s and 4-min points. These results suggest that the intensity of pulsed light, rather than the quantity, is the main factor influencing ipRGCs and physiological functions.
With regard to more practical applications, our results indicate that it is possible for light to exert two effects at the same time. That is, the increased intensity of blue light may produce more significant physiological changes and non-visual influences on ipRGCs, while reduced quantity of pulsed light may make phototherapy safer and more en-ergy efficient.
Additional files
Additional file 1:Lighting spectral distribution data. Spectral distribution data for the blue LED, white LED, and incandescent bulbs. (XLSX 47 kb)
Additional file 2:Results data. Significant results for pupillary constriction, subjective blueness, and concentration date under the three lighting conditions. (XLSX 54 kb)
Table 3EEG alpha band ratio during the three light conditions
Condition HS condition MM condition LL condition Cz
After exposure 5 s Mean −0.08 −0.08 −0.08
SD 0.06 0.07 0.06
After exposure 4 min Mean −0.09 −0.10 −0.09
SD 0.08 0.08 0.09
After exposure 8 min Mean −0.09 −0.10 −0.09
SD 0.10 0.08 0.08
Fz
After exposure 5 s Mean −0.09 −0.09 −0.10
SD 0.07 0.07 0.07
After exposure 4 min Mean −0.09 −0.10 −0.11
SD 0.08 0.09 0.09
After exposure 8 min Mean −0.11 −0.11 −0.10
SD 0.10 0.09 0.08
Pz
After exposure 5 s Mean −0.06 −0.06 −0.05
SD 0.04 0.05 0.05
After exposure 4 min Mean −0.08 −0.07 −0.06
SD 0.07 0.06 0.08
After exposure 8 min Mean −0.08 −0.08 −0.07
SD 0.09 0.08 0.07
SDstandard deviation
Abbreviations
ANOVA:Analysis of variance; EEG: Electroencephalography;
ipRGC: Intrinsically photosensitive retinal ganglion cell; KSS: Kwansei Gakuin Sleepiness Scale; LED: Light-emitting diode; VAS: Visual Analogue Scale
Acknowledgements
We would like to thank Editage for providing professional writing services to aid in the revision of this manuscript.
Funding
This study was supported by the Grants-in-Aid from the Japan Society for the Promotion of Science KAKENHI (Grant Numbers 23370104, 15 K141617, 26291098).
Availability of data and materials
All data supporting the conclusions of this article are included within the article and its Additional files 1 and 2.
Authors’contributions
QD and TK participated in the design of the study and in the writing of the manuscript. YU performed the experiments, analysed the data and wrote the first draft of the manuscript. SL, YT and YS conceived and designed the study. QD, YU, YT, SL, YS and TK were responsible for coordination of the study and overseeing data collection and analysis. All authors have read and approved the final manuscript.
Competing interests
The authors declare that they have no competing interests.
Ethics approval and consent to participate
The present study was approved by the Bioethics Committee of the Graduate School of Engineering at Chiba University (No. 24-17). All participants provided informed consent prior to participation in the study.
Publisher’s Note
Springer Nature remains neutral with regard to jurisdictional claims in published maps and institutional affiliations.
Author details
1Graduate School of Engineering, Chiba University, 1-33 Yayoicho, Inage-ku,
Chiba 263-8522, Japan.2Center of Environment, Health, and Field Science, Chiba University, 6-2-1, Kashiwanoha, Kashia 277-0882, Japan.
Received: 11 July 2016 Accepted: 22 March 2017
References
1. Iwata T, Noguchi H. Nighttime lighting based on circadian rhythm (<feature > indoor lighting at night taking effect of light on circadian rhythm into consideration). J Illum Engng Inst Jpn. 2015;99(1):35–6. 2. Higuchi S. Non-visual effects of light and circadian rhythm: approach to
physiological polytypism. Jpn J Physiol Anthropol. 2013;18(1):39–43. 3. Higuchi S. Non-visual effects of light: adaptation to light environment
(<special issue > Lighting Research Group). Jpn J Physiol Anthropol. 2011;16(1):21–6.
4. Huang J, Shimomura Y, Katsuura T. Effects of monochromatic light on different time perception. J Human Environ Sys. 2012;15(1):21–9. 5. Noguchi H, Sakaguchi T. Effect of illuminance and color temperature on
lowering of physiological activity. Appl Human Sci. 1999;18:117–23. doi:10. 2114/jpa.18.117.
6. Yasukouchi A, Ishibashi K. Non-visual effects of the color temperature of fluorescent lamps on physiological aspects in humans. J Physiol Anthropol Appl Hum Sci. 2005;24:41–3. doi:10.2114/jpa.24.41.
7. Katsuura T, Jin X, Baba Y, Shimomura Y, Iwanaga K. Effects of color temperature of illumination on physiological functions. J Physiol Anthropol Appl Hum Sci. 2005;24:321–5. doi:10.2114/jpa.24.321.
8. Jin X, Katsuura T, Iwanaga K, Shimomura Y, Inoie M. The influence of taste stimuli and illumination on electrogastrogram measurements. J Physiol Anthropol. 2007;26:191–5. doi:10.2114/jpa2.26.191.
9. Ishibashi K, Kitamura S, Kozaki T, Yasukouchi A. Inhibition of heart rate variability during sleep in humans by 6700 K pre-sleep light exposure. J Physiol Anthropol. 2007;26:39–43. doi:10.2114/jpa2.26.39.
10. Berson D, Dunn F, Takao M. Phototransduction by retinal ganglion cells that set the circadian clock. Science. 2002;295(5557):1070–3. doi:10.1126/science. 1067262.
11. Foster RG. The‘third’photoreceptor system of the eye-photosensitive retinal ganglion cells. Eur Ophthalmic. 2009;2(1):84–6.
12. Takahashi Y, Katsuura T, Iwanaga K, Shimomura Y. Contribution of intrinsically photosensitive retinal ganglion cells on action spectrum for pupillary light reflex. J Illum Engng Inst Jpn. 2010;94:743–6. doi:10.2150/jieij.94.743. 13. Lee H, Katsuura T, Iwanaga K, Shimomura Y, Higashi H, Ichijo T. The effect of
monochromatic light exposure on human physiological responses. Jpn J Physiol Anthropol. 2008;13(2):75–83.
14. Takahashi Y. Photoreceptor caused by non-image-forming effect (<special issue > Lighting Research Group). Jpn J Physiol Anthropol. 2011;16(1):27–30. 15. Figueiro M, Bierman A, Plitnick B, Rea M. Preliminary evidence that both
blue and red light can induce alertness at night. BMC Neurosci. 2009;10:105. doi:10.1186/1471-2202-10-105.
16. Lockley S, Evans E, Scheer F, Brainard G, Czersler C, Aeschbach D. Short-wavelength sensitivity for the direct effects of light on alertness, vigilance and the waking electroencephalogram in humans. Sleep. 2006;29(2):161–8. 17. Vandewalle G, Collignon O, Hull JT, et al. Blue light stimulates cognitive
brain activity in visually blind individuals. J Cogn Neurosci. 2013;25:2072–85. 18. Lockley SW. High sensitivity of the human circadian melatonin rhythm to
resetting by short wavelength light. J Clin Endocr Metab. 2003;88(9):4502–5. 19. Warman VL. Phase advancing human circadian rhythms with short
wavelength light. Neurosci Lett. 2003;342(1–2):37–40.
20. Lall GS, Revell VL, Momiji H, et al. Distinct contributions of rod, cone, and melanopsin photoreceptors to encoding irradiance. Neuron. 2010;66:417–28. 21. Gooley JJ, Ho Mien I, St Hilaire MA, et al. Melanopsin and rod-cone
photoreceptors play different roles in mediating pupillary light responses during exposure to continuous light in humans. J Neurosci. 2012;32:14242–53. 22. Ho Mien I, Chua EC, Lau P, et al. Effects of exposure to intermittent versus
continuous red light on human circadian rhythms, melatonin suppression, and pupillary constriction. PLoS One. 2014;9:e96532.
23. Katsuura T, Ochiai Y, Senoo T, Lee S, Takahashi Y, Shimomura Y. Effects of blue pulsed light on human physiological functions and subjective evaluation. J Physiol Anthropol. 2012;31:23. doi:10.1186/1880-6805-31-23. 24. Gamlin PD, McDougal DH, Pokorny J, Smith VC, Yau KW, Dacey DM. Human
and macaque pupil responses driven by melanopsin-containing retinal ganglion cells. Vision Res. 2007;47:946–54.
25. Farnsworth D. The Farnsworth-Munsell 100-hue and dichotomous tests for color vision. J Opt Soc Am. 1943;33:568–74.
26. Takahashi Y, Katsuura T, Shimomural Y, Iwanaga K. Prediction model of light-induced melatonin suppression. J Illum Engng Inst Jpn. 2010;94:2. 27. Stockman A, Sharpe LT, Fach C. The spectral sensitivity of the human
short-wavelength sensitive cones derived from thresholds and color matches. Vision Res. 1999;39:2901–27.
28. Lamb T. Photoreceptor spectral sensitivities: common shape in the long-wavelength region. Vision Res. 1995;35:3083–91.
29. Yuka S, Hideo A, Makoto N, Kaori N, Yoshie Y, Michiko H, Yoshiyasu T, Junko M, Mihoko M, Kunio H, Tatsuya I. Effects of short-term exposure to whole-body vibration on wakefulness level. Ind Health. 2007;45:217–23. 30. Xinxin L, Koichi I, Shigeki K. Circulatory and central nervous system
responses to different types of mental stress. Ind Health. 2011;49:265–73. 31. Panda S, Provencio I, Tu DC, Pires SS, Rollag MD, Castrucci AM, Pletcher MT,
Sato TK, Wiltshire T, Andahazy M, Kay SA, Van Gelder RN, Hogenesch JB. Melanopsin is required for non-image-forming photic responses in blind mice. Science. 2003;301(5632):525–7. doi:10.1126/science.1086179. 32. Do MTH, Kang SH, Xue T, Haining Z, Hsi-Wen L, Bergles DE, Yau K-W.
Photon capture and signalling by melanopsin retinal ganglion cells. Nature. 2009;457:281–7.