R E S E A R C H
Open Access
Root-associated microbiomes of wheat
under the combined effect of plant
development and nitrogen fertilization
Shuaimin Chen
1,2, Tatoba R. Waghmode
1, Ruibo Sun
1, Eiko E. Kuramae
3, Chunsheng Hu
1*and Binbin Liu
1*Abstract
Background:Plant roots assemble microbial communities both inside the roots and in the rhizosphere, and these root-associated microbiomes play pivotal roles in plant nutrition and productivity. Although it is known that increased synthetic fertilizer input in Chinese farmlands over the past 50 years has resulted in not only increased yields but also environmental problems, we lack a comprehensive understanding of how crops under elevated nutrient input shape root-associated microbial communities, especially through adjusting the quantities and compositions of root metabolites and exudates.
Methods:The compositions of bacterial and fungal communities from the roots and rhizosphere of wheat (Triticum aestivum L.) under four levels of long-term inorganic nitrogen (N) fertilization were characterized at the tillering, jointing and ripening stages. The root-released organic carbon (ROC), organic acids in the root exudates and soil organic carbon (SOC) and soil active carbon (SAC) in the rhizosphere were quantified.
Results:ROC levels varied dramatically across wheat growth stages and correlated more with the bacterial community than with the fungal community. Rhizosphere SOC and SAC levels were elevated by long-term N fertilization but varied only slightly across growth stages. Variation in the microbial community structure across plant growth stages showed a decreasing trend with N fertilization level in the rhizosphere. In addition, more bacterial and fungal genera were significantly correlated in the jointing and ripening stages than in the tillering stage in the root samples. A number of bacterial genera that shifted in response to N fertilization, includingArthrobacter,Bacillusand
Devosia, correlated significantly with acetic acid, oxalic acid, succinic acid and tartaric acid levels.
Conclusions:Our results indicate that both plant growth status and N input drive changes in the microbial community structure in the root zone of wheat. Plant growth stage demostrated a stronger influence on bacterial than on fungal community composition. A number of bacterial genera that have been described as plant growth-promoting
rhizobacteria (PGPR) responded positively to N fertilization, and their abundance correlated significantly with the organic acid level, suggesting that the secretion of organic acids may be a strategy developed by plants to recruit beneficial microbes in the root zone to cope with high N input. These results provide novel insight into the associations among increased N input, altered carbon availability, and shifts in microbial communities in the plant roots and rhizosphere of intensive agricultural ecosystems.
Keywords:Root-associated microbiomes, Root exudate, Organic acid, Nitrogen fertilization, Plant growth stage
© The Author(s). 2019Open AccessThis article is distributed under the terms of the Creative Commons Attribution 4.0 International License (http://creativecommons.org/licenses/by/4.0/), which permits unrestricted use, distribution, and reproduction in any medium, provided you give appropriate credit to the original author(s) and the source, provide a link to the Creative Commons license, and indicate if changes were made. The Creative Commons Public Domain Dedication waiver (http://creativecommons.org/publicdomain/zero/1.0/) applies to the data made available in this article, unless otherwise stated. * Correspondence:[email protected];[email protected]
1
Key Laboratory of Agricultural Water Resources, Hebei Key Laboratory of Soil Ecology, Center for Agricultural Resources Research, Institute of Genetics and Developmental Biology, Chinese Academy of Sciences, 286 Huaizhong Road, Shijiazhuang 050021, China
Background
The plant microbiome equips the host plant with add-itional gene pools and is therefore often referred to as the second plant genome or extended genome [1–3]. Notably, plant root-associated microbiomes have attracted unprecedented attention in recent years owing to their es-sential roles in host nutrition, development and immunity [4]. A recent study showed that plant roots assemble mi-crobial communities in the root zone from surrounding soil [4]. The microbiota in these compartments can be beneficial or harmful to the host plant, and a shift in this balance might substantially affect crop production in agri-cultural ecosystems. Therefore, understanding how root-associated microbial communities respond to soil manage-ment practices and plant physiological status is of great agronomic interest.
China is the largest consumer of chemical nitrogen (N) fertilizer in the world and applies more than 30% of global fertilizers to only approximately 9% of global cropland (FAOSTAT, www.fao.org). The high rate of N loss and low use efficiency are major problems in most agricultural areas in China [5]. For instance, in the North China Plain (NCP), one of the largest crop pro-duction areas in China, nearly 300 kg N ha−1 of N fertilizer is used in one wheat growing season, account-ing for an estimated overuse of more than 30% [6]. The overuse of N fertilizer has resulted in a series of environ-mental issues, such as groundwater nitrate contamination [7], increased greenhouse gas emissions [8] and soil acid-ification [9]. In particular, it is estimated that N fertilizer-induced N2O emissions were 460 Gg N yr−1 higher in
2005 than in 1980 [8]. The available N that can be assimi-lated by plants is strongly dependent on root-associated microbial guilds [10]. However, it has not been investi-gated how root zone microbiomes respond to changes in N availability and the consequent changes in plant root exudates in areas receiving N applications as high as those in the NCP.
Carbon levels in root exudates and rhizosphere soil are important factors influencing the microbial commu-nities related to plant N uptake. For example, arbuscular mycorrhizal fungi were recently shown to be able to transfer N to plants, and this fungal symbiont-mediated N uptake was stimulated by carbon supplied from the host plant [11]. The labile organic carbon released from the plant root can stimulate or suppress the mineralization of soil organic matter, which is an im-portant aspect of plant-soil interactions in the rhizo-sphere and termed the rhizorhizo-sphere priming effect [12,
13]. Growing evidence suggests that rhizosphere priming is an important strategy by which plants retrieve organic N [10], and in forest ecosystems, the priming effect caused by elevated CO2 is tentatively driven by
in-creased rhizodeposition and enhanced microbial activity
[14]. Considering the importance of the carbon pool in the root zone with respect to the crop N recovery rate in agricultural ecosystems, an investigation of root-associated microbial communities under various levels of carbon availability caused by N fertilization is needed.
Root-associated microbiomes are dynamically affected by both the surrounding edaphic conditions and the host plant. Soil is considered a “microbial seed bank” [15] that provides plants with a large candidate pool of mi-croorganisms. As a strategy to modulate their local growth conditions, plants have the capacity to change the soil environment by secreting bioactive molecules into the rhizosphere to alter edaphic conditions for soil microbiota [16]. Thus, different plant species or geno-types can recruit specific microbiota through differences in root morphologies and root exudation patterns [17,
18]. In addition, the composition of root exudates [19] and the root-associated microbial community structure are strongly affected by the plant growth stage [20]. Var-iations in the composition of root-associated micro-biomes during plant development have been illustrated in a number of recent studies using molecular technolo-gies [20,21] and were suggested to be caused by changes in root exudation, though the compositions and quan-tities of the root exudates were not assessed in these studies.
Root exudates, which are composed of a wide spectrum of carbon-containing metabolites, such as sugars, amino acids and organic acids, represent a sig-nificant carbon cost to the host plant [22] and also act as substrates and signaling molecules for microbes, resulting in complex biogeochemical exchanges between the host plant and microbes [23,24]. As the primary low molecular weight compounds of root exudates, organic acids have been shown to act as selective agents that shape the rhizosphere microbiome structure, stimulating the growth of specific microbial populations and/or inhi-biting the development of others [25, 26]. Incubation experiments have shown that compared with carbohy-drates, organic acids tend to have a greater impact on the richness and structure of the dominant taxa in the soil microbial community [26–28]. Secretion of organic acids is an important strategy used by plants to cope with a low availability of nutrients such as phosphorous and nitrogen [29, 30]. However, the effect of elevated concentrations of nutrients due to fertilizer overuse in agricultural systems on organic acid secretion and the subsequent influence on the microbial community have not been examined.
and compositions of the root exudates and organic car-bon in the rhizosphere. The bacterial and fungal com-munities in the rhizosphere and roots were monitored using 16S and 18S rRNA gene amplicon sequencing technology. The results of this study provide in-depth information on the root exudates, rhizosphere carbon and root-associated microbial communities across differ-ent plant growth stages and N fertilization levels.
Results
Carbon in the rhizosphere and root exudates
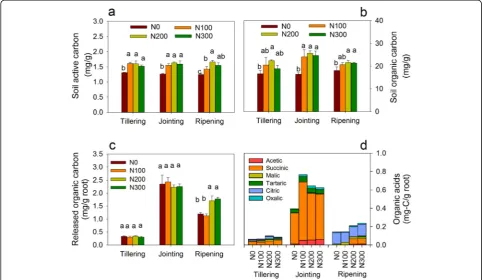
Soil active carbon (SAC), the fraction of soil carbon that fuels the soil food web, strongly affects nutrient cycles [31]. The rhizosphere SAC was significantly lower in N0 control (without N fertilization) samples than in samples that underwent N100, N200 and N300 fertilization treat-ments (100, 200 and 300 kg N ha−1per wheat-growing season, respectively) at all growth stages, though no sig-nificant differences were observed among most of the fertilized samples (Fig.1a). The levels of rhizosphere soil organic carbon (SOC) also showed a similar pattern (Fig.1b). The root-released organic carbon (ROC) deter-mined per unit weight of fresh root is shown in Fig. 1c. At the tillering and jointing stages, no significant differ-ence in ROC was observed at the four N fertilization levels. At the ripening stage, the ROC in the N200 and
N300 samples was significantly higher than that in the N0 and N100 samples. When the different growth stages were examined, the ROC level was higher in the jointing stage (2.23–2.43 mg/g root) than in the tillering (0.30– 0.34 mg/g root) and the ripening (1.08–1.77 mg/g root) stages. Notably, the reported concentrations were normalized to root weight, and the total ROC increased with increasing level of N fertilization.
In this study, eight organic acids were assayed (acetic acid, oxalic acid, pyruvic acid, fumaric acid, succinic acid, malic acid, tartaric acid and citric acid); except for pyruvic acid and fumaric acid, all were detected in the root sam-ples. The amount and composition of the organic acids differed according to growth stage (Fig.1d). At the tiller-ing stage, the sum of the organic acid concentrations was 0.06–0.10 mg C/g root with succinic acid, citric acid and malic acid dominating; these accounted for 46–62%, 17– 26% and 14–20% of the assayed organic acids, respectively. At the jointing stage, the total organic acid concentration was 0.39–0.76 mg C/g root; succinic acid dominated, ac-counting for 82–87% of the total organic acids. The sum of the organic acid concentrations was 0.14–0.23 mg C/g root at the ripening stage, at which citric acid and malic acid were dominant and accounted for 55– 92% and 7–17% of the total amount of organic acid, respectively.
Bacterial community responses to plant development and N fertilization
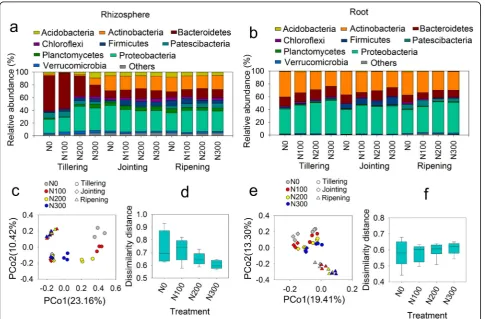
High-throughput sequencing of the rhizosphere and root samples at all three growth stages and four fertilization levels was performed. The bacterial community composi-tions in the rhizosphere and root samples under different growth stages and N fertilization levels are shown in Fig.2. Among the rhizosphere samples, the bacterial community composition was notably different among the four N fertilization levels at the tillering stage (Fig.2a). The relative abundance ofBacteroidetesdecreased, whereas that of Acti-nobacteria and Proteobacteria (Alphaproteobacteria and Gammaproteobacteria, Additional file 1: Figure S1) in-creased with N fertilization level. The bacterial community compositions among samples at the four N treatments in the jointing and ripening stages were more similar than those in the tillering stage. In the root samples, Proteobac-teria,ActinobacteriaandBacteroideteswere the three dom-inant phyla (Fig. 2b). The relative abundance of Actinobacteria decreased with increasing N fertilization level, while that of Firmicutes was dramatically higher in the jointing stage than in the other two stages.
Principal coordinate analysis (PCoA) was performed at the operational taxonomic unit (OTU) level. The OTUs from both the rhizosphere (Fig.2c) and the root samples (Fig. 2e) were clearly separated by plant growth stage, whereas the effect of N fertilization was observed only at the tillering stage in the rhizosphere. The dissimilarity distances among the three growth stages were calculated at each N fertilization level, and the differences in micro-bial community structure across the growth stages showed a decreasing trend with increasing N fertilization level in the rhizosphere (Fig. 2d). Redun-dancy analysis (RDA) based on microbial community structure at the OTU level showed that ROC corre-lated significantly with the bacterial community and accounted for 19.0% and 12.7% of the variation in the rhizosphere and root samples, respectively (Table 1). Mantel test results also revealed a significant correlation between ROC and bacterial community (Table2).
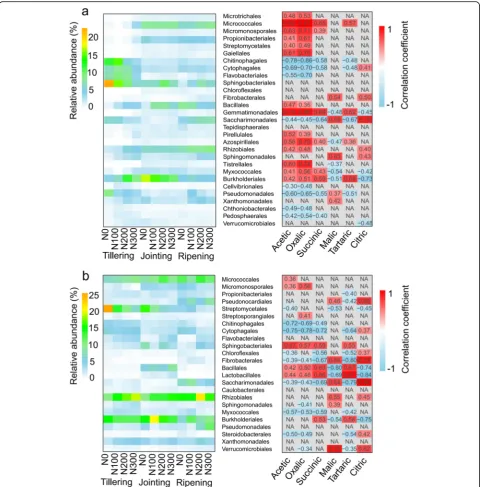
Heatmaps illustrating differences in the compositions of the microbial communities among the three growth stages and at the four fertilization levels were generated for the bacterial communities at both the order (Fig. 3a,
b, Additional file2) and genus (Additional file1: Figures S2 and S3, Additional file 3) taxonomic levels. At the order level, the relative abundances of Micrococcales, Propionibacteriales,Gaiellales,BacillalesandRhizobiales in the rhizosphere samples were significantly higher (paired t-test) at the jointing and ripening stages than at the tillering stage (Fig.3a). In the root samples, the rela-tive abundances of Bacillales, Lactobacillales and Bur-kholderiales were significantly greater in the jointing stage than in the other two stages. The relative abun-dances of Rhizobiales and Sphingomonadales at the til-lering stage correlated positively with N fertilization levels, whereas that ofStreptomycetales in the root sam-ples showed the opposite trend across all growth stages (Fig. 3b). At the genus level (Additional file 1: Figure S2), the relative abundances of Arthrobacter, Promi-cromonospora, Nocardioides, Streptomyces, Bacillus, and Devosia in the rhizosphere samples were signifi-cantly higher at the jointing and ripening stages than at the tillering stage. In the root samples (Additional file 1: Figure S3), the relative abundances of Micro-bacterium, Arthrobacter, Sphingomonas, and Devosia correlated positively with the N fertilization level,
though Streptomyces correlated negatively with the N fertilization level at each growth stage. In addition, the relative abundances of Bacillus, Oceanobacillus and Lactococcus were significantly higher in the joint-ing stage than in the other growth stages.
The Mantel test showed that the six organic acids cor-related significantly with the root bacterial community (Table 2). To obtain an in-depth understanding of bac-terial community responses to organic acids, further cor-relation analyses were performed between these six organic acids and bacterial orders (Fig.3a, b) and genera (Additional file1: Figures S2 and S3). Acetic acid, oxalic acid, succinic acid, and tartaric acid correlated positively with Micrococcales, Gemmatimonadales, Azospirillales and Burkholderiales in the rhizosphere samples and Sphingobacteriales, Bacillales, and Lactobacillales in the root samples and negatively withChitinophagales, Cyto-phagales, Saccharimonadales and Pseudomonadales in the rhizosphere samples and Cytophagales, Fibrobacter-ales, Saccharimonadales and Myxococcales in the root samples (Fig.3a, b). At the genus level, acetic acid, oxalic acid, succinic acid, and tartaric acid correlated positively with Arthrobacter, Devosia, Massilia in the rhizosphere samples and Arthrobacter, Micromonospora, Nonomur-aea, Pedobacter, Bacillus, Oceanobacillus, Lactococcus, Massiliaand Stenotrophomonasin the root samples and negatively with Chitinophaga, Niastella, Taibaiella, Ohtaekwangia, Mucilaginibacter, andAcidibacter in the rhizosphere samples andNiastellaand Ohtaekwangiain the root samples (Additional file1: Figures S2 and S3). Fungal community responses to plant development and N fertilization
The fungal community compositions at the phylum level in the rhizosphere and root samples are shown in Fig.4a Table 1Bacterial and fungal community variance explained by
various carbon pools according to redundancy analysis (RDA) Carbon
pool
Explained variance
Bacteria Fungi
Rhizosphere Root Rhizosphere Root
ROC 19.0%*** 12.7%*** -
-SAC - 7.3%* 12.6%* 11.3%*
SOC - 7.7%* 14.8%*
-Significance level:P< 0.05, *;P< 0.01, **;P< 0.001, ***. ROC: root-released organic carbon; SAC: soil active carbon; SOC: soil organic carbon. The analysis was performed at the OTU level
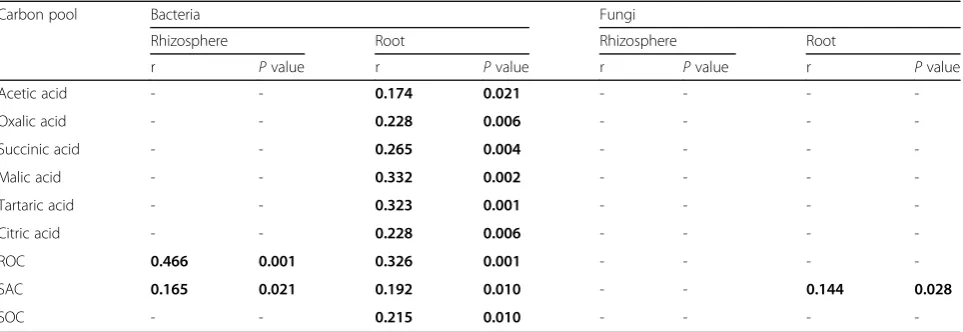
Table 2Correlations between bacterial and fungal communities and root organic acids and carbon pools in the rhizosphere and roots
Carbon pool Bacteria Fungi
Rhizosphere Root Rhizosphere Root
r Pvalue r Pvalue r Pvalue r Pvalue
Acetic acid - - 0.174 0.021 - - -
-Oxalic acid - - 0.228 0.006 - - -
-Succinic acid - - 0.265 0.004 - - -
-Malic acid - - 0.332 0.002 - - -
-Tartaric acid - - 0.323 0.001 - - -
-Citric acid - - 0.228 0.006 - - -
-ROC 0.466 0.001 0.326 0.001 - - -
-SAC 0.165 0.021 0.192 0.010 - - 0.144 0.028
SOC - - 0.215 0.010 - - -
and b, respectively. Ascomycota was the dominant phylum (> 75%) in both the rhizosphere and root sam-ples. In the rhizosphere samples, the relative abundance ofChytridiomycotawas higher at the jointing stage than at the tillering stage, and that of Zygomycotawas higher at the jointing and ripening stages (Fig.4a). The domin-ant fungal orders (relative abundance > 1%) were Capno-diales (5–17%), Pleosporales (5–31%) and Hypocreales (13–30%) in the rhizosphere samples and Capnodiales
(6–23%), Pleosporales (5–30%) and Hypocreales (20– 62%) in the root samples (Additional file 1: Figure S4, Additional file 4). The identified fungal orders did not show a clear response pattern to N fertilization or plant development stages, except for Calosphaeriales, Hypo-crealesand Sordariales, which generally correlated posi-tively with the N fertilization level in the rhizosphere; the relative abundance of Pleosporales in the root sam-ples increased with plant growth. The community
composition at the genus level showed thatFusariumwas the dominant genus (Additional file 1: Figure S5, Add-itional file 5), accounting for 9–23% and 16–47% of the relative abundance in the rhizosphere and root samples, respectively. In contrast to the PCoA for bacterial commu-nities, the PCoA for fungal communities based on the relative abundance of OTUs did not show a clear separ-ation of the samples across growth stages in the rhizo-sphere and root samples (Fig. 4c and e). Nonetheless, in agreement with the observations on bacterial communi-ties, a decreasing trend of the dissimilarity distance across the growth stages with increasing N fertilization was ob-served in the rhizosphere samples (Fig. 4d). The RDA showed that the SAC and SOC accounted for 12.6 and 14.8% of the variation in the rhizosphere fungal commu-nity, respectively, which were dramatically higher than that explained by ROC (Table1), suggesting that the fun-gal community was strongly affected by carbon from the rhizosphere. The Mantel test showed significant correla-tions between the SAC and fungal community in the root samples (Table2).
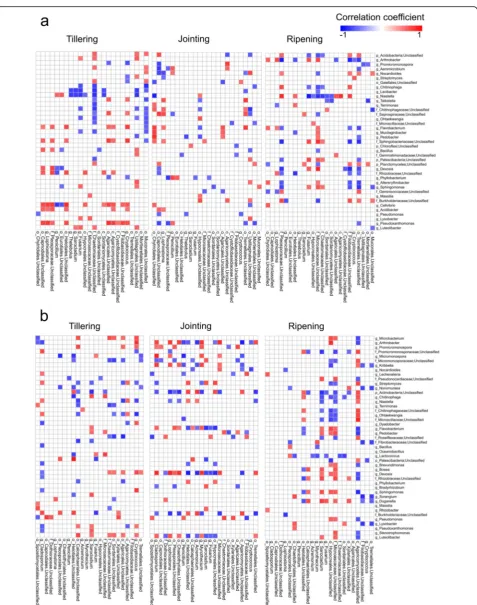
Correlations between bacteria and fungi
Correlations between bacteria and fungi in the rhizo-sphere and root samples were assessed at the three growth
stages. Genera with a relative abundance greater than 1% were used for this analysis, with 39 bacterial and 24 fungal genera in the rhizosphere samples and 45 bacterial and 24 fungal genera in the root samples. Among the bacteria and fungi in the rhizosphere samples (Table3and Fig.5a), 123, 82 and 100 significant correlations (p< 0.05) were found at the tillering, jointing and ripening stages, respect-ively.Cellvibrio,Niastella, andPseudoxanthomonasat the tillering stage andNiastellaandArthrobacterat the ripen-ing stage correlated significantly with more than nine fun-gal genera. Among the bacteria and fungi in the root samples, 106 significant correlations were found at the til-lering stage, which increased to 128 at the jointing stage and 130 at the ripening stage (Table 3). At the jointing stage, Devosia, Arthrobacter and Luteolibacter corre-lated significantly with more than nine fungal genera (Fig.5b).
Discussion
Nitrogen fertilizer application is one of the most crucial agricultural practices and has contributed to the increase in global crop production in the last half century [32]. Previous studies have demonstrated that excessive N fertilization above a certain threshold value does not promote further crop productivity but can lead to large
N losses and cause a series of environmental problems [6, 33]. The overuse of N fertilizer is currently one of the major issues in agricultural production in China [34], particularly in intensive agricultural areas such as the North China Plain (NCP), where increasing the N use efficiency and reducing the level of N fertilization re-main challenging [6]. Due to the essential function of bacteria and fungi in nitrogen turnover in the root zone, a comprehensive study of the responses of root-associated microbiomes to N fertilization is necessary, especially in association with root exudation, which has been shown to be critical for plant N uptake [14].
In our study, the quantities of the soil active carbon (SAC) and soil organic carbon (SOC) in the rhizosphere under different N fertilization treatments (N100, N200 and N300) significantly increased compared with those of the control (N0). These changes can be tentatively at-tributed to the long-term effect of N fertilization, which increased the root biomass as well as the total amount of root exudates. In addition, because the crop resi-due was returned to the soil, the increased biomass of the aboveground crops due to N fertilization also con-tributed to the increased SAC and SOC levels in the long term. The rhizosphere SAC and SOC did not fluc-tuate with plant growth stages as did the root-released organic carbon (ROC) (Fig.1), suggesting that the differ-ences in SOC and SAC among different fertilization levels are mainly generated by cumulative changes in root exudates and crop residue return over the 20 years of cultivation.
The bacterial community structures in the rhizosphere were clearly separated by the level of N fertilization at the tillering stage but clustered together at the jointing and ripening stages (Fig. 2c). Since the ROC level was significantly higher in the jointing and ripening stages than in the tillering stage and both redundancy analysis (RDA) and the Mantel test suggested that the bacterial community is strongly related to ROC, the increased
similarity among microbial communities across N fertilization levels might have been because the influence of root exudates overrode the effect of N availability in the rhizosphere.
Plant growth-promoting rhizobacteria (PGPR) are in close contact with roots and can enhance the adaptive capacity of host plants in their environments [35]. In this study, the relative abundances of Arthrobacter, Bacillus, Massilia and Devosia in the rhizosphere and Bacillus, Oceanobacillus, Lactococcus and Massilia in the roots were higher at the jointing and ripening stages than at the tillering stage (Fig. 3a), and these genera have been described as important PGPR [36–39]. Furthermore, Pearson correlation analysis showed that these taxa cor-related positively with one or several organic acids (Fig. 3b). Interestingly,Arthrobacter, Bacillus, and Devo-sia also correlated positively with the level of N input. One possible explanation for these results is that the plants responded to the elevated N input by recruiting PGPR through secretion of organic acids. Indeed, re-cruitment of PGPR by root-secreted organic acids has been illustrated in a number of prior studies [40–42].
The composition and quantity of organic acids also changed across N fertilization levels at all three growth stages. A straightforward explanation is that the elevated N changed the physiological status of the plants. An-other possible explanation for this phenomenon is that surplus N input caused the depletion of other nutrients in the soil, such as phosphate. Adjusting the quantity and composition of root exudate is a strategy developed by plants to cope with limited nutrients. In support of this notion, secretion of organic acids has been identified as an efficient way by which phosphate is released from inorganic complexes in soil [29,43].
Fungal communities in the rhizosphere are affected by plant growth stage, soil characteristics and plant species [21,44,45]. A recent study also showed that priming ef-fects caused by litter application may enhance Table 3Number of correlations between bacterial and fungal genera in the rhizosphere and root samples
Correlation coefficient Number of correlations
Rhizosphere Root
Tillering Jointing Ripening Tillering Jointing Ripening
r≥0.57 (P<0.05)
Positive 72 41 47 52 61 59
Negative 51 41 53 54 67 71
Sum 123 82 100 106 128 130
r≥0.65 (P<0.05)
Positive 27 20 21 27 45 36
Negative 39 16 30 32 41 42
Sum 66 36 51 59 86 78
r≥0.75 (P<0.05)
Positive 12 7 14 7 17 7
Negative 14 4 5 11 18 12
rhizosphere activity by promoting fungal growth [46]. However, in this study, the growth stage had no signifi-cant effects on the fungal community structure (Fig.4). In addition, RDA suggested a substantial influence of SAC on the fungal community structure in both the rhizosphere and root samples (Table 1). A recent study showed that plant endosphere fungi are a subset of fungi recruited from the surrounding soil [47], therefore, it is not surprising to find that both root and rhizo-sphere fungi are closely related to the edaphic factors of the surrounding soil.
Conclusions
Both plant development and long-term N fertilization strongly influence the structure of root-associated microbiomes. In both root-associated compartments, the bacterial community composition was closely related to ROC, whereas the fungal community was associated with the rhizosphere SAC. Plant growth stage showed different effects on the correlation between bacter-ial and fungal communities in the root and rhizo-sphere samples. A number of PGPR were found to be correlated with organic acids and the N fertilization level, suggesting that the secretion of organic acids to re-cruit beneficial microorganisms might be an important strategy used by plants to cope with nitrogen input. This study represents a step toward a more mechanistic un-derstanding of how shifts in microbial community com-position mediate and reflect the effects of nitrogen input in intensive agricultural ecosystems.
Methods
Field experiment and sample collection
A long-term N fertilization field experiment was initiated in 1998 at the Luancheng Agroecosystem Experimental Station in Luancheng County, Hebei Province, China (37°53′N, 114°41′E, elevation 50 m). The experiment in-cluded four N fertilization levels, 0, 100, 200 and 300 kg N ha−1per wheat-growing season, applied to triplicate plots. The soil used in this study was fluvo-aquic soil with a pH of 7.53–7.95, a total carbon (TC) of 17.03–20.80 g kg−1 and a total nitrogen (TN) of 1.13–1.70 g kg−1[48]. Rhizo-sphere and root samples were collected three times during the wheat growing season in November 2016 (Feekes growth stage 2-3), March 2017 (Feekes stage 6-7) and May 2017 (Feekes stage 11), which are referred to as tiller-ing, jointing and ripening stages in this study, respectively. Three replicate samples of root cores were collected from plants under all N fertilization levels at each growth stage. The rhizosphere samples in this study were strictly de-fined as the soil within 2 mm of the root surface [49]. After gently shaking the roots to remove loosely attached soil clumps, the rhizosphere samples were carefully col-lected by brushing the remaining soil off of the roots [50].
To decrease the impact on arbuscular mycorrhizal fungi attached to the roots and downstream DNA extraction, the roots were washed with sterilized distilled water and used for root exudate and root microbial community ana-lyses. We therefore define the “root microbiome” in this study as the microbial communities in the root endo-sphere and root surface since the sample collection method did not discriminate between these two compart-ments [16].
Determination of SAC, SOC, ROC and organic acids Because only rhizosphere and root samples were investi-gated, soil organic carbon (SOC) and soil active carbon (SAC) in this study refer to the rhizosphere SOC and SAC. SOC is defined in the conventional way and refers to the carbon component of organic compounds in the soil. Root-released organic carbon (ROC) is defined in this study as the total carbon in the root exudate (nor-malized per gram of root). SAC was determined using the potassium permanganate (KMnO4) oxidizable C
method [31,51]. Briefly, 1.0 g of air-dried soil was mixed with 20 ml of KMnO4 at a concentration of 0.02 M and
shaken at 200 rpm for 2 min at 25 °C. Next, the sample was centrifuged at 950×g for 5 min, and the supernatant was diluted with deionized water at a ratio of 1:50. The absorbance of the diluted sample at 550 nm was mea-sured using an ultraviolet spectrophotometer (UV-2450, Shimadzu). The range of the standards was chosen to adequately cover the concentration of the samples. The change in the concentration of KMnO4was used to
esti-mate the amount of oxidized carbon, assuming that 1 mM MnO4− is consumed (Mn (VII) to Mn (II)) during
the oxidation of 0.75 mM or 9 mg of carbon. SOC was measured using the K2Cr2O7-H2SO4 oxidation
method [52].
Root exudates were extracted by shaking 0.4 g of fresh roots with 1.5 ml of sterilized deionized water for 30 min at 1400 rpm [26,53]. The samples were subsequently cen-trifuged for 5 min at 13,000×g,and the supernatants were filtered through a 0.22μm syringe filter. Next, 0.5 ml of the filtered supernatants was assessed using a total organic carbon analyzer for ROC determination. Organic acids were measured using a high-performance liquid chro-matograph (Waters e2695, Milford, MA, USA) equipped with a reversed-phase silica C18 column (Atlantis T3, 250 × 4.6 mm, 5μm, Waters); 10μl of root exudate sample was eluted with 20 mM sodium phosphate buffer (pH 2.73) at a flow rate of 0.5 ml min−1at 30 °C. Absorbance at 210 nm was monitored, and calibration curves were constructed with standard organic acids.
DNA extraction and amplicon sequencing
obtained by grinding with liquid nitrogen using an E.Z.N.A.® Soil DNA Kit (Omega Biotek, Inc., Norcross, GA) following the manufacturer’s protocol. The 16S and 18S rRNA genes were amplified with the primer pairs 341F:785R [54] and FR1:FF390 [55], respectively. The primers contained overhanging bases to connect the Illumina sequencing adapters and dual-index barcodes in a second round of PCR. PCR was performed in a 25μl mixture containing 12.5μl of PCR premix (Phanta Max Super-Fidelity DNA Polymerase, Vazyme Biotech Co., Ltd., China), 1μl of each primer (10μM), and 1μl of DNA template (approximately 20 ng of DNA). The PCR conditions were as follows: 95 °C for 3 min; 25 cy-cles of 30 s at 95 °C, 30 s at 55 °C and 30 s at 72 °C; and a final extension at 72 °C for 10 min. The PCR products were examined by agarose gel electrophoresis and then purified using AMPure XP beads (Beckman Coulter, Inc., Brea, CA) following the manufacturer’s protocol. Subse-quent eight-cycle PCR was carried out to add dual-index barcodes and Illumina sequencing adapters to each sam-ple, after which the PCR products were purified using AMPure beads. Equal molar amounts of the PCR products from each sample were mixed and sequenced using the Illumina MiSeq PE300 platform (GENEWIZ, Suzhou, China). The sequencing data were deposited in the Euro-pean Nucleotide Archive under accession number PRJEB33393.
Analysis of sequencing data
Sequences were analyzed using the Quantitative Insights Into Microbial Ecology (QIIME) pipeline [56]. The adaptor sequence, barcode and 30 low-quality bases at the end of each read were removed, after which forward and reverse reads were joined using the fastq-join method with a mini-mum overlap of 20 bp and a maximini-mum mismatch within the overlap region of 10%. Low-quality sequences (Phred quality score Q < 20 or a length shorter than 200 bp) were discarded, and chimeras were filtered out using the UCHIME algorithm in the USEARCH program [57]. The high-quality data were clustered into operational taxonomic units (OTUs) at a 97% similarity using the UCLUST method [58]. The SILVA 16S and 18S rRNA databases were used as bacterial and fungal reference databases, re-spectively. The high-quality sequences were analyzed after removing singletons and OTUs assigned as neither bacteria nor fungi.
After completing the quality control steps, 9003–33,523 and 5811–27,012 bacterial sequences per sample were ob-tained from the rhizosphere and root samples, respectively. Bacterial OTU tables for the rhizosphere and root samples were subsampled to 8500 and 5500 sequences per sample, respectively. The subsampled sequences were clustered into 1002–3256 OTUs (2588 on average) for the rhizosphere samples and 817–2031 OTUs (1573 on average) for the
root samples. For 18S rRNA gene sequences, 4777–29,260 and 1492–5413 high-quality sequences per sample were generated from the rhizosphere and root samples, respect-ively, after quality control. The fungal libraries for the rhizosphere and root samples were subsampled to 4000 and 1000 sequences per sample, respectively. The subsam-pled sequences were clustered into 704–1084 OTUs (895 on average) for the rhizosphere samples and 192–301 OTUs (263 on average) for the root samples. Preliminary analysis of similarities (ANOSIM) based on pooled se-quences revealed significant differences (P< 0.001) between the rhizosphere and root samples for both the bacterial and fungal communities; therefore, sequence analyses on the rhizosphere and root samples were performed separately.
Statistical analyses
Statistical analyses were conducted using SPSS20.0 (IBM, Chicago, USA) and R [59]. Analysis of variance and least significant difference (LSD) analysis were performed to test the significance of the effect of N fertilization level on SOC, SAC and root exudates using SPSS 20.0. Redun-dancy analysis and the Mantel test were performed using the vegan library in R [60] to determine correlations be-tween carbon pools and microbial communities at the OTU level. Pearson correlation analysis between organic acids and bacterial taxa and between bacterial and fungal taxa was performed using the psych library in R [61]. ANOSIM [62] analysis using the Bray-Curtis dissimilarity matrix was performed to determine significant differences in the bacterial and fungal communities between the rhizosphere and root samples.
Supplementary information
Supplementary informationaccompanies this paper athttps://doi.org/10. 1186/s40168-019-0750-2.
Additional file 1: Figure S1.The relative abundance of the classes within the phylum Proteobacteria in the rhizosphere and root samples under different N fertilization levels at three growth stages.Figure S2. Heatmap showing the relative abundance of dominant rhizosphere bacterial genera (left) and Pearson correlation analysis between dominant bacterial genera and organic acids (right). NA indicates no significant correlations (P> 0.05). Unclassified indicates an unidentified genus in the preceding taxa.Figure S3.Heatmap showing the relative abundance of dominant bacterial genera in the root samples (left) and Pearson correlation analysis between dominant bacteria genera and organic acids (right). NA indicates no significant correlations (P> 0.05). Unclassified indicates an unidentified genus in the preceding taxa. Figure S4.Heatmap showing the relative abundance of dominant fungal orders in the rhizosphere and root samples under four fertilization levels at three growth stages.Figure S5.Heatmap showing the relative abundance of dominant fungal genera in the rhizosphere and root samples under four fertilization levels at three growth stages. Unclassified indicates an unidentified genus in the preceding taxa.
Additional file 2.Dominant bacterial genera (relative abundance > 1%) in the rhizosphere and root samples.
Additional file 4.Dominant fungal orders (relative abundance > 1%) in the rhizosphere and root samples.
Additional file 5.Dominant fungal genera (relative abundance > 1%) in the rhizosphere and root samples.
Abbreviations
PCoA:Principal coordinate analysis; PGPR: Plant growth-promoting rhizobac-teria; RDA: Redundancy analysis; ROC: Root-released organic carbon; SAC: Soil active carbon; SOC: Soil organic carbon; TC: Total carbon; TN: Total nitrogen
Acknowledgments
The authors thank the staff at the experimental station for managing the fields and Yingping Tian, Xiaogai Wang, Wenyan Li, Linqi Zhang and Mengshuai Liu for their assistance in sampling.
Authors’contributions
SC, RS, CH and BL designed the experiments. SC and TRW performed the laboratory measurements. SC, RS and EEK analyzed the data and created the graphs. SC, BL and EEK wrote the paper. CH set up and managed the field experiments. All authors discussed the results, read, and approved the final version of the manuscript.
Funding
The authors gratefully acknowledge the financial support provided by the National Key Research & Development Program of China (2017YFD0200100), the National Natural Science Foundation of China (41530859, 31861133018) and The Netherlands Organization for Scientific Research (729.004.016). This is publication number 6820 of the Netherlands Institute of Ecology (NIOO-KNAW).
Availability of data and materials
All sequencing data used in this study are available in the European Nucleotide Archive under accession number PRJEB33393.
Ethics approval and consent to participate Not applicable.
Consent for publication Not applicable.
Competing interests
The authors declare that there are no competing interests.
Author details
1Key Laboratory of Agricultural Water Resources, Hebei Key Laboratory of Soil
Ecology, Center for Agricultural Resources Research, Institute of Genetics and Developmental Biology, Chinese Academy of Sciences, 286 Huaizhong Road, Shijiazhuang 050021, China.2University of Chinese Academy of Sciences, Beijing 100039, China.3Department of Microbial Ecology, Netherlands Institute of Ecology (NIOO-KNAW), 6708 Wageningen, PB, Netherlands.
Received: 2 December 2018 Accepted: 13 September 2019
References
1. Berendsen RL, Pieterse CMJ, Bakker PAHM. The rhizosphere microbiome and plant health. Trends Plant Sci. 2012;17(8):478–86.
2. Rout ME, Southworth D. The root microbiome influences scales from molecules to ecosystems: the unseen majority. Am J Bot. 2013;100(9):1689–91. 3. Vandenkoornhuyse P, Quaiser A, Duhamel M, Van AL, Dufresne A. The
importance of the microbiome of the plant holobiont. New Phytol. 2015; 206(4):1196–206.
4. Fitzpatrick CR, Copeland J, Wang PW, Guttman DS, Kotanen PM, Johnson MTJ. Assembly and ecological function of the root microbiome across angiosperm plant species. Proc Natl Acad Sci U S A. 2018;115(6):E1157–65. 5. Wu YY, Xi XC, Tang X, Luo DM, Gu BJ, Lam SK, Vitousek PM, Chen DL. Policy
distortions, farm size, and the overuse of agricultural chemicals in China. Proc Natl Acad Sci U S A. 2018;115(27):7010–5.
6. Ju XT, Xing GX, Chen XP, Zhang SL, Zhang LJ, Liu XJ, Cui ZL, Yin B, Christie P, Zhu ZL, et al. Reducing environmental risk by improving N management
in intensive Chinese agricultural systems. Proc Natl Acad Sci U S A. 2009; 106(19):3041–6.
7. Chen SM, Wang FH, Zhang YM, Qin SP, Wei SC, Wang SQ, Hu CS, Liu BB. Organic carbon availability limiting microbial denitrification in the deep vadose zone. Environ Microbiol. 2018;20(3):980–92.
8. Liu X, Zhang F. Nitrogen fertilizer induced greenhouse gas emissions in China. Curr Opin Environ Sustain. 2011;3(5):407–13.
9. Guo JH, Liu XJ, Zhang Y, Shen JL, Han WX, Zhang WF, Christie P, Goulding KW, Vitousek PM, Zhang FS. Significant acidification in major Chinese croplands. Science. 2010;327(5968):1008–10.
10. Moreau D, Bardgett RD, Finlay RD, Jones DL, Philippot L. A plant perspective on nitrogen cycling in the rhizosphere. Funct Ecol. 2019;33(4):540–52. 11. Fellbaum CR, Gachomo EW, Beesetty Y, Choudhari S, Strahan GD, Pfeffer PE,
Kiers ET, Bücking H. Carbon availability triggers fungal nitrogen uptake and transport in arbuscular mycorrhizal symbiosis. Proc Natl Acad Sci. 2012; 109(7):2666.
12. Cheng W. Rhizosphere priming effect: its functional relationships with microbial turnover, evapotranspiration, and C–N budgets. Soil Biol Biochem. 2009;41(9):1795–801.
13. Cheng W, Parton WJ, Gonzalez-Meler MA, Phillips R, Asao S, McNickle GG, Brzostek E, Jastrow JD. Synthesis and modeling perspectives of rhizosphere priming. New Phytol. 2014;201(1):31–44.
14. Phillips RP, Finzi AC, Bernhardt ES. Enhanced root exudation induces microbial feedbacks to N cycling in a pine forest under long-term CO2 fumigation. Ecol Lett. 2011;14(2):187–94.
15. Lennon JT, Jones SE. Microbial seed banks: the ecological and evolutionary implications of dormancy. Nat Rev Microbiol. 2011;9(2):119–30.
16. Hu LF, Robert CAM, Cadot S, Zhang X, Ye M, Li BB, Manzo D, Chervet N, Steinger T, van der Heijden MGA, et al. Root exudate metabolites drive plant-soil feedbacks on growth and defense by shaping the rhizosphere microbiota. Nat Commun. 2018;9:2738.
17. Haichar FE, Marol C, Berge O, Rangel-Castro JI, Prosser JI, Balesdent J, Heulin T, Achouak W. Plant host habitat and root exudates shape soil bacterial community structure. ISME J. 2008;2(12):1221–30.
18. Philippot L, Raaijmakers JM, Lemanceau P, van der Putten WH. Going back to the roots: the microbial ecology of the rhizosphere. Nat Rev Microbiol. 2013;11(11):789–99.
19. Gransee A, Wittenmayer L. Qualitative and quantitative analysis of water-soluble root exudates in relation to plant species and development. J Plant Nutr Soil Sci. 2000;163(4):381–5.
20. Schlemper TR, Leite MFA, Lucheta AR, Shimels M, Bouwmeester HJ, van Veen JA, Kuramae EE. Rhizobacterial community structure differences among sorghum cultivars in different growth stages and soils. FEMS Microbiol Ecol. 2017;93(8):1–11.
21. Houlden A, Timms-Wilson TM, Day MJ, Bailey MJ. Influence of plant developmental stage on microbial community structure and activity in the rhizosphere of three field crops. FEMS Microbiol Ecol. 2008;65(2):193–201. 22. Marschner H. Mineral Nutrition of Higher Plants. In: Marschner H, editor. Mineral
Nutrition of Higher Plants. 2nd ed. London: Academic Press; 1995. p. 681–861. 23. Badri DV, Vivanco JM. Regulation and function of root exudates. Plant Cell
Environ. 2009;32(6):666–81.
24. Bais HP, Weir TL, Perry LG, Gilroy S, Vivanco JM. The role of root exudates in rhizosphere interactions with plants and other organisms. Annu Rev Plant Biol. 2006;57:233–66.
25. Jones DL. Organic acids in the rhizosphere - a critical review. Plant Soil. 1998;205(1):25–44.
26. Weisskopf L, Le Bayon R-C, Kohler F, Page V, Jossi M, Gobat J-M, Martinoia E, Aragno M. Spatio-temporal dynamics of bacterial communities associated with two plant species differing in organic acid secretion: a one-year microcosm study on lupin and wheat. Soil Biol Biochem. 2008;40(7): 1772–80.
27. Eilers KG, Lauber CL, Knight R, Fierer N. Shifts in bacterial community structure associated with inputs of low molecular weight carbon compounds to soil. Soil Biol Biochem. 2010;42(6):896–903.
28. Shi SJ, Richardson AE, O'Callaghan M, DeAngelis KM, Jones EE, Stewart A, Firestone MK, Condron LM. Effects of selected root exudate components on soil bacterial communities. FEMS Microbiol Ecol. 2011;77(3):600–10. 29. Raghothama KG, Karthikeyan AS. Phosphate acquisition. Plant Soil. 2005;
274(1–2):37–49.
as affected by nitrogen, phosphorus, potassium, and iron deficiency. J Plant Nutr Soil Sci. 2011;174(1):3–11.
31. Weil R, Islam R, Stine MA, Gruver JB, Samson-Liebig SE. Estimating active carbon for soil quality assessment: a simplified method for laboratory and field use. Am J Altern Agric. 2003;18:3–17.
32. Lassaletta L, Billen G, Grizzetti B, Anglade J, Garnier J. 50 year trends in nitrogen use efficiency of world cropping systems: the relationship between yield and nitrogen input to cropland. Environ Res Lett. 2014;9(10):105011. 33. Qin SP, Wang YY, Hu CS, Oenema O, Li XX, Zhang YM, Dong WX.
Yield-scaled N2O emissions in a winter wheat summer corn double-cropping
system. Atmos Environ. 2012;55:240–4.
34. Ha N, Feike T, Back H, Xiao H, Bahrs E. The effect of simple nitrogen fertilizer recommendation strategies on product carbon footprint and gross margin of wheat and maize production in the North China plain. J Environ Manag. 2015;163:146–54.
35. Bulgarelli D, Schlaeppi K, Spaepen S. Ver Loren van Themaat E, Schulze-Lefert P: structure and functions of the bacterial microbiota of plants. Annu Rev Plant Biol. 2013;64:807–38.
36. Upadhyay SK, Singh JS, Saxena AK, Singh DP. Impact of PGPR inoculation on growth and antioxidant status of wheat under saline conditions. Plant Biol. 2012;14(4):605–11.
37. Vejan P, Abdullah R, Khadiran T, Ismail S, Nasrulhaq Boyce A. Role of plant growth promoting Rhizobacteria in agricultural sustainability-a review. Molecules. 2016;21(5):573.
38. Ofek M, Hadar Y, Minz D. Ecology of root colonizing Massilia (Oxalobacteraceae). PLoS One. 2012;7(7):e40117.
39. Pontes AP, Rd S, Granada CE, LMP P. Screening of plant growth promoting bacteria associated with barley plants (Hordeum vulgareL.) cultivated in South Brazil. Biota Neotropica. 2015;15(2):e20140105.
40. Kamilova F, Kravchenko LV, Shaposhnikov AI, Azarova T, Makarova N, Lugtenberg B. Organic acids, sugars, and L-tryptophane in exudates of vegetables growing on stonewool and their effects on activities of rhizosphere bacteria. Mol Plant Microbe In. 2006;19(3):250–6. 41. Rudrappa T, Czymmek KJ, Pare PW, Bais HP. Root-secreted malic acid
recruits beneficial soil Bacteria. Plant Physiol. 2008;148(3):1547–56. 42. Ling N, Raza W, Ma JH, Huang QW, Shen QR. Identification and role of
organic acids in watermelon root exudates for recruiting Paenibacillus polymyxa SQR-21 in the rhizosphere. Eur J Soil Biol. 2011;47(6):374–9. 43. Johnson SE, Loeppert RH. Role of organic acids in phosphate mobilization
from Iron oxide. Soil Sci Soc Am J. 2006;70:222–34.
44. Mougel C, Offre P, Ranjard L, Corberand T, Gamalero E, Robin C, Lemanceau P. Dynamic of the genetic structure of bacterial and fungal communities at different developmental stages of Medicago truncatula Gaertn. cv. Jemalong line J5. New Phytol. 2006;170(1):165–75.
45. Gomes NCM, Fagbola O, Costa R, Rumjanek NG, Buchner A, Mendona-Hagler L, Smalla K. Dynamics of fungal communities in bulk and maize rhizosphere soil in the tropics. Appl Environ Microbiol. 2003;69(7):3758–66. 46. Subke JA, Hahn V, Battipaglia G, Linder S, Buchmann N, Cotrufo MF.
Feedback interactions between needle litter decomposition and rhizosphere activity. Oecologia. 2004;139(4):551–9.
47. Urbina H, Breed MF, Zhao W, Lakshmi Gurrala K, Andersson SGE, Ågren J, Baldauf S, Rosling A. Specificity in Arabidopsis thaliana recruitment of root fungal communities from soil and rhizosphere. Fungal Biology. 2018;122(4): 231–40.
48. Wang F, Chen S, Wang Y, Zhang Y, Hu C, Liu B. Long-Term Nitrogen Fertilization Elevates the Activity and Abundance of Nitrifying and Denitrifying Microbial Communities in an Upland Soil: Implications for Nitrogen Loss From Intensive Agricultural Systems. Frontiers in microbiology. 2018;9(2424).
49. DeAngelis KM, Brodie EL, DeSantis TZ, Andersen GL, Lindow SE, Firestone MK. Selective progressive response of soil microbial community to wild oat roots. Isme Journal. 2009;3(2):168–78.
50. Clemensson-Lindell A, Persson H. Effects of freezing on rhizosphere and root nutrient content using two soil sampling methods. Plant and Soil. 1992;139(1):39–45.
51. Blair G, Lefroy RDB, Lisle L. Soil Carbon Fractions Based on Their Degree of Oxidation, and the Development of a Carbon Management Index for Agricultural Systems. Australian J Soil Res. 1995;46:1459–66.
52. Nelson DW, Sommers LE. Total carbon, organic carbon and organic matter, in: Methods of Soil Analysis Part 2. Chemical and Microbial Properties. 1982; 539–79.
53. Bayon RCL, Weisskopf L, Martinoia E, Jansa J, Frossard E, Keller F, Föllmi KB, Gobat JM. Soil phosphorus uptake by continuously cropped Lupinus albus: a new microcosm design. Plant Soil. 2006;283(1):309–21.
54. Yasir M, Angelakis E, Bibi F, Azhar EI, Bachar D, Lagier JC, Gaborit B, Hassan AM, Jiman-Fatani AA, Alshali KZ, et al. Comparison of the gut microbiota of people in France and Saudi Arabia. Nutr Diab. 2015;5:e153.
55. Chemidlin Prévost-Bouré N, Christen R, Dequiedt S, Mougel C, Lelièvre M, Jolivet C, Shahbazkia HR, Guillou L, Arrouays D, Ranjard L. Validation and application of a PCR primer set to quantify fungal communities in the soil environment by real-time quantitative PCR. PLoS One. 2011;6(9):e24166. 56. Caporaso JG, Kuczynski J, Stombaugh J, Bittinger K, Bushman FD, Costello EK,
Fierer N, Pena AG, Goodrich JK, Gordon JI, et al. QIIME allows analysis of high-throughput community sequencing data. Nat Methods. 2010;7(5):335–6. 57. Edgar RC, Haas BJ, Clemente JC, Quince C, Knight R. UCHIME improves
sensitivity and speed of chimera detection. Bioinformatics. 2011;27(16): 2194–200.
58. Edgar RC. Search and clustering orders of magnitude faster than BLAST. Bioinformatics. 2010;26(19):2460–1.
59. Team RC: R: A language and environment for statistical computing. 2013:
www.r-project.org.
60. Oksanen J, Blanchet FG, Friendly M, Kindt R, Legendre P, McGlinn D, Minchin P, B. O’Hara R, Simpson G, Solymos P et al: Vegan: Community Ecology Package. Ordination methods, diversity analysis and other functions for community and vegetation ecologists. Version 2.5–1. 2018. URLhttps://CRAN.R-project.org/package=vegan.
61. Revelle W. Psych: procedures for personality and psychological research. Evanston: Northwestern University; 2018.https://CRAN.R-project.org/ package=psychVersion=1.8.12.
62. Clarke K. Nonparametric multivariate analyses of changes in community structure. Aust J Ecol. 1993;18(1):117.
Publisher’s Note