Vol.9 (2019) No. 6
ISSN: 2088-5334
Assessing Indonesia Spatial Data Infrastructure Using R for Disaster
Management
Zakiul Fahmi Jailani
# #Geo-Information Science, Wageningen University, Droevendaalsesteeg 4, Wageningen, 6708 PB, Netherlands E-mail: [email protected], [email protected]
Abstract— Indonesia is a country with high disaster risk, entitled to ring of fire as one of the countries, which are surrounded by
tectonic plates. The country has been exposed to natural hazards for decades. However, every time the natural hazard hits, the number of casualties remains huge. There is a serious question on how disaster management is going on in Indonesia and what knowledge could help to minimize or even prevent such huge casualties in any disaster occurrences. Big data can be a new approach towards natural disaster management mainly because it has the ability to visualize, analyze, and predict natural disasters. In the openly big data era, it is rather easy to process data with open-source software for managing the post-disaster as well as pre-disaster effect. The question remaining is how well the data is, which will be processed. This paper aims to appraise the quality of Indonesia's spatial data infrastructure using the R programming language in order to address natural disaster management and eventually lower the impact of the disaster. Some of the assessment criteria used in this paper are metadata of the data, positional accuracy, and completeness. The article concludes that Indonesia, as a country with high level of exposure to natural hazards, still lacks in NSDI quality, especially in providing disaster data. The most damaged buildings in Palu, with 2,416 damaged buildings affected. The sub-district of Nunu has the lowest number, with only 1 building damaged. The number of sub-sub-districts with damaged buildings in Palu is 14 of the total 43 sub-districts.
Keywords— disaster; R language; NSDI; spatial data infrastructure.
I. INTRODUCTION
Big data is a famous term nowadays to define the evolution of the traditional database. The storage of databases is differed hugely compare to big data, which holds the massive sizes of terabytes, petabytes, or even exabytes. The core aim of big data is to exploit its value and analyze the data in order to get insightful information out of it [1]. While big data holds huge potential power, location-aware geospatial data is receiving considerable attention as it holds capability that is even more powerful because it defines the data into the realm of the Spatio-temporal data. Big data infrastructure, which specifically stores the spatial data, is called National Spatial Data Infrastructure (NSDI), and it has received attention throughout the world as one of the most important infrastructures a nation should have because of its potential. Simple access to geospatial data is the key prerequisite for an efficient and economically prosperous society [2]. The NSDI of Indonesia is among the first generation NSDI globally, along with the United Kingdom, Australia, and Qatar [3].
The importance of big data for disaster management through the NSDI is crucial, as it will contribute to better decision-making, affectivity, and efficiency in disaster
management such as mitigation, preparedness, response, and recovery aid. It is more crucial seeing on how disasters damaged the economic close to 90 billion US dollars. This number over the past thirty years has tripled and has made 240 million people suffered from it [4]–[6]. Therefore, it is important to prepare any means to prevent disaster, including the optimal functionality of NSDI.
Furthermore, the maximum capability of spatial data infrastructure can only be achieved through a data-driven global society. Big Data is playing a key role in it as it holds the insight of the data. This paper's objective is to assess the most important and time-consuming aspect of working with data, which is where the data come from and how is the quality. Using Big Data can be crucial for effective disaster management. Disasters are mostly cannot be prevented. However, the effects of a disaster can be minimized, and insightful information played an important role in the process.
teams, for disaster mitigation and management, R is an excellent programming language because then it can work anywhere and at any time. R is also a cross-platform language that runs on many operating systems.
One particular portal of NSDI of Indonesia, which this paper tries to assess, is Ina-Geoportal, which stores specifically the spatial data of disaster occurrences in Indonesia. The question this paper tries to answer is whether the data stored in the NSDI of Indonesia has met the basic requirements in order to respond to the need for disaster management.
II. MATERIAL AND METHODS
The goal of this assessment is to look at the quality of the data stored in the NSDI of Indonesia, specifically for the purpose of disaster management. The proposed methodology applied in this paper to do so is acquiring the data needed from tanahair.indonesia.go.id and apply the simple basic plotting commands in Rstudio using the R programming language.
A. Data Source
Indonesia is one of the countries which has the highest risk of natural disaster in the world. For example, the 2004 Indian Ocean Tsunami in Aceh province, which killed over 165,000 people of the province, regarded as one of the deadliest disasters in the 21st century. This number contributes 70% of the recorded deaths due to the natural disasters in Indonesia since 1900 [7].
Recent casualties in the 2018 Palu-Donggala disaster still showed a high number. Questions remain on how the disaster can be minimized or even be prevented with the approach of spatial data. The result then will make disaster management in Indonesia better. However, first, the main thing to inspect is the quality of the data source.
Indonesia has implemented NSDI since 2007 with the Presidential Decree No. 85 of the Year 2007, strengthened by Law No. 4 of the Year 2011 and Presidential Decree 27 of 2014. The spatial data is open to the public and allows all governments, agencies and the Indonesian community to be able to search, find, take advantage, and share the spatial data through web address tanahair.indonesia.go.id.
The data used for this paper's research purpose is disaster data. One particular dataset this paper used is the destructed buildings data in the Tsunami, earthquake, and liquefaction natural disasters, which took 4,340 victims on 28th September 2018 at Palu Donggala, Sulawesi.
The available dataset in the portal, which is also used in this research, is the disaster data of 2018 Sunda Strait tsunami. Also, available data is the Mount Agung eruption data in Bali, as well as the flooding data in several places in South Sulawesi.
The other portal, which provides Indonesia disaster data, is inaRISK and inaSAFE. However, there is no raw data that can be found in those two portals. The available information in the portal is already processed data presented in webgis and statistical graphs. The InaRISK portal cannot even run properly to the date this research is finished.
Regrettably, the disaster data in ina-Geoportal is not up-to-date. The data of recent disasters occurred in various places in Indonesia is not available in the portal. For
example, the flash flooding occurred in Sentani, Papua, on 16th March 2019. Even the 2018 disaster data is not available in the portal, such as landslide in Brebes, the great earthquake in Lombok, and the tornado in Bogor.
B. Quality Assessment
An important process before starting to process any operational using data is to check whether the data meet the standard requirements needed. It is necessary as it will tell the integrity of the input data and would most likely damage the output. It can even become even harmful to the organization.
Data quality enhances data diagnosticity and firm decision quality. In order to assess the quality of the spatial data, the International Organization for Standardization (ISO) has set rules and standards for spatial data in the ISO/TC 211 19100 series of standards [8]. Some of the measurements in the standard, which will be assessed in this paper using R, are the metadata of the data, positional accuracy, and completeness [9].
The metadata is a critical item as it is explaining the information of the data, whether it is relevant to the operation to be applied for or not. Metadata plays a crucial role in the longevity of digital resources. Metadata of a preserved resource has to be preserved as well in order to preserve the digital resources [10].
While the positional accuracy of the data will give clarity towards the original map in the real world, avoiding map disorientation and further will avoid misinterpretation of the map analysis. Lastly, the completeness of the data will tell if the data is satisfying in every aspect to complete the operation, which will be conducted.
III.RESULTS AND DISCUSSION A. Packages
Any operation using programming language will require packages to be installed. Packages will increase the power of programming language by improving the existing of the programming language basic functionalities. In the R programming language, the official repository of R called the Comprehensive R Archive Network (CRAN) stored more than 15,000 additional packages of R.
Inside the R environments, R packages are collections of R functions and stored under a directory called the library. By default, R already installed a set of packages during installation. However, for many functions and advance operations, more packages are required to install by the user. Some packages essential for operations in this paper are raster, sf, sp, rgdal, ggplot2 and rgeos is needed for the software to manipulate geographic data into a simple feature and then will bind it with the Geospatial Data Abstraction Library (GDAL) as well as eventually mapping all variables aesthetically.
The methods available in the raster package are as follows: raster Create a RasterLayer object
writeRaster Write raster data to a file
The sf package in R implements the simple features open standard for the representation of geographic vector data in R. The methods available are as follows:
sf Create sf object
aggregate.sf Aggregate an sf object
sfc Create simple feature geometry list column
st Create simple feature from a numeric vector, matrix or list
st_as_sf Convert foreign object to an sf object st_as_sfc Convert foreign geometry object to an
sfc object
st_bbox Return bounding of a simple feature or simple feature set
st_coordinates Retrieve coordinates in matrix form st_geometry Get, set, or replace geometry from an sf
object
st_read Read simple features or layers from file or database
st_transform Transform or convert coordinates of simple feature
st_write Write simple features object to file or database
The sp package in R provides spatial data structures and methods for handling spatial data. The methods available in this package are as follows:
SpatialPolygons Create objects of class SpatialPolygons or SpatialPolygonsDataFrame
spTransform spTransform for map projection and datum transformation
For raster data manipulation, this research uses the rgdal package. The methods available in the rgdal package are as follows:
readGDAL Read/write between GDAL grid maps and Spatial objects
readOGR Read OGR vector maps into Spatial objects
writeOGR Write spatial vector data using OGR
For the beautiful, not difficult plots that take care of the details such as drawing the legends, this research uses the R package ggplot2. This package is very powerful because it is not limited to any graphics theme, so the user can freely and precisely tailor the new graphics. The methods available in these packages are as follows:
aes Construct aesthetic mappings CoordSf Visualize sf objects
fortify Fortify a model with data geom_map Polygons from a reference map ggplot Create a new ggplot
labs Modify axis, legend, and plot labels
qplot Quick plot
theme Modify components of a theme
B. Administrative Boundaries
Administrative boundaries are an important aspect used to analyze the spatial and temporal of the data. Although the ina-Geoportal also provides the administrative boundaries of Indonesia acquired by a local surveyor, this paper uses the administrative boundary from the Database of Global Administrative Areas (GADM) instead. The assessment of this paper, when using the local administrative boundary provided in the portal found that it is not integrated with the global coordinate system.
GADM usually be utilized for ArcGIS, and similar software is a spatial database that contains the location of the world’s administrative boundaries [11]. GADM also a high-resolution and open-source database which is available for academic purpose as well as for other non-commercial utilization. It is an excellent choice of administrative boundaries database to be utilized in a fast-response case such as in disaster management. The administrative areas in GADM are mainly countries and lower-level subdivisions such as provinces and sub-districts
This research utilized level 4 of the administrative boundary, which is on the sub-district level of Palu, Banten, Karangasem, Maros, Jeneponto, Bantaeng, Barru, Gowa, Soppeng, Wajo, and Makassar.
C. Metadata
Metadata has the same importance as the data itself as it contributes to the results equally. It became more crucial in the big data era as it will act as the pointer in the haystack of huge stored data. This way, metadata supports the selection of relevant data for the operation, which will be done by the researcher. The dataset available from the geoportal used in this research is shapefile, so several functions in R can be done to view the metadata of the file.
In order to view the geometry type, the st_geometry_type() function can tell whether it is a polygon, line string, point, multi polygon, multiline string, or multi-points. The coordinate reference system (CRS) is another important metadata in data which can be viewed in R using st_crs() function. It can show whether the CRS is EPSG, WGS84, UTM, or ETRS89.
TABLEI
DATA AVAILABILITY AND THE METADATA QUALITY
Data Availability and Metadata Quality
Data Type Completeness Metadata
Damaged buildings in
Palu
Damaged buildings point
Satisfying Complete
Soil liquefaction in
Balaroa
Liquefaction Positional
inaccuracy Complete
Soil liquefaction in
Petobo
Liquefaction Positional
inaccuracy Complete
Soil liquefaction in
Sidera Jono Oge
Liquefaction Positional
inaccuracy Complete
2018 Sunda
strait Tsunami Contour -
Unrelated to disaster managem
ent 2017 Mount
Agung Eruption in
Bali
Disaster-Prone Buildings
Satisfying Complete
Flooding in Maros, South
Sulawesi
Land Cover Satisfying Complete
Flooding in Jeneponto,
South Sulawesi
Land Cover Satisfying Complete
Flooding in Bantaeng,
South Sulawesi
Land Cover Satisfying Complete
Flooding in Barru, South
Sulawesi
Flood Risk Satisfying
Not Enough Metadata Flooding in
Gowa, South Sulawesi
Land Cover Satisfying Complete
Flooding in Soppeng,
South Sulawesi
Flood Risk Shape Area
insufficiency Complete
Flooding in Wajo, South
Sulawesi
Flood Risk Shape Area
insufficiency Complete
Flooding in Makassar,
South Sulawesi
Flood Risk Satisfying Complete
According to the observations presented in Table 1, the metadata of most available data acquired from ina-Geoportal has not met the requirements of the research objectives. Half of the flooding data in South Sulawesi contains only the land cover information such as in Maros, Jeneponto, Bantaeng, and Gowa. Half others of these flooding data only consist of flood risk area information, but they also, unfortunately, contain insufficiency of shape area. We can found this shortfall in the datasets of Barru, Soppeng, Wajo, and Makassar.
Table 1 also shows the flaw in the available data, such as the inaccuracy position of the liquefaction data in the Palu disaster, specifically in Balaroa, Petobo, and Sidera Jono Oge. Another flaw is the data type of Sunda strait Tsunami, which is unrelated to disaster management as it is in the form of contour data. The finest data with the most satisfying completeness and full completeness of the metadata can be found in the damaged building data that occurred in the Palu disaster.
D. Damaged Building Datasets
One of the most important datasets available and provided in the ina-Geoportal is the data of destructed buildings in the Tsunami and Liquefaction of Palu. According to the metadata, the data type of damaged buildings in Palu is multi-points, and the metadata is complete. The multi-points data can even explain the damaged building points to the level of each sub-district in the area. This is the reason why these multipoint data become the main dataset for this research.
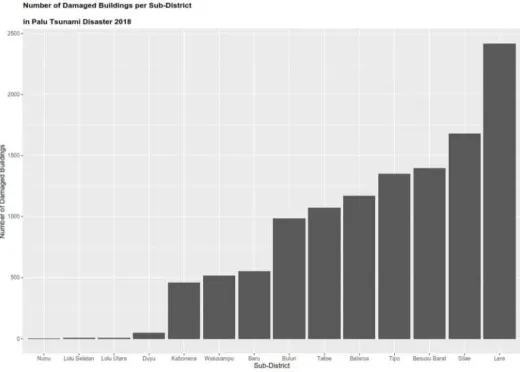
In order to see the graph of the datasets, simply subset the data and plot the destructed building corresponded to each sub-district. Once we subset the data, we will get the amount of destructed building per sub-district in a graph, which is presented in Fig. 1 below.
Fig. 1 Number of Damaged Buildings per sub-district
TABLEII
NUMBER OF DAMAGED BUILDINGS PER SUB-DISTRICT
Number of Damaged Buildings
Sub-District
1 Nunu
3 Lolu Selatan
4 Lolu Utara
44 Duyu
458 Kabonena
514 Watusampu
551 Baru
982 Buluri
1,070 Talise
1,170 Balaroa
1,349 Tipo
1,393 Besusu Barat
1,678 Silae
2,416 Lere
The datasets of a damaged building in Tsunami Palu disaster consisted of excellent datasets with complete metadata and detailed points of the damaged buildings up to sub-district level.
E. Plotting Data on Map
For plotting the damaged buildings per sub-district, import the shape file of the destructed building in Palu we got from NSDI of Indonesia with st_read, one of the sf package functions. Then plot the destructed building data on top of the administrative boundary. However, R cannot plot points that have NA (null) value to the map. Luckily, R has the power to simplify it and just replace the NA value to zero into the table.
Fig. 2 Plotting the damaged building data to the map of Palu
We can do so with is.na function and assign zero (0) value to it. For plotting all the destructed buildings into the correspondent area, we need to match both the coordinates of the administrative area and the building data. To do so, we can do it with st_coordinates function, which has the ability to retrieve coordinates in matrix form.
Eventually, we can plot all the data of the destructed building on top of the correspondent administrative area on the map and make it aesthetically pleasing with ggplot package. As shown in Fig. 2, some of the must-include features of the map, such as the title, coordinate systems bar, north arrow, and legend of the map is aesthetically included in the final map.
As it has discussed in the sub-section of metadata, the disaster area affected by soil liquefaction at Petobo and Jono Oge has position inaccuracy, and it affected the plot in the map, as showing in Fig. 2. The areas are not plotted in the right position.
IV.CONCLUSIONS
The National Spatial Data Infrastructure (NSDI) is unarguably a good tool for improving decision-making in disaster management. However, we need good data in order to make powerful data effective and efficient for such an occasion. In order to check such data, we can use R language in Rstudio as open-source software and assess the NSDI data in quick response.
Using several datasets, which is available in ina-Geoportal, some critical remarks can be concluded. One of the crucial findings in the NSDI of Indonesia is the coordinate system of the sub-district administrative area, which is included in the data acquired from the portal does not integrate with the global coordinate system, at least not with the spatial data functions in the R language environment. Fortunately, this problem can be tackled by using the GADM administrative boundaries instead.
The datasets' availability in the NSDI is also part of the critical remark found in this paper. Dataset availability is quite crucial for quick response in disaster management, especially in Indonesia, which is highly risky in disaster occurrences. The most important one to see is that there are several recent disasters, which the data have not been available yet in the portal. The disaster data such as flooding in Sentani Papua, the landslide in Brebes, earthquake in Lombok, and tornado occurred in Bogor has not been appeared yet to the date this paper is written. This is an issue of up-to-date data, which is a huge problem because any data, which is related to the disaster, is related to the reconstruction and reconciliation of the whole area affected by it, and the data should be available right away. That way the mitigation process will be effectively worked, and the damaged could be healed right away.
the spatial planning process. The benefit of quantitative data that VGI holds can fill in the drawback of NSDI [12].
For further research, it is interesting to see how R can be powerful and fast enough to respond to the disaster data available in other advanced NSDI in other countries such as the Netherlands, the United States of America, and INSPIRE (Infrastructure for Spatial Information in the European Community). It would also fascinating to see how another powerful language like Python could assess the disaster data and then later assist the disaster mitigation of an area. It is also important for upcoming research to determine the quality of disaster datasets with other assessment parameters other than the ISO standard. The assessment criteria from other research on spatial data infrastructure would be recommended to use.
ACKNOWLEDGMENT
All credit goes to Lembaga Pendidikan Dana Pendidikan (LPDP) Indonesia for sponsoring my study at Wageningen University and Research. I would like to thank my dearest friend and my classmate, Intan Ika Apriani, for her invaluable insight into this paper. Also to dr. ir. Lukasz Grus as my teacher, who also gives invaluable insight to expand the depth of this research.
REFERENCES
[1] N. Koseleva, and G. Ropaite, "Big data in building energy efficiency: understanding of big data and main challenges," Procedia Engineering, vol. 172, pp. 544-549, 2017.
[2] Mijić, M.S.N., Geod, D.E., Šestić, M. and El, D.E., 2018. “Future
development of NSDI based on the European INSPIRE Directive–A
case study of a Bosnian and Herzegovinian geoportal,” International Journal Of Spatial Data Infrastructures Research, 13, pp.315-338. [3] Masser, I., 1999. “All shapes and sizes: the first generation of
national spatial data infrastructures,” International Journal of Geographical Information Science, 13(1), pp.67-84.
[4] Centre for Research on the Epidemiology of Disasters (CRED), “EM-DAT: The OFDA/CRED International Disaster Database,” Belgium: Catholic University of Leuven, 2015.
[5] CRED, “Disasters in Numbers,” Centre for Research on the Epidemiology of Disasters–CRED, 2015.
[6] M. Ratiani, et al., “Teaching Disaster Risk Reduction with Interactive Methods: Book for Head of Class Teachers (Grades V-IX),” UNICEF, National Curriculum and Assessment Centre, 2011. [7] Cummins, P.R., 2017. “Geohazards in Indonesia: Earth science for
disaster risk reduction–introduction,” Geological Society, London, Special Publications, 441(1), pp.1-7.
[8] S. Hans-Jörg, "Quality assessment of volunteered geographic information using open Web map services within OpenAddresses," Proceedings of Geospatial Crossroads@ GI_Forum 11, 2011.
[9] ISO I. 19157: 2013: Geographic Information—Data Quality. ISO-standard and Swedish SIS ISO-standard. 2013.
[10] Li, C.Q., Nagamori, M. and Sugimoto, S., 2015, October. “Temporal interoperability of metadata: An interoperablity-based view for longevity of metadata,” in Proceedings of 6th International Conference on Asia-Pacific Library and Information Education and Practice (pp. 212-222).
[11] Pacheco-González, R., Ellwood, E., Exeter, D., Stewart, A.W., Asher, I. and ISAAC Phase Three Study Group, 2016. “Does urban extent from satellite images relate to symptoms of asthma, rhinoconjunctivitis and eczema in children? A cross-sectional study from ISAAC Phase Three,” Journal of Asthma, 53(8), pp.854-861. [12] Yudono, A., 2015. “Potential National Spatial Data Infrastructure