Seismic Performance Assessment of
Multi-Storeyed RC Moment Resisting Frames Based on
Plan Aspect Ratio by Pushover Analysis
Keerthy Peethambaran Vivek Philip
M.E Student Assistant Professor
Department of Civil Engineering Department of Civil Engineering
Saintgits College Of Engineering, Kottayam, Kerala, India Saintgits College Of Engineering, Kottayam, Kerala, India
Abstract
In urban areas, increase in population and scarcity of land, the horizontal development gets restricted that’s why most of the owners, building contractors, engineers are adopting vertical development of buildings for the construction. Natural hazard like earthquake affects the stability of such structures. Performance of structures in different areas of Northern part of India, during the earthquakes, is reviewed. The earthquake caused damage to heritage structures as well as modern buildings. Both masonry and reinforced concrete buildings showed poor performance. Previous studies reveal that major failures of structures occurred due to improper design procedures. Therefore, it is need of time to analyses & designs such hazard resisting structures so as to save human life and avoid property damage. The behavior of a building during earthquakes depends critically on its overall shape, size and geometry. Nonlinear pushover analysis has been used to evaluate the seismic performance of three buildings with four different plans having same area and height. The results of effects of plan aspect ratio on seismic response of buildings have been presented in terms of displacement, base shear. Behaviour parameters of the analyzed moment resisting frames also calculated.
Keywords: Pushover analysis, Seismic Performance, Aspect ratio, Base shear, Behaviour parameters
_______________________________________________________________________________________________________
I.
I
NTRODUCTIONOn a daily basis, most people take for granted the ground beneath their feet. Solid ground is a concept that many of us consider as a 100 percent guarantee. We drive our cars, commute to work, play outside, and relax in our homes with the comfort that the ground provides a solid foundation to our everyday life. However, the ground can move and at times move violently. Earthquake is one of the nature’s greatest hazards to properties and human lives. It poses a unique engineering design problem. An intense earthquake constitutes severe loading to which most civil engineering structures may possibly be subjected. The number of earthquakes reported worldwide, are usually followed by enormous death and injury. Not only life but also economy that are threatened from this disaster. The approach of engineering design is to design the structures in such a way that it can survive under the most severe earthquakes, during their service lives to minimize the loss of life and the possibility of damage.
The study of earthquake damage provides invaluable information about the performance of real structures during actual earthquake. It is like full scale testing of variety of prototype structures under real earthquakes. Each earthquake exposes the inadequacies of the prevalent design and construction practices in a region.
It also provides good features of the design and construction as these are based on actual behavior of prototype structure during the earthquakes.
The buildings designed and constructed by taking proper earthquake resistant measures have helped in minimizing the damage. The earthquake resistant design and construction have been evolved as a result of lessons learnt from the damages due to past earthquakes and helped in evaluation and modification of the provisions of the code of practice. In many cases, illustrates the effectiveness of earthquake resistant measures
Earthquakes or ground vibration can arise from both natural and man-made sources. The most common natural source of an earthquake is movement along a fault in the earth’s crust. Other natural potential causes include volcanic eruptions or large landslides, which can also be outcome of earthquakes. Meanwhile, man-made earthquakes are caused by such things as underground explosions or mining activities. On average, more than one million earthquakes are felt and recorded across the globe in a year. While most of these occurrences are small and non-threatening, there are occasional larger earthquakes that can cause significant damage and loss of life.
Design of structures for earthquakes is different from that for any other natural phenomenon, like wind and wave. An earthquake imposes displacement on the structure, while winds and waves apply force on it. The displacement imposed at the base of the structure during an earthquake causes inertia forces to be generated in it, which are responsible for damage in the structure. As a consequence of this, the mass of the structure being designed assumes importance; the more the mass, the higher is the inertia force. After a whole gamut of earthquake experiences collected during the 20th century from across the world, today the earthquake engineering community believes that there are four virtues of an earthquake-resistant structure. These are: Sufficient strength – capacity to resist earthquake forces,
Adequate stiffness – capacity to not deform too much,
Large ductility –capacity to stay stable even after a damaging earthquake, and
Good configuration – features of building size, shape and structural system that are not detrimental to favorable seismic behaviour.
Moment Resisting Frames A.
Reinforced concrete special moment frames are used as part of seismic force-resisting systems in buildings that are designed to resist earthquakes. Beams, columns, and beam-column joints in moment frames are proportioned and detailed to resist flexural, axial, and shearing actions that result as a building sways through multiple displacement cycles during strong earthquake ground shaking. Special proportioning and detailing requirements result in a frame capable of resisting strong earthquake shaking without significant loss of stiffness or strength.
Moment- Resisting Frame: It is frame in which members and joints are capable of resisting forces primarily by flexure.
Ordinary Moment-Resisting Frame(OMRF):It is a moment-resisting frame not meeting special detailing requirement for ductile behavior.
Special Moment-Resisting Frame (SMRF): It is a moment-resisting frame specially detailed to provide ductile behavior and comply with the requirements given in IS 4326 or IS 13920
All structural systems are not treated equal when response to earthquake-induced forces is of concern. Aspects of structural configuration, symmetry, mass distribution, and vertical regularity must be considered. The importance of strength, stiffness, and ductility in relation to acceptable response must also be appreciated. While considering the lateral force resisting systems we come up with so many options to have structural systems like Bearing wall systems, Moment Resisting frames, Lateral Bracing systems, designing the moment resisting concrete frame structures we have option to use IMRF, OMRF or SMRF. The basic step in conceptual design is to find the best suitable framing system and than lateral load resisting mechanism, while designing structures in the field mostly engineers face problem about the decision of Response Modification Factor R which is a measure of ductility and over strength of the structures. It is used to find the base shear which is distributed on different stories.
Configuration B.
Configuration is critical to good seismic performance of buildings. The important aspects affecting seismic configuration of buildings are overall geometry, structural systems, and load paths. Various issues related to seismic configuration are discussed in this section.
Plan Aspect Ratio 1)
It is not good to have buildings with large plan aspect ratio, just like it is not good to have buildings with large projections. During earthquake shaking, inertia force is mobilized in the building, usually at the floor levels where the mass is large. The inertia force then is distributed to different lateral load resisting systems (columns and/or structural walls). It is preferred to distribute this lateral inertia force to various lateral load resisting systems in proportion to their lateral load resisting capacities. This is achieved when the floor slabs do not deform too much in their own (horizontal) plane. This condition, when floor slab helps in distributing the inertia force to different lateral load resisting systems in proportion to their stiffness, is known as rigid diaphragm action. However, the inertia force is distributed based on tributary area when floor slabs deform in their plane. T his leads to overloading of members with less capacity and thus causing undue damage to buildings. Floor slabs in buildings with large plan aspect ratio (>4) may not provide rigid diaphragm action.
Pushover Analysis C.
The static pushover analysis is becoming a popular tool for seismic performance evaluation of existing and new structures. The expectation is that the pushover analysis will provide adequate information on seismic demands imposed by the design ground motion on the structural system and its components. The purpose of the paper is to summarize the basic concepts on which the pushover analysis can be based, assess the accuracy of pushover predictions, identify conditions under which the pushover will provide adequate information and, perhaps more importantly, identify cases in which the pushover predictions will be inadequate or even misleading.
computed. This type of analysis enables weakness in the structure to be identified. The decision to retrofit can be taken in such studies.
Performance Point D.
Building performance level can be determined by target displacement using capacity spectrum method (ATC 40). The capacity spectrum method allows for a graphical comparison between the structure capacity and the seismic demand. Pushover curve represents the lateral resisting capacity and response spectrum curve represents the seismic demand.
Pushover analysis can provide a significant insight into the weak links in seismic performance of a structure. The performance criteria for pushover analysis are generally established as the desired state of the building given roof-top or spectral displacement amplitude. For obtaining the performance point of the building frame in terms of base shear the design base shear is calculated for determining the safety of the frame. The intersection of demand spectrum and capacity spectrum is the performance point of the structure. If the base shear at performance point is greater than design base shear then the structure is safer. The design base shear is calculated as per IS : 1893:2002.
At the performance point, the resulting responses of the building should then be checked using certain acceptability criteria. The Performance Point thus obtained from pushover analysis is then compared with the calculated target displacement.
II.
O
BJECTIVES OF THE STUDY To focus more on various aspects related to the performance of SMRF buildings.The main objective of present study is the study of comparative performance of MRF designed as per IS codes, using nonlinear analysis.
RC framed Buildings, regular and irregular in plan can be considered.
On building frame the nonlinear static pushover analysis is performed to investigate the performance point of the building frame in terms of base shear and displacement.
The objectives of the present study can be identified as follows:
To evaluate the effects of different plan aspect ratio on the performance level of buildings by Non linear static pushover analysis.
To investigate the performance point of building in terms of base shear and displacement. To find behaviour parameters of building
III.
M
ETHODOLOGYThe methodology worked out to achieve the above-mentioned objectives is as follows:
Review the existing literature and Indian design code provision for designing MRF building Modelling of the building without considering infill strength/ stiffness.
Models need to consider fixed end support condition.
Nonlinear analysis of the selected building model and a comparative study on the results obtained from the analyses. Observations of results and discussions
Conclusion and further recommendation keeping the scope of this study in mind.
IV.
S
UMMARY OF LITERATURE REVIEW An extensive literature review is done and the inference is noted down.It is well established from various studies that ductile detailing is necessary to resist earthquakes. Many works have been done regarding buildings with ductile detailing. There were very less number of works has been done in the past based on IS codes.
V.
B
UILDING DETAILS AND MODELLING FOR ANALYSISThis Chapter deals with the selection and design of building frames as per the design code procedures. The designed frames are modelled for nonlinear analysis. It is necessary to develop a computational model to perform any kind of analysis. The parameters defining the building models, the basic assumptions and the geometry of the selected buildings for the study is discussed. This includes the development of concentrated plasticity hinges at the critical sections of beams and columns.
Building Configuration and Design Details A.
Fig. 1: Geometric shapes adopted for models
Fig. 2: Geometric shapes adopted for models
The storey height is 4m, which is same for all frames. Each frame is designed as MRF considering response reduction factor is 5. IS code suggests a response reduction factor of 5 for SMRF. The design of the frames is carried out by conducting linear static analysis of bare frames and accounting for all the load combinations suggested by IS 1893(2002).
The material properties and the geometric parameters considered in the study are listed in Table1. M25 concrete is used at the design stages, along with Fe415 steel. The detailed description about seismic data is given in the Table 2.
Table -1
Material properties and Geometric parameters assumed
Sl.no Design Parameter Value
1 Unit weight of concrete 25kN/m3
3 Characteristic strength of steel 415MPa
4 Modulus of elasticity of steel 2e5 Mpa
5 Slab thickness 120 mm
Table -2
Seismic Design Data assumed for Special Moment Resisting Frames
Sl.no Design Parameter Value
1 Seismic Zone IV
2 Zone factor(Z) 0.24
3 Response reduction factor (R) 5
4 Importance factor(I) 1.5
5 Soil type Medium soil
6 Frame type Special Moment Resisting Frame
Table – 3
Loads considered for designing buildings
Sl.No Load type Value
1 Self-weight of beams and columns As per dimensions
2 Weight of slab 11.25 KN/m
3 Parapet weight 2 KN/m
4 Floor finish 2 KN/m
5 Live load 3KN/m
VI.
P
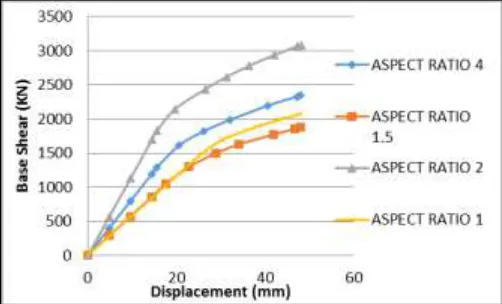
ERFORMANCE ASSESSMENT OF DESIGNED FRAMESThis chapter deals with the performance assessment of the designed buildings. The buildings are modelled in SAP2000 for nonlinear analysis. The pushover analyses of all the frames discussed in the previous sections is conducted. The base shear versus roof displacement at each analysis step is obtained. The pushover curves are presented in each case.A comparison study is carried out to observe the difference in behaviour of buildings.
Design Base Shear Calculation A.
The design base shear is calculated as per IS: 1893: 2002 as follows: The seismic weight of building is found to be (Wi)
As the frame is bare frame, therefore, fundamental time period T is obtained by using the following formula Ta = 0.075 h.75 IS 1893 (Part 1):2002, Clause 7.6.1 Zone factor, Z = 0.24 for Zone IV IS: 1893 (Part1):2002, Table 2 Importance factor, I = 1.5
Medium soil site and 5% damping Sa/g= ?
Ductile detailing is assumed for the structure. Hence, Response Reduction Factor, R, is taken equal to 5.0. It may be noted however, that ductile detailing is mandatory in Zones III, IV and V.
Hence, horizontal seismic coefficient is calculated as
g
S
2R
ZI
A
h
a IS: 1893 (Part 1): 2002, clause 6.4.2The design Base shear, Vb = Ah×W IS: 1893 (Part 1): 2002, clause 7.7.1
Table - 4 Design base shear values
Sl.no Building Configuration Ta Sa/g Ah Wi
(KN)
Base Shear Vb (KN)
1 Aspect Ratio 1 0.813 1.672 0.0601 19688 1183.24
2 Aspect Ratio 1.5 0.813 1.672 0.0601 18674.37 1122.32
3 Aspect Ratio 2 0.813 1.672 0.0601 21323.9 1281.56
4 Aspect Ratio 4 0.813 1.672 0.0601 21118.25 1269
Performance Point Determination of Special Moment Resisting Frame B.
The seismic demand is also related to the nonlinear behavior of the structure and is obtained iteratively. The intersection of the demand spectrum with the nonlinear pushover response is called “Performance Point”. It corresponds to the state the structure is expected to reach under the considered earthquake. Depending on the position and state of the performance point (with respect to the actual pushover curve), the analyst may decide on how safe or vulnerable the structure is and where possible strengthening should be performed.
For pushover analysis the various pushover cases are considered such as push gravity, push X .The various load combinations are also used for this purpose. After pushover analysis the demand curve and capacity curves are obtained to get the performance point of the structure. The performance point is obtained as per ATC 40 capacity spectrum method. The base shear for PUSH load case is shown in table 3.
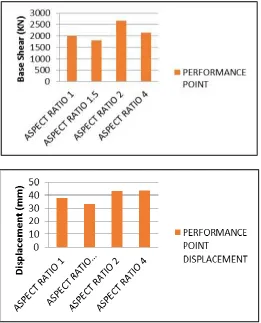
Fig. 4: Base shear and displacement at Performance point
Table – 5 Performance Comparison
Sl
no Building Configuration Base Shear At Performance Point (KN) Design Base Shear (KN) % Increase In Base Shear
1 Aspect Ratio 1 1992.978 1183.2 40.62%
2 Aspect Ratio 1.5 1797.233 1122.3 60.13%
3 Aspect Ratio 2 2673.409 1281.5 108.6%
4 Aspect Ratio 4 2131.639 1269.0 67.97%
All four buildings were analyzed for static nonlinear (pushover) analysis in x direction using SAP2000. The Base shear versus displacement graphs have been plotted and compared for all models. Maximum base shear has been found in Case 3 (building with plan aspect ratio of 2) and Case 2 shows the least value of base shear as shown in Figures. Displacement value is same for case 3 and case 4, while least value is for case 2.Ductile behaviour is more for case 3. All frames are safe because base shear at performance point is higher than design base shear. The number of hinges increases with increase in plan aspect ratio, Increase in base shear ranges between 40%-108%.
Behaviour Parameters of the Buildings C.
A number of performance parameters may govern the capacity of a structure. In order to carry out an inelastic pushover analysis, one or a number of these parameters should be considered for determination of the displacement limit state (Δmax). In a comparative study conducted by Mwafy and Elnashai (2002) on different classes of buildings, a number of global collapse criteria, including interstorey drift limit, column hinging mechanism, limit on drop in the overall lateral resistance and stability index limit, were considered. They concluded that the interstorey drift is the collapse parameter that controls the response of buildings designed to modern seismic codes. The R factor parameters for each system were extracted from the respective pushover response curve. The ductility dependent component,
Estimation of over strength factor
Vy is the base shear coefficient corresponding to the actual yielding (from push over curve) Design Base shear Vd=(as per EQ
calculation)
Rs=Vy/Vd
Estimation of Ductility reduction factor
R μ= Ve/Vy
Ve= max base shear coefficient
Structure ductility, μ
Yield drift Δy=(from pushover curve)
μ = Δm/ Δy
Table - 6 Behaviour parameters
Building Configuration Rdes RS R μ μ
Aspect Ratio 1 5 1.684 1.041 1.264
Aspect Ratio 1.5 5 1.601 1.046 1.450
Aspect Ratio 2 5 2.086 1.155 1.108
Aspect Ratio 4 5 1.679 1.100 1.106
Ductility factor is higher than one for every frame, shows good performance.
VII.
C
ONCLUSIONSMoment Resisting Frame (MRF) is studied for different building configurations, infill conditions and support conditions. The buildings are designed and modelled using computational software. Nonlinear analysis is performed on these buildings and the response is monitored. A pushover curve comprising of Base Shear versus Roof Displacement is plotted for each frame using the analysis data. .
The plan dimensions have significant effect on the the seismic behaviour of the buildings.
The building with plan aspect ratio 1.5 shows the least base shear in both directions, thereafter base shear significantly increases with increase in plan aspect ratio.
The nonlinear static pushover analysis is performed to investigate the performance point of the building frame in terms of base shear and displacement.
After performing the analysis the base shear at performance point is found is greater than design base shear. Since at the performance point base shear is greater than the design base shear the building frame is safe under the earthquake loading. Percentage increase in base shear is 40-108%.
The building beahaviour parameters such as the ductility reduction factor Rµ , the over strength factor RS, and the ductility factor µ , are calculated from the pushover curve of each building. The behaviour parameters give an idea about the performance of the building and from the values of Rµ and µ obtained, it can be concluded that SMRF buildings possess higher ductility.
The over strength factor Rs, is also having a value greater than 1 in all cases depicting the fact that the buildings designed for current study can withstand more loads than what they are designed for.
R
EFERENCES[1] A. Shuraim, A. Charif, (2007) Performance of pushover procedure in evaluating the seismic adequacy of reinforced concrete frames. King Saud University [2] Athanassiadou CJ. (2008), Seismic performance of R/C plane frames irregular inelevation. Engineering Structures 2008;30:1250
[3] Das, S. (2000),”Seismic design of vertically irregular reinforced concrete structures”, Ph.D Thesis, North Carolina State University”,Raleigh. NC. [4] Davis, P. R., (2009) Earthquake Resistant Design of Open Ground Storey RC Framed Buildings. Ph.D. Thesis, Indian Institute of Technology Madras,
Chennai.
[5] Dr. Valsson Varghese, Yogesh Ramakant Borkar(2013) Comperative Study Of S.M.R.F. Building Over O.M.R.F. Building With Seismic And Wind Effect,International Journal of Engineering Research and Applications (IJERA) ISSN: 2248-9622
[6] Duan, H., & Hueste, M. B. D. (2012). Seismic performance of a reinforced concrete frame building in China. Engineering Structures, 41, 77–89.
[7] Dutta, S. C., (2001),” Effect of Strength Deterioration on Inelastic Seismic Torsional Behaviour of Asymmetric RC Buildings,” Building and Environment, 36(0), 1109-1118.
[8] Foley CM. (2002),” Optimized performance-based design for buildings. Recent advances in optimal structural design”, American Society of Civil Engineers; p. 169–240.
[9] G.V.S.Sivaprasad1, S. Adiseshu2(2013) A Comparative Study Of OMRF & SMRF Structural System for Tall & High Rise Buildings Subjected to Seismic Load, International Journal of Research in Engineering and Technology, volume: 02 Issue: 09; p.239-250
[10] Hasan, R., Xu, L., & Grierson, D. E. (2002),” Push-over analysis for performance based seismic design”, 80(July), 2483–2493.
[11] Haselton, C.B. and G.G. Deierlein (2007). “Assessing Seismic Collapse Safety of Modern Reinforced Concrete Frame Buildings”,Blume Earthquake Engineering Research Center Technical Report No. 156, Stanford University, 313 pp.
[12] IS: 13920,(2002),” Indian Standard Code of Practice for Ductile Detailing of Reinforced Concrete Structure Subjected to Seismic Forces”, Bureau of Indian Standards, New Delhi.
[14] IS: 456 (Fourth Revision),(2000),”Indian standard code for practice for plain reinforced concrete for general building construction”, Bureau of Indian Standards, New Delhi.
[15] IS 875 Part 1, 2, 3 and 4,(1987),”Indian Standard Code of practice for Design loads for buildings and structures”, Bureau of Indian Standards, New Delhi. [16] Mohammad H. Jinya1, V. R. Patel2(2014) International Journal of Research in Engineering and Technology Building, 147(August 2007), 137–147. [17] Krawinkler, H., & Seneviratna, G. D. P. K. (1998),”Pros and cons of a pushoveranalysis of seismic performance evaluation”, Engineering Structures,
20(4-6), 452–464.
[18] Liel, A. B., Asce, M., Haselton, C. B., Deierlein, G. G., & Asce, F. (2011). Seismic ollapse Safety of Reinforced Concrete Buildings. II : Comparative Assessment of Nonductile and Ductile Moment Frames, (Icbo 1967), 492–502.
[19] Mehmet Inel, Hayri Baytan Ozmen.(2006),”Effects of plastic hinge properties in nonlinear analysis of reinforced concrete buildings”, Department of Civil Engineering, Pamukkale University, 20070 Denizli, Turkey.
[20] Murty, C. V. R.(2002),”Performance of reinforced concrete frame buildings during 2001 Bhuj earthquake”, Proceedings of the 7th US National Conference on Earthquake Engineering. Boston. USA. Paper No. 745.
[21] Poluraju, P. (2011). Pushover analysis of reinforced concrete frame structure using SAP 2000, 04(06), 684–690.
[22] Pradip, Sarkar., (Dec. 2008),”Seismic Evaluation of Reinforced concrete stepped building frames”, A thesis for the award of the degree of doctor of philosophy, IIT Madras, Chennai. National Institute of Technology, Rourkela Page - 70 -
[23] Priestley, M. J. N. & Park, R.(1987),”Strength and Ductility of Concrete Bridge columns Under Seismic Loading”, ACI Structural Journal, Technical paper, 61-76, January-February.
[24] Sadjadi, R., Kianoush, M. R., & Talebi, S. (2007). Seismic performance of reinforced concrete moment resisting frames. Engineering Structures, 29(9), 2365–2380.