University of New Orleans University of New Orleans
ScholarWorks@UNO
ScholarWorks@UNO
University of New Orleans Theses and
Dissertations Dissertations and Theses
5-14-2010
Development of an Interactive, Hands-on Learning Experience of
Development of an Interactive, Hands-on Learning Experience of
the Google Maps API
the Google Maps API
Rushikesh Digambar Kale
University of New Orleans
Follow this and additional works at: https://scholarworks.uno.edu/td
Recommended Citation Recommended Citation
Kale, Rushikesh Digambar, "Development of an Interactive, Hands-on Learning Experience of the Google Maps API" (2010). University of New Orleans Theses and Dissertations. 1199.
https://scholarworks.uno.edu/td/1199
This Thesis is protected by copyright and/or related rights. It has been brought to you by ScholarWorks@UNO with permission from the rights-holder(s). You are free to use this Thesis in any way that is permitted by the copyright and related rights legislation that applies to your use. For other uses you need to obtain permission from the rights-holder(s) directly, unless additional rights are indicated by a Creative Commons license in the record and/or on the work itself.
Development of an Interactive, hands-on Learning Experience of the Google Maps API
A Thesis
Submitted to the Graduate Faculty of the University of New Orleans in partial fulfillment of the requirements for the degree of
Master of Science in
Computer Science
Database Systems and Distributed Applications
by Rushikesh Kale
ii
Acknowledgement
Sincere thanks to all my friends and family members who provided valuable help and moral support while working on this thesis. Special thanks to my Major Professor Dr. Shengru Tu for his excellent guidance and timely feedback without which this thesis would not have been possible. I would also like to extend thanks to Dr. Mahtab A. Lodhi under for teaching me remote sensing and GIS. The funding for this study was provided by the Mississippi State University, Center for Urban Rural Interface Studies (CURIS) and the Department of
iii
Table of Contents
List of Figures ... v
List of Tables ... vi
Abstract ... vii
Chapter 1. Introduction ... 1
Chapter 2. Background: Hands-on Online Interactive Learning ... 4
2.1 Hands-on Learning Model ... 4
2.2 Background information of basic concepts ... 5
2.2.1 Geographic Information System (GIS) ... 5
2.2.2 Google Maps API ... 6
2.2.3 JavaScript ... 6
2.2.4 XML DOM Scripting... 7
2.3 Verification Teaching Approach ... 7
2.3.1 Verification ... 8
2.3.2 Components of Verification... 9
Chapter 3. Development of Underlying Systems ... 12
3.1 Scope of the project ... 12
3.3. The Google Maps API Technology ... 13
3.3.1 Overview of Google Maps API ... 13
3.3.2 Main components of Google Maps ... 15
3.4 Development of CGISS using the Google Maps API ... 19
3.4.1 CGISS Web Application Features ... 20
3.4.2 JavaScript Program Structure ... 23
3.4.3. CGISS Programming Structure... 24
Chapter 4. Development of Hands-on Interactive Learning System for Google Maps API ... 29
4.1 Interface design ... 29
4.2 Learning labs ... 31
4.2.1 Description of Lab 1 ... 32
4.2.2 Description of Lab 2 ... 38
4.2.3 Description of Lab 3 ... 41
4.3 Other learning lab features ... 43
4.3.1 Creation and injection of functions ... 43
4.3.2 Lab Specific Subset of Function Tree ... 45
Chapter 5. User Feedback ... 47
5.1 Efficiency of learning GIS ... 49
5.2 Efficiency of learning Google Maps API... 50
5.3 Difficulty of the exercises ... 51
iv
5.5 Time consuming ... 53
5.6 Attitude to Web page design ... 54
5.7 Easier exercises ... 55
5.8 To understand concept better ... 56
5.9 Learning approaches preference... 56
Chapter 6. Discussions and Future Work ... 59
References ... 60
v
List of Figures
Figure 1 Hands-on Interactive Learning Model... 5
Figure 2 Costal areas of Southeast Louisiana, Mississippi, Alabama, and West Central Florida 13 Figure 3 Basic elements of Google Maps ... 15
Figure 4 Map instance of GMap class ... 16
Figure 5 Control elements in a map ... 17
Figure 6 Opening info window in a map ... 18
Figure 7 Gpoint ... 18
Figure 8 Gpolyline ... 18
Figure 9 Snapshot of GeoTool showing normal map ... 20
Figure 10 Snapshot of GeoTool showing Satellite map ... 21
Figure 11 Snapshot of GeoTool page showing Hybrid map ... 21
Figure 12 Snapshot of GeoTool page showing Terrain map ... 22
Figure 13 Snapshot of GeoTool page showing address location of New Orleans ... 23
Figure 14 JavaScript Program Structure ... 24
Figure 15 Function Tree Structure ... 25
Figure 16 Hands-on Interactive Learning Model Interface ... 30
Figure 17 Interface Panel Design... 30
Figure 18 Screenshot of page after following step 1 to 3 ... 33
Figure 19 Screenshot of page after following step 4 ... 35
Figure 20 Screenshot of page after following step 5 ... 36
Figure 21 Screenshot of page after following step 6 ... 37
Figure 22 Screenshot of page after following step 7 ... 38
Figure 23 Snapshot of final result of lab 2 exercises for adding Zoom function... 39
Figure 24 Snapshot of final result for lab 3 of adding Normal map viewer button ... 41
Figure 25 How functions gets created and injected in the call tree ... 44
Figure 26 Function tree driven by helper function ... 46
Figure 27 Survey Questionnaire ... 48
Figure 28 Survey result for question1... 49
Figure 29 Survey result for question 2... 50
Figure 30 Survey result for question 3... 51
Figure 31 Survey result for question 4... 52
Figure 32 Survey result for question 5... 53
Figure 33 Survey result for question 6... 54
Figure 34 Survey result for question 7... 55
Figure 35 Survey result for question 8... 56
Figure 36 Survey result for question 10 by CS students... 57
vi
List of Tables
vii
Abstract
The project is to design and implement a Web application for realizing an innovative, hands-on interactive learning experience for the Google Maps API. This learning environment was developed based on a real-world Geographic Information System (GIS), the Gulf of Mexico Coastal Geospatial Information Support System. Significant efforts were invested not only in development of this GIS system, but also in the design and implement that turns the production system into a learning environment.
The Web development aspect attracts computer science students, while the opportunity to learn GIS concepts in an interactive way to attract students from the geography department and the opportunity to learn the Google Maps API proves interesting to regular internet users. The Web learning system was given to a focus group whose feedback was collected through a survey. The survey results reveal a favorable response to the interactive, hands-on learning model and the Web implementation.
Keywords
Google Maps API GIS Hands-on Online learning DOM Scripting Google Map Server
1
Chapter 1. Introduction
In the Internet era, a student‟s life is usually filled up with fascinating computing widgets and services. However, the learning platforms of the computer science (CS) foundation-building courses at the freshman and sophomore levels have not been sufficiently updated. Most of the examples in textbooks are painfully trivial. This poses stumbling blocks to undergraduate
students' learning experience. Therefore, there is an urgent need to enrich the CS learning context with the addition of fascinating computing widgets.
The main purpose of this research is to enhance the perception about the CS learning process which is important from a motivational and educational standpoint. This project aims to facilitate students' involvement in real- world computing tasks, for instance retrieving maps loaded with satellite image data. Such a task can immediately receive strong interest from students at all levels. Implementation of the project has demanded serious design and
programming in order to assist students‟ learning through a series of hands-on activities. This kind of preparation is wrapped in a hands-on learning case, which defines the configuration of the system and consists of elements such as the justification of the s ystem's existence, the requirement specification, description of the functionality, a set of trial cases and a series of technical objectives.
The final goal of this project is to rejuvenate the computer science (CS) programs and to attract, motivate and retain more students in computing. Eventually we can produce more competent information technology (IT) workers, more computer science researchers and more professionals capable of computational thinking (CT).
2
and Google maps is a cutting-edge popular technology. GIS proves to be a good candidate as a learning subject because it is related to both the field of geography and the field of computer science. GIS applications can attract students from both of the fields. The Google Maps API is an ideal candidate of learning subject because students love to know the map functionality behind Web applications people enjoy daily. An ambitious student might want to know how he can incorporate maps on a Website of his own. In this project, we retooled a Web application into a teaching and learning tool. It offers the students an opportunity to learn Web site development, GIS concepts and the features of Google Maps API. The Web development aspect attracts computer science students, while the opportunity to learn GIS concepts in an interactive way attracts students from the geography department. The Web interface was given to a focus group for use. The focus group of students was surveyed. This group gave a favorable response to the Hands-on interactive learning model and the Web interface as the tool.
Chapter 2 discusses various learning methodologies and the research done in this field. The methods discussed in the chapter reveal the usage of software, verification and testing being put to use as a tool for teaching. Chapter 3 discusses the production system in detail and how it forms the basis of the hands-on learning interface. The chapter also explains the concept of Google Maps API model in detail. It provides the definitions of key ideas, the steps involved in the methodology, the tools used in the model, the objective of the methodology and the
advantages of the process. The chapter also describes the concepts of GIS and how they can be used as a test subject that can be taught to students using the hands-on interactive online learning model.
3
interactive learning interface. It also gives a detailed explanation of the Web interface used as an implementation of the hands-on interactive online learning methodology. The Web interface is used as a tool to teach the students important concepts of developing a GIS Web site and how each component of the interface maps to a module in the hands-on interactive online learning model.
Chapter 5 lists the results and measurements of the surveys taken among focus groups. The chapter also provides an analysis of the responses given to the surveys by the focus group.
4
Chapter 2. Background: Hands-on Online Interactive Learning
2.1 Hands-on Learning Model
A learning case consists of the following components: 1) A self-contained working system.
2) The justification of the system‟s existence and background information. 3) The requirement specification of the system.
4) The description of the functionality of the system including an intuitive explanation of rules and solution logic.
5) The user guide of the system.
6) A set of test cases (pairs of input data and expected output) of the system.
7) Decomposition of the system is prepared and presented to the students as subsystems, components and objects; each has its functionality specification and user guide. 8) The specifications of interfaces between the components and objects.
9) A set of intuitive user interfaces that allow students to interact with the components or objects.
5
Figure 1 Hands-on Interactive Learning Model
The hands-on learning cases enable early- year students to be involved in the real-world problems in a wide spectrum of subject systems that are serving real research projects in areas such as bioinformatics, digital forensics, information security systems, geographical information systems, enterprise Web applications and Web services. We want students to be excited and enthusiastic about computing and computational thinking. The students start unconsciously dealing with and gradually commanding system modeling.
2.2 Background information of basic concepts
To understand the design of learning interface created for hands-on learning, it is necessary to have background information o f the following concepts.
2.2.1 Geographic Information System (GIS)
6
In a digital map, map layers are used to represent different types of topological maps namely vector maps, raster satellite maps [10] and hybrid maps. The Google Maps API provides various tools to access these map layers. Spatial data contains two kinds of features namely, Discrete features and Continuous features. Discrete feature include points (e.g. Home), lines (e.g. Roads), and area (e.g. Marsh area). Continuous features are features that exist spatially between observations (e.g. elevation and precipitation).
2.2.2 Google Maps API
A Google map is a popular Web site. It is used by many Internet users to view the maps of the world. The Web site offers different modes of view such as street view, satellite and terrain view. The Web site also provides directions between multiple locations. The Web site provides features to zoom- in and zoom-out of a map. Google has provided programmers with an API that can be used to incorporate the Google map Web site features on the individual‟s Web site. The Internet surfer might be curious about the functionality behind the Web site. It thus has a potential to become a learning topic for many computer science, GIS and internet users. A key factor about the Web site states that visitors who use Google Maps with Street View spend on average of 30% more time exploring content on the Web [6]. The thesis project is mainly the implementation of a hands-on interactive learning tool on Google Maps API as a Web interface tool.
2.2.3 JavaScript
7
the development of enhanced user interfaces and dynamic Websites. To implement hands-on learning interface JavaScript is used as primary programming language.
2.2.4 XML DOM Scripting
The XML DOM (Document Object Model) defines a standard way for accessing and manipulating XML documents. The DOM presents an XML document as a tree-structure [11]. XML DOM scripting plays an important role in adding interactive functionalities to a learning interface. Most modern Web browsers are compliant to the DOM object model with which HTML documents along with their correspo nding Web pages can be changed dynamically in technologies such as Ajax. In doing so, the Web pages are treated in a tree model that holds all the objects the Web page contain. In HTML, the “div” element is commonly used as a
placeholder that can group block-elements [12]. The Google Maps API provides various DOM elements to display customized GIS objects. For example GMap2 DOM element is used for displaying map on a Web.
2.3 Verification Teaching Approach
8
2.3.1 Verification
Education is a two way interaction between the educator and the learner. There is constant exchange of information and the learner gets an opportunity to revise, verify and reiterate the concepts learnt using two methods:
Self verification deals with the non formal events the learner engages in to establish what has been mastered and what has been memorized or can be produced or done.
Formal verification is the student‟s opportunity to confirm what has been learned. In a learning environment just about every action and communication from the learner can be construed to be part of the confirmation process.
Let us consider the concept of self verification and how it is one of the driving forces behind hands on learning methodology. There is certain degree of passive learning in all types of education. Hearing to recordings, lectures notes, reading educational topics online are some of the activities done outside the classical classroom environment. This is when the learner is gaining knowledge through activities without the educator playing an active role in the
conveying the concepts. This passive aspect of a learners attempt to understand the subject can be used to explain the two processes of verification where the learner involves himself in daily chores such as online surfing, reading newspapers and observation of his surroundings and his usage of similar formal and non formal tools in gaining knowledge.
Self- Verification
9
involving some of the non formal tools of education. The learner gets educated by means of interacting with people at home and outside and this interaction forms the self verification aspect of learning. In the hands on learning lab we try to introduce this kind of self verification. We put interesting information on the web interface that would attract a student and grab his attention. This information could be of geographical importance and general information purpose. It could increase the student‟s knowledge about the area he or she lives in. The weather in the area the student lives or attends the school and the maps and roads that he or she uses for day to day travel can be provided on the web interface as a simple information they can read during their daily activity of surfing the web or reading through the department website for general
information about the course and curriculum. Formal Verification
Formal verification involves use of the well defined and tangible items available in a typical classroom environment such as books, reports, assignments and examinations. It involves the interaction between the student and the teacher in a we ll defined manner dictated by the curriculum and the scope of topic that needs to be taught. It is thought to be the dominant and integral part of education system. We try to incorporate this aspect of education in the hands on learning methodology by putting a step by step instruction guide with a fixed set of actions that result in expected results that can be verifies. In addition to these steps there is a user manual that assists and guides the student in each step so that the students find answers to a ny difficulties they come across while learning a particular topic.
2.3.2 Components of Verification
10 2) Verification for Instructions
3) Verification for Teaching
Each component has been described in detail as follows: Verification for Fundamentals
Education needs to convey the fundamentals in a manner which is clear and interesting at the same time so that the students find it appealing to learn. The hands on learning met hodology try to make the topic interesting by offering the fundamentals and key concepts in an interactive, visual and verifiable manner. The visual aspect gives makes the learning process more fun and interesting. The interactive aspect keeps the students engaged in the activity. The quick response and the user manual with the expected results make the process verifiable. The students can use the web site as a self verification tool to understand the concepts. The structure of the lab specifically designed for teaching a particular concept forms the formal aspect of the education process. The thesis focuses on involving the processing of teaching and learning the concepts of GIS and client side programming and google map API using the hands on learning methodology. Verification for Instructions
11
teach and which part of the website can be understood and explored for a given lab. Formal verification can be achieved by following the instructions to complete the lab itself.
Verification for Teachings
Education can form the building block in turning a student into a valuable resource and a future educator. For this to happen it is important that the student is thorough in his or her research and understanding of the fundamentals as well as has a very high level of expertise in conducting the task of practically applying the key concepts learnt in the topic. The hands on learning methodology is very useful to achieve both the goals of training the student in the role of a future educator as well as making the student an expert in the topic and the implementation of the concepts and applying it in the real world for practical purposes. By following the labs the students is teaching self and thereby training himself as a potential educator. By hands on
learning web interface gives the student a great platform to practice and perfect the practical application of the fundamentals they are learning.
12
Chapter 3. Development of Underlying Systems
The interactive learning system for Google Maps API is based on a production system created in the field of GIS and remote sensing. The title of the system is „Gulf of Mexico Coastal Geospatial Information Support System (CGISS)‟ [7].
3.1 Scope of the project
The aim of this underlying system is to acquire satellite imagery data from a wide variety of sensors and characteristics coupled with ancillary geospatial data in a GIS environment to build an integrated on- line Coastal Geospatial Information Support System (CGISS) that will allow the user to identify and visualize critical information related to a wide variety of issues, such as urbanization, development, natural resources, socio-economic, demographic, land use, and environmental issues affecting coastal areas along the Gulf of Mexico covering the State of Louisiana, Mississippi, Alabama (Figure 2). Four rapidly urbanizing coastal parishes in
13
Figure 2 Costal areas of Southeast Louisiana, Mississippi, Alabama, and West Central Florida (Source: Lodhi, M.A 2010. Unpublished work)
The Coastal Geospatial Information Support System (CGISS) has two main objectives: (1) educating the general public on how GIS and satellite imagery can be used for critical
information generation, gathering, and utilization to guide future plans on sustainable growth and development and (2) to serve as repository of geospatial data for a coastal areas along the Gulf of Mexico.
3.3. The Google Maps API Technology
The integral part of above project is a GeoTool, which is created using the Google Maps APIs. The GeoTool implements various GIS functionalities provided by Google Map spatial server.
3.3.1 Overview of Google Maps API
Google Maps provides a highly responsive, intuitive mapping interface with embedded, detailed street and aerial imagery data. In addition, map controls can be embedded in t he product
Louisiana
Mississippi
14
to give users full control over map navigation and the display of street and imagery data. Users can also perform map panning through the use of the “arrow” keys on a keyboard, as well as by dragging the map via the mouse. All of these capabilities combine to provide a compelling product, but the primary driver behind its rapid acceptance as an Internet mapping viewer is its ability to customize the map to fit application-specific needs. For instance, a real estate agency might develop a Web-based application that allows end user searching for residential properties to display the results on a Google Maps application.
To develop Google Maps applications one has to sign up for an API key and acquire a unique key for each directory that will serve Google Maps. The Google Maps server generates a unique key code for each URL specified by the developer. This key code must be used in each script that accesses the Google Maps API.
Google also provides documentation for its product, including full documentation of the classes, methods and events available for the Google Maps objects as well as code examples to help developer. In addition, Google provides a blog and discussion group for additional
information on using the API.
In addition to the API key, Google will also generate an example Web page centered on the Palo Alto area (in the vicinity of the Google headquarters). Typically, a developer would copy-paste the example HTML and JavaScript into a plain text file, save it to the Web server directory, and then displays the map in the clients Web browser.
15
read XML files. In the Figure 3 below you‟ll see examples of commonly used objects in the Google Maps API as shown.
3.3.2 Main components of Google Maps
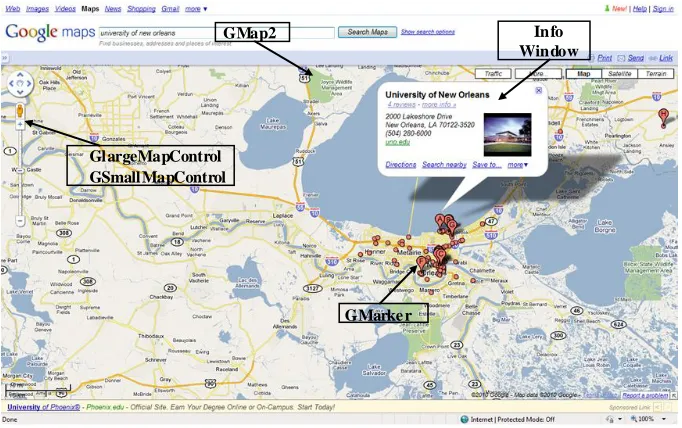
Figure 3 Basic elements of Google Maps
GMap: The GMap class is for creating map instances. A developer can create as many map instances as needed for the application, however commonly only a single map is used in each application. Maps are typically embedded within an HTML container called a tag. Once an instance of GMap is generated, various methods and properties are available on this object for manipulation of other aspects of the map such as displaying points of interest or polygons. Everything in Google Maps flows through an instance of the GMap class.
GMap2
GMarke r GlargeMapControl
GSmallMapControl
16
Figure 4 Map instance of GMap class
GMap can also respond to a whole host of events. Events are external stimulus to the map triggered by the user. Typical events might include the user dragging the map or clicking the map, an overlay marker being added to the map, or the map type changing from regular to aerial. The developer can write code that responds to any events. For instance, a marker at the point where the user clicks the map can be added. In another example, the latitude, longitude coordinates of the center of a map is displayed after a pan event occurs.
Map Controls: Google Map Controls allow the end user to zoom- in or zoom-out, to pan and to toggle the map type between Map, Aerial image and Hybrid. Each of these controls can be programmatically added to a map through the addControl method of the object GMap. For instance, the following code example would be used to add the small map control to a map as shown in the Figure below.
17
Figure 5 Control elements in a map
In addition, one can add an instance of the map type control to a map through the following code example:
map.addControl(new GMapTypeControl());
The map type control can be programmatically added to a map alongside a navigation control. For example we can add an instance of LargeMapControl and MapTypeControl to a map.
map.addControl(new GLargeMapControl()); map.addControl(new GMapTypeControl());
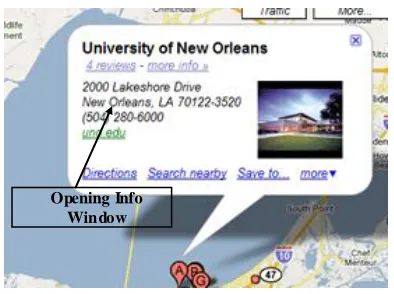
Opening Info Windows:Info Windows is a pop- up to display information about a particular point of interest and is typically opened just above a marker. Info Windows are opened via the openInfoWindow() method on an instance of GMap. Normally, Info Windows are used to hold HTML information such as text, links and images.
18
Figure 6 Opening info window in a map
Gmarker / GPoint: GPoint and GMarker are used in conjunction to create point markers that can be plotted on a Google Map. An instance of GPoint represents a single, two-dimensional
coordinate, whereas GMarker is a type of map overlay that shows an icon at an instance of GPoint.
GPoint (-96.4523, 30.5356)
Figure 7 Gpoint
Gpolyline: GPolyline uses two or more instances of GPoint to create a vector line between the two points. The vector lines generated by GPolyline can be created in various colors, weights, and transparency.
Figure 8 Gpolyline
19
Google Maps Polygons: At this time, the Google Maps API does not provide the ability to generate true polygons, but I suspect that this will change in the near future as the API becomes more robust. However, a third-party developer, XMaps, provides this functionality in its XMaps Library, which is a Google Maps API Extension. This library is in pre-release and can be
downloaded from their site.
Map Overlays: A map overlay refers to a point or polyline that is added on top of a map. Points (GPoint) are the most common type of overlay and are referred to as markers (GMarker). Polylines (GPolyline) composed of two or more points joined together by a vector line, can also be added to a map.
Reading XML Files: The Google Maps API also includes the ability to download, open and read XML files through the inclusion of the GXmlHttp class that creates a cross-browser
XmlHttpRequest instance. The importance of this ability frequently comes into play when it becomes necessary to read in multiple points of interest. The points of interest along with the coordinates that locate those points can be stored in an XML file. An XML file can also be generated from the database that hosts the points of interests.
3.4 Development of CGISS using the Google Maps API
20
3.4.1 CGISS Web Application Features
By using Google Maps API the following GeoTool components are created for CGISS
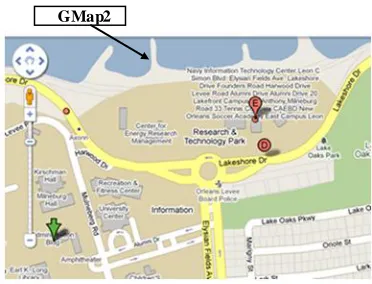
Normal map viewer: By clicking on Normal button displays the default Google street map layer. This is a default map layer provided by Google Map server.
Figure 9 Snapshot of GeoTool showing normal map
Satellite map viewer: Satellite map viewer provides the aerial satellite photo of a particular region.
21
Figure 10 Snapshot of GeoTool showing Satellite map
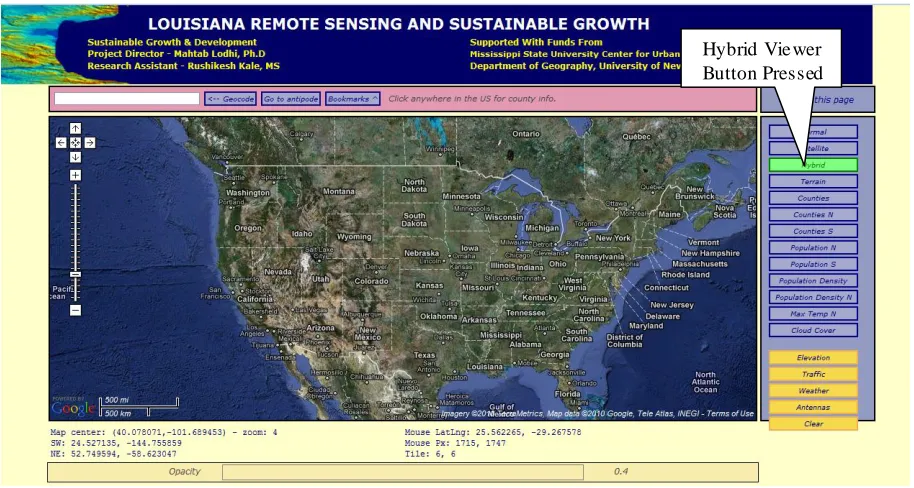
Hybrid map viewer: Google Maps provide a hybrid view, which overlays street names on satellite photos, for an easier way to identify what's what from the aerial views.
Figure 11 Snapshot of GeoTool page showing Hybrid map
Hybrid Vie wer Button Pressed
22
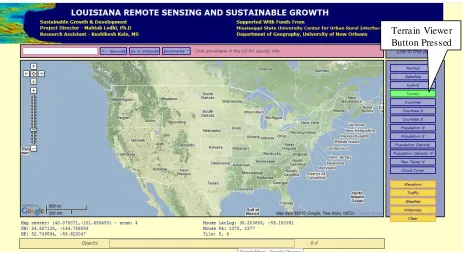
Terrain Map Viewer: Clicking on terrain map viewer button, will bring up a map showing geographical terrain. If you zoom in on a hilly or mountainous area, you'll see a 3D approximation of the terrain. If you zoom in on a major city like New York, you'll see 3D renderings of buildings.
Figure 12 Snapshot of GeoTool page showing Terrain map
Geocode search box tool: The Geocode search box also provides the address locator application. By entering an address of particular location in this search box, we can fetch the map of that particular location.
23
Figure 13 Snapshot of GeoTool page showing address location of New Orleans
3.4.2 JavaScript Program Structure
CGISS is deployed in the University of New Orleans Web server. The advantages include powerful hardware and minimum maintenance cost. The consequence of this deployment is that no server side customization is possible. For example; Tomcat or a similar server engine cannot be installed. Therefore, the choices of technologies are limited. We developed the entire CGISS system using JavaScript, AJAX and the Google Maps API technology.
Google Maps API provides cross-browser JavaScript library providing AJAX and object inheritance functionality. To implement the functionality of it, we have to reference the
JavaScript library and include it in a Web page. Then appropriate code is provided in the Web page to use the functions in the library.
24
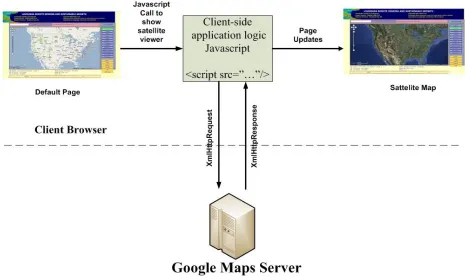
Figure 14 JavaScript Program Structure
The advantage of client side scripting is users don‟t need to provide a server-side component. It can perform better than a server-side mashup because a service request and response go directly from the browser to the Google Map server and back. It can reduce processing load on the server because a service request and response is not passed through a server-side proxy. Developer doesn‟t need a custom plug- in to implement the approach. The client side scripting structure has some constraints. For example, browsers which allow only two or three XMLHttpRequests to execute concurrently can exhibit limited performance.
3.4.3. CGISS Programming Structure
25
a client side method which in turn calls the Google map API to display the result of the
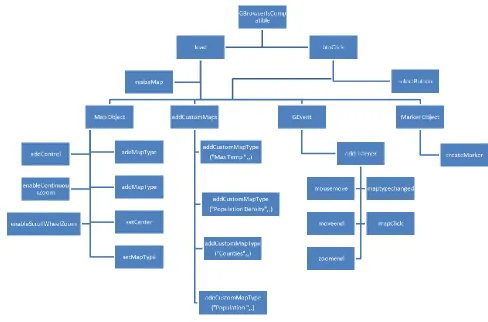
corresponding user action. All the function calls can be summarized in the form a function tree as shown Figure 15.
Figure 15 Function Tree Structure
26
the Web page response to the user action. The following section explains the initial process of loading the Web page. When the page is rendered to the client browser, the first function to execute is the load function. This is achieved by the following code:
window.onload = load;
The above line is located in the script tag of the html for the Web page. It tells the browser to call the load function when the window loads the Web page. The purpose of the load function is to initialize all the global variables on the Web page. It also sets the initial layout of the Web page. The code that creates an instance of the map is shown below:
map = new GMap2(container, draggableCursor:"crosshair"});
An instance of map is stored in the object called map. This object can be used to calll different methods available on the map object and set properties of the map object. After the map is initialized, the code to add various controls on the page executes. The code is shown below:
map.addControl(new GScaleControl());
The above code calls the addControl method on the map object and adds the scale control to the map. Once the code is done adding various controls on the page, it adds event listeners for the various controls as shown below:
GEvent.addListener(map, "zoomend", zoomEnd);
27
Here is the list of GEvents used to perform actions on a map (Gmap2) objects:
Event Object Parameters
"addmaptype" GMap2, GMap map type
"addoverlay" GMap2, GMap Overlay
"clearoverlays" GMap2, GMap -
"click" GMap2, GMap overly, latlng, overlaylatlng
"dblclick" GMap2, GMap the first parameter is always null
The second parameter is the GLatLng
"load" GMap2, GMap -
"maptypechanged" GMap2, GMap -
"moveend" GMap2, GMap -
"mousemove" GMap2, GMap GlatLng
"mouseout" GMap2, GMap GlatLng
"mouseover" GMap2, GMap GlatLng
"removemaptype" GMap2, GMap map type "removeoverlay" GMap2, GMap Overlay
"resize" GMap2, GMap -
"zoomend" GMap2, GMap old zoom level, new zoom level
"zoomstart" GMap2, GMap direction (+1 = zoom in, -1 = zoom out)
latlng pivot bool recentering
"zoom" Gmap old zoom level, new zoom level (v1 syntax)
"click" GMarker latlng (Latitude Longitude) of marker
"mousedown" GMarker latlng of marker
"mouseover" GMarker latlng of marker
"mouseout" GMarker latlng of marker
"mouseup" GMarker latlng of marker
Table 1 List of Google Map API GEvents
The detailed list of “GEvent” can be found in Google Map Tutorial [14]. Thus if we want to capture the action of user clicking on the map and execute some code when the event occurs, then we would write the following code:
28
The mapClick function can implement functionality such as displaying the information of the place on map that was clicked onto and it could display this useful information to the user inside a small pop-up by calling another set of functions and so on. Thus by implementing client side event handling model and use of functions and objects provided by the Google Maps API the production system can be developed. The client side model provides a very flexible
architecture and features can be added to the Web page with great ease. The biggest advantage is the absence of the time consuming task of compiling the code. All the browsers come with a basic level of support for client side scripting language such as javascript thus requiring no need of particular code development platform and tool to be installed on the development machine. All that is required is a text editor such as notepad to type the code and design the layout of the page using HTML and a browser such as internet explorer which is already installed on the PC machine, to see the outcome.
29
Chapter 4. Development of Hands-on Interactive Learning System
for Google Maps API
4.1 Interface design
The learning interface is an important concept that defines the configuration to support each learning activity. The learning interface should consist of the following elements:
1) Tutorial Web site. 2) Lab exercises. 3) Lab instruction. 4) Instruction manual. 5) Preview area.
6) Functionality mapping area.
7) Decomposition of the system is prepared and presented to the students as subsystems, components and objects; each has its functionality specification and user guide. 8) The specifications of interfaces between the components and objects.
9) A set of intuitive user interfaces that allow students to interact with the components or objects.
30
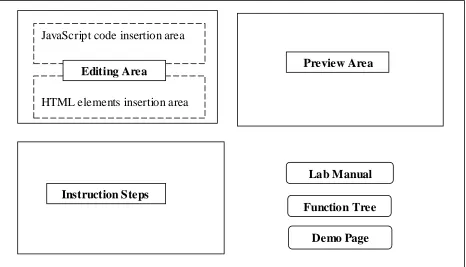
Figure 16 Hands-on Interactive Learning Model Interface
The learning interface consists of five components, namely Editing Area, Preview Area, Instruction Steps, Function Tree and Lab Manual as shown in Figure 17.
Lab Manual
Function Tree
Demo Page
JavaScript code insertion area
HTML elements insertion area
Editing Area Preview Area
Instruction Steps
31
Editing Area: This area allows user to enter a fragment of program which is required for achieving a certain goal of the given experiment. It consists of the following two parts:
1) JavaScript function code insertion area 2) HTML code insertion area
Preview Area: This area displays the preview of the results which will be generated after following all the instruction steps correctly.
Instruction Steps: A step-by-step instruction along with the code used to guide the student in his/her performance of the lab operations.
Function Tree: This button produces a function tree map, which displays the functions that are used in the lab work, as well as the relationships between these functions.
Lab Manual: The lab manual contains the description of lab instructions. It contains screenshots for each instruction step.
Demo Page: This is the fully functional page containing page template and source code for each lab.
4.2 Learning labs
Following the interface design described in section 4.1, a set of interactive online learning laboratory software products have been developed. An interactive online learning lab provides the procedure and guidance for the student to implement various GIS functionality using the Google Maps API. Each lab covers a single functionality implementation. The running environment, external components and the dep loyment process are hidden from the student. Through hands-on excercises reinforced by multiple labs, the student will learn the common procedure of applying Google Maps API shown below.
32 2. Leave argument box of initialize function blank 3. Enter following code in the SCRIPT textarea
if(document.getElementById("map_canvas")){ if (GBrowserIsCompatible()) {
var map = new GMap2(document.getElementById('map_canvas')); map.setCenter(new GLatLng(40.730885,-73.997383), 15);
var myLayer = new GLayer('org.wikipedia.en'); map.addOverlay(myLayer);
} }
4. Click on Add Script button to add the initialize function 5. Add map Div element in Input (HTML) textarea as follows:
<div id='map_canvas' style='width: 500px; height: 500px'></div>
6. Click on a Show Preview tab
7. To get function trace click on "Show Function Tree" button 8. By this you verify functions of "how to load a map"
4.2.1 Description of Lab 1
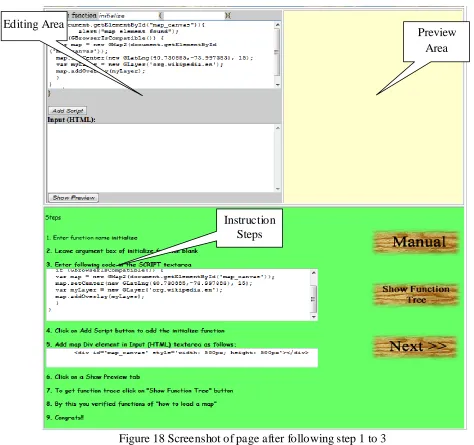
Lab 1 covers how to display basic map layers using Google Maps API. Step 1 to 3: Steps 1 to 3 are to create the „initialize ( )‟ function.
33
Figure 18 Screenshot of page after following step 1 to 3 Initialization of the map object is done using the following code:
map.setCenter(new GLatLng(40.730885,-73.997383), 15);
GLayer objects are overlay objects that store a set of geographic information. Layers are sets of geographically- related features that share some common function, and are displayed on a map as a group. Google provides these sets from data obtained from various sources, and bundles them together within a single layer.
Preview Area Editing Area
34
The following code snippet overlays an English Wikipedia layer („org.wikipedia.en‟) to a Gmap2 object (“map”).
var myLayer = new GLayer('org.wikipedia.en'); map.addOverlay(myLayer);
For Lab 1, the code for a working “initialize” function is given in the instruction window as shown below.
function initialize ( ) {
if(document.getElementById("map_canvas")){ if (GBrowserIsCompatible()) {
var map = new GMap2(document.getElementById('map_canvas')); map.setCenter(new GLatLng(40.730885,-73.997383), 15);
var myLayer = new GLayer('org.wikipedia.en'); map.addOverlay(myLayer);
} } }
35
Figure 19 Screenshot of page after following step 4
Step 5: Step 5 is used to add Map DOM elements. For the map to display on a Web page, we must reserve a spot for it. Commonly, we do this by creating a named div element and obtaining a reference to this element in the browser's document object model (DOM) shown in Figure 20.
<div id='map_canvas' style='width: 500px; height: 300px'></div>
36
Figure 20 Screenshot of page after following step 5
Unless we specify a size explicitly for the map using GmapOptions in the constructor, the map implicitly uses the size of the container to size itself.
37
Figure 21 Screenshot of page after following step 6
38
Figure 22 Screenshot of page after following step 7 Step 8: This step notifies the students of the completion of Lab 1.
4.2.2 Description of Lab 2
39
40
For a Lab 2, the code of a “showMaxZoom” function is given in the instruction window as shown below.
function showMaxZoom (latlng) {
G_SATELLITE_MAP.getMaxZoomAtLatLng(latlng, function(response) { if (response && response['status'] == G_GEO_SUCCESS) {
alert("The maximum zoom level where satellite imagery is available at this location is: " + response['zoom']);
} }); }
In this script an instance of a G_SATELLITE_MAP object invoke the getMaxZoomAtLatLng function, which is responsible for adding Zoom-In, Zoom-out pan.
Step 5 to 7: Steps 5 to 7 are to create the “initialize”
For a Lab 2, the code of a working “initialize” function is as shown below.
function initialize ( ) {
if (GBrowserIsCompatible()) {
map = new GMap2(document.getElementById("map_canvas")); map.setCenter(new GLatLng(55.366625,-131.660156), 7); map.setMapType(G_SATELLITE_MAP);
map.setUIToDefault();
GEvent.addListener(map, 'click', function(overlay, latlng) { showMaxZoom(latlng);
}); }
}
The difference between the “initialize” function of Lab2 and Lab 1 is the Lab2 “initialize” function calls the “showMaxZoom (latlng)” function which gets added after the execution of Steps 1 through 4.
It also adds map type parameter as G_SATELLITE_MAP instead of default map type to display a Satellite map using following code:
map.setMapType(G_SATELLITE_MAP);
41
4.2.3 Description of Lab 3
The Lab 3 covers, how to implement a customized Normal button to show Normal Street map using Google Maps API.
Figure 24 Snapshot of final result for lab 3 of adding Normal map viewer button Lab 3 is created for instructing the student on how we can implement the Normal map viewer button using the Google Maps API. It uses the same mechanism which is used in implementation of Normal button in actual production system Web (CGISS) [7].
Step 1 to 4: Steps 1 to 4 are to create the “selectButton” function which takes btnID as a
parameter. For a Lab 3, the code of a “selectButton” function is given in the instruction window as shown below.
42
{
var bDiv = document.getElementById("mapButtons");
for (var n = 0; n < bDiv.childNodes.length ; n++ ) { bDiv.childNodes[n].className = 'button';
}
if (btnID) {
var bDiv = document.getElementById(btnID); bDiv.className = 'selectedButton';
} }
This function is responsible for adding the “Normal” mapButton to the script. Step 5 to 7: Steps 5 to 7 are to create the “btnClick” function
function btnClick (btnID)
{
selectButton(btnID);
map.setMapType(customMaps[value]); }
This functions calls the “selectButton” function created in previous steps and the set map type using setMapType function of map object instance.
Step 8 to 10: Steps 8 to 10 are to create the “initialize”
For a Lab 3, the code of a working “initialize” function is as shown below.
function initialize ( ) {
customMaps[customMaps.length] = G_NORMAL_MAP; customMaps[customMaps.length] = G_SATELLITE_MAP; customMaps[customMaps.length] = G_HYBRID_MAP; if (GBrowserIsCompatible()) {
map = new GMap2(document.getElementById("mapDiv")); map.setCenter(new GLatLng(37.441944, -122.141944), 13); map.setMapType(G_SATELLITE_MAP);
} }
43
Div element has a unique id to differenciate them from other Div elements present on a same Web page.
Step 11: In addition to Div element with id “mapDiv”, this step adds some more HTML elements as shown below.
<center>
<table cellspacing="0" cellpadding="0" width="90%"> <tr> <td valign="top" align="left">
<div id="mapFrame" class="mapFrame">
<table cellspacing="0" cellpadding="0" width="100%"> <tr> <td>
<div id="mapDiv" style="width:500px;height:550px;"></div> </td></tr>
</table> </div> </td>
<td valign="top" width="200">
<div class="buttonsFrame" id="rightCol" > <div class="buttons" id="mapButtons"> <div class="selectedButton" id="btn_0" onclick="btnClick('btn_0',0);">Normal</div> </div> </div> </td> </tr> </table> </center>
This code adds a number of div elements for placement of different element namely “mapButtons” to place a “Normal” button and “mapDiv” element to display map.
4.3 Other learning lab features
The lab has a series of helper functions that are responsible for guiding the user and driving the code behind the scene.
4.3.1 Creation and injection of functions
44
name and code, the createMyFunction helper function is responsible for instantiating the code in memory as an actual function. This happens when the user clicks on Add script button.
Figure 25 How functions gets created and injected in the call tree
45
Function Name Function Description
addScript() This is the helper function that is responsible for injecting
the html script in the preview area.
createMyFunction() This is the helper function is responsible for injecting the
user code as a function in the function tree.
preview() This is the helper function that is responsible for displaying
the output of each step completed by the user.
RprintStack() This function constructs the function tree used for display.
output(arr) This function displays the function tree.
toggle() This function shows and hides the function tree.
printDesc(funct_name) This function manages the displaying of the function
descriptions in the function tree.
Table 2 Helper Functions
4.3.2 Lab Specific Subset of Function Tree
46
Figure 26 Function tree driven by helper function
47
Chapter 5. User Feedback
The three labs described in Chapter 4 are for learning at gradually increasing difficulty levels. Lab 1 is designed to teach student how to insert a basic Google map on a Web. It contains only the basic functions required for loading a map and defining the height and width of the map display area. Lab 2 is designed to teach student how to add zooming function to maps. Lab 3 is to teach student how to add the Normal Map Viewer, a more advanced function of the Google Maps API.
48
Figure 27 Survey Questionnaire
49
For example, a total of 12 CS department students from freshman year replied but only 10 of these responses were randomly picked. The results were calculated using automated tools of survey generation software [8].
Figure 28 Survey result for question1
5.1 Efficiency of learning GIS
As shown in Figure 28, for Computer Science majors, the percentage of the students who think that, the three interactive tutorials are an efficient technique to learn fundamentals of GIS are 60%, 60%, 70%, 80% and 90% for freshmen, sophomore, junior, senior and graduate respectively. The acceptance rates increases by 30% along with seniority. For non computer science majors, the percentages of the students‟ positive answer to the same question are 50%, 60%, 60%, 70% and 70% for freshmen, sophomore, junior, senior and graduate respectively. The
6 6 7 8 9 5 6 6 7 7 0 1 2 3 4 5 6 7 8 9 10
Freshman Sophomore Junior Senior Graduate
N um be r of S tude nt s w ho sa id Y e s
Focus Group By Education Level
Do you think, this is an efficient technique to
learn fundamentals of GIS?
50
acceptance rates increases by 20% along with seniority. An interpretation of this phenomenon is that the CS students have developed more capability to learn outside world such as GIS
application which is nearly ubiquitous. For non-CS students, a similar trend is observed, but the increase in percentage is relatively less compared to the CS students. An explanation of this difference is that the tutorials focus on programming a lot. CS students obviously have an advantage over the non-CS students.
Figure 29 Survey result for question 2
5.2 Efficiency of learning Google Maps API
As shown in Figure 29, For Computer Science majors, the percentage of the students who think that, the three tutorials are an efficient technique to learn Google Maps API are 50%, 50%, 60%, 70% and 80% for freshmen, sophomore, junior, senior and graduate respectively. The
5 5
6
7
8
2
3 3 3
4 0 1 2 3 4 5 6 7 8 9 10
Freshman Sophomore Junior Senior Graduate
N um be r of S tude nt s w ho sa id Y e s
Do you think, this is an efficient technique to
learn GoogleMap API?
51
acceptance rates increases by 30% along with seniority. For non computer science majors, the percentage of the students who agreed on the same question are 20%, 30%, 30%, 30% and 40% for freshmen, sophomore, junior, senior and graduate respectively. The acceptance rates
increases by 20% along with seniority. The Google Maps API is a specific programming technique. The three tutorials have guided the students to deal with specific code fragments. A big difference in the feedback from the CS and non-CS students is expected. It seems the tutorial did not bore the CS students away.
Figure 30 Survey result for question 3
5.3 Difficulty of the exercises
As shown in Figure 30, for Computer Science majors, the percentage of the students who think that the given exercises were difficult to perform are 20%, 10%, 10%, 0% and 0% for freshmen, sophomore, junior, senior and graduate respectively. The acceptance rates increases by 20% along with seniority. For the non-CS majors, the percentage of the students who think that the given exercises were difficult to perform are 30%, 30%, 20%, 20% and 10% for freshmen, sophomore, junior, senior and graduate respectively. An interpretation of this phenomeno n is that
2 1 1 0 0 3 3 2 2 1 0 2 4 6 8 10
Freshman Sophomore Junior Senior Graduate
N um be r of S tude nt s w ho sa id Y e s
Did you find any difficulty performing this
exercise?
52
the non-CS students finds online lab exercises little difficult to solve. The acceptance rates increases by 20% along with seniority.
An observation of the data is that both CS as well as non-CS students didn‟t find much difficulty to perform the lab exercises. Almost all CS students find given exercise easy to understand. For non-CS students, a similar trend is observed, but the increase in percentage is less compared to the CS majors. An explanation of this trend is that while performing online exercises cs students have an advantage over the non-cs students.
Figure 31 Survey result for question 4
5.4 Helpful Manual
As shown in Figure 31, for Computer Science majors, the percentage of the students who think that the user manual for given lab helpful to understand this tutorial are 70%, 70%, 80%,
7 7 8 9 9 5 6 7 8 9 0 1 2 3 4 5 6 7 8 9 10
Freshman Sophomore Junior Senior Graduate
N um be r of S tud e nt
Does Manual for given lab help you to
understand this tutorial completely?
53
90% and 90% for freshmen, sophomore, junior, senior and graduate respectively. The acceptance rates increases by 20% along with seniority. For non computer science majors, the percentage of the students who greed on the same question are 50%, 60%, 70%, 80% and 90% for freshmen, sophomore, junior, senior and graduate respectively. The acceptance rates increases by 40% along with seniority. Here we have observed a bigger seniority improvement in non-CS than that in CS majors. This is promising for us to develop interactive tools for non-CS majors.
Figure 32 Survey result for question 5
5.5 Time consuming
As shown in Figure 32, for Computer Science majors, the percentage of the students who finds the hands-on learning process time consuming are 30%, 30%, 20%, 20% and 10% for freshmen, sophomore, junior, senior and graduate respectively. The acceptance rates increases by 30% along with seniority. For non-CS majors, the percentage of the students who feels the learning process time consuming are 40%, 30%, 20%, 10% and 10% for freshmen, sophomore, junior, senior and graduate respectively. The acceptance rates increases by 20% along with
3 3 2 2 1 4 3 2 1 1 0 1 2 3 4 5 6 7 8 9 10
Freshman Sophomore Junior Senior Graduate
N um be r of S tude nt s w ho sa id Y e
s
Did you find the verification process time
consuming?
54
seniority. This was a good news for the interactive learning process that the majority of neither CS nor non-CS students find the process time consuming.
Figure 33 Survey result for question 6
5.6 Attitude to Web page design
As shown in Figure 33, for Computer Science majors, the percentage of the students who think that Web page design is user friendly are 90%, 80%, 90%, 80% and 90% for freshmen, sophomore, junior, senior and graduate respectively. The acceptance rates increases by 0% along with seniority. For non computer science majors, the percentage of the students who think that Web page design is user friendly are 60%, 60%, 70%, 70% and 90% for freshmen, sophomore, junior, senior and graduate respectively. The acceptance rates increases by 30% along with seniority. It has been widely accepted that Web page design is a fun topic for most CS majors at all levels. It is encouraging to see high and increasing acceptance to Web page design from the non-CS students. 9 8 9 8 9 6 6 7 7 9 0 1 2 3 4 5 6 7 8 9 10
Freshman Sophomore Junior Senior Graduate
N um be r of S tude nt s w ho sa id Y e s
Was the webpage design user friendly?
CS
55
Figure 34 Survey result for question 7
5.7 Easier exercises
As seen from Figure 34, for Computer Science majors, the percentage of the students who think that online lab easier to complete than traditional classroom exercises are 80%, 90%, 100%, 90% and 90% for freshmen, sophomore, junior, senior and graduate respectively. The acceptance rates increases by 10% along with seniority. For non-CS majors, the percentage of the students who think that online lab easier to complete than traditional classroom exercises are 70%, 70%, 60%, 70% and 80% for freshmen, sophomore, junior, senior and graduate
respectively. The acceptance rates increases by 10% along with seniority. On this question, insignificant difference is observed in different seniority levels. Majority of all levels agree that the online interactive lab is easier.
0 2 4 6 8 10 12
Freshman Sophomore Junior Senior Graduate
N um be r of S tud e nt s w ho s ai d Y e s
Was, online lab easier to complete than
traditional classroom excersise?
CS
56
Figure 35 Survey result for question 8
5.8 To understand concept better
As shown from Figure 35, For Computer Science majors, the percentage of the students who think that the interactive online learning is better in helping to understand the concept better are 70%, 70%, 80%, 80% and 90% for freshmen, sophomore, junior, senior and graduate
respectively. The acceptance rates increases by 20% along with seniority. For non-CS majors, the percentage of the students agree on the same question are 70%, 70%, 60%, 70% and 80% for freshmen, sophomore, junior, senior and graduate respectively. The acceptance rates increases by 10% along with seniority.
5.9 Learning approaches preference
As shown in Figure 36 and Figure 37, both computer science and non computer science students like the interactive learning approach more than the traditional classroom teaching.
0 2 4 6 8 10
Freshman Sophomore Junior Senior Graduate
N um be r of S tude nt s w ho sa id Y e s
Compare to classroom learning did this
technique of teaching helps you understand the
concept better?
CS
57
Figure 36 Survey result for question 10 by CS student
Figure 37 Survey result for question 10 by non-CS students
0 1 2 3 4 5 6 7 8 9 10
Freshman Sophomore Junior Senior Graduate
Like Interactive Online Learning Technique
Like Traditional Classroom Teaching
Like Both 0 1 2 3 4 5 6 7 8 9 10
Freshman Sophomore Junior Senior Graduate
Like Interactive Online Learning Technique Like Traditional Classroom Teaching
58
59
Chapter 6. Discussions and Future Work
The online system supporting hands-on interactive learning of Google Maps API has proved to be an efficient technique to learn fundamentals of GIS and Google Maps API. The students of computer science found this technique more efficient than the non-CS students felt. Overall, the learning system had a favorable feedback from a group of students. The
implementation of the interactive hands-on approach has eased not only the CS students‟ but also non-CS students‟ learning of the highly specialized and involved Internet technology, the Google Maps API. Both the CS and non-CS students found the user manual user-friendly and helpful in understanding the lab and had no trouble in understanding the lab tutorials.
Compared to the exercises assigned in traditional classroom the online labs proved to be easier to complete for both the focus groups. Majority of students from both the focus groups liked the interactive hands-on approach to learning of Google Maps API and Web development concepts.
The number of students making a favorable answer in response to most questions such as learning efficiency, user friendliness and design of the interface increase along with the students‟ seniority. Regardless of their technical background, the students who were freshmen found the interface design and user friendliness aspect of the Web application more appealing. The higher age group of students found the conceptual aspect of the lab tutorials appealing.
60
References
[1] D. Janzen and H. Saledian, “Test-Driven Learning: intrinsic integration of testing into the CS/SE curriculum”, SIGCSE‟06, Houston, 254-258, March 2006.
[2] K. Beck, Test Driven Development: By Example, Addison-Wesley, 2003.
[3] E. M. Clarke, E. A. Emerson, and A.P. Sistla, “Automatic verification of finite-state concurrent systems using temporal logic specifications”, ACM Transactions on Programming Languages and Systems, 8(2), 244-263, April, 1986.
[4] C. Schulte and J. Bennedsen, “What do teachers teach in introductory programming?”, ICER‟06, 17-28, September, 2006.
[5] S. Yardi and A. Bruckman, ICER‟07, 39-49, September, 2007. [6] Mapping Success: Google Maps Case Studies,
http://maps.google.com/help/maps/casestudies/
[7] CGISS, http://www.gis.uno.edu
[8] Interactive Hands-on Learning System Assessment Student Questionaire, http://vcrlsvcs.cs.uno.edu/learngooglemap/survey.html
[9] L. Cassel, et al, “Computer science curriculum 2008” ACM and IEEE Computer Society, http://www.acm.org//education/curricula/Comp uterScience2008.pdf
[10] Kang-tsung Chang, Introduction to Geographic Information System, McGraw Hill, 4th Edition.
[11] XML DOM Tutorial, http://www.w3schools.com/dom/dom_attribute.asp [12] HTML Reference, http://www.w3schools.com/tags/tag_div.asp
61
[15] Lodhi, M. A. 2009. Smart Growth and Sustainable Development Education Project for St. Tammany, St. John the Baptist, Tangipahoa, and Washington parishes of Southeast Louisiana. Department of Geography, University of New Orleans, Louisiana.
62