Downloaded from
http://journals.tums.ac.ir/
on Tuesday, August 14, 2012
Original Article
Evaluation of Attenuation Correction Process in Cardiac SPECT Images
Maryam Naji, (MSc)
1; Seyed Rasoul Zakavi, (MD)
2;
Mohsen Hajizadeh, (PhD)
3; Mehdi Momennezhad (PhD)
21
Department of Radiation Oncology, Ghaem Hospital,
2Department of Nuclear Medicine, Imam Reza
Hospital,
3Department of Medical Physics, Mashhad University of Medical Sciences, Mashhad, Iran.
(Received 21 August 2008, Revised 9 September 2008, Accepted 19 September 2008)
ABSTRACT
Introduction: Attenuation correction is a useful process for improving myocardial perfusion SPECT and is dependent on activity and distribution of attenuation coefficients in the body (attenuation map). Attenuation artifacts are a common problem in myocardial perfusion SPECT. The aim of this study was to compare the effect of attenuation correction using different attenuation maps and different activities in a specially designed heart phantom.
Methods: The SPECT imaging for different activities and different body contours were performed by a phantom using tissue-equivalent boluses for making different thicknesses. The activity was ranged from 0.3-2mCi and the images were acquired in 180 degree, 32 steps. The images were reconstructed by OSEM method in a PC computer using Matlab software. Attenuation map were derived from CT images of the phantom. Two quality and quantity indices, derived from universal image quality index have been used to investigate the effect of attenuation correction in each SPECT image.
Results: The result of our measurements showed that the quantity index of corrected image was in the range of 3.5 to 5.2 for minimum and maximum tissue thickness and was independent of activity. Comparing attenuation corrected and uncorrected images, the quality index of corrected image improved by increasing body thickness and decreasing activity of the voxels.
Conclusion: Attenuation correction was more effective for images with low activity or phantoms with more thickness. In our study, the location of the pixel relative to the associated attenuator tissues was another important factor in attenuation correction. The more accurate the registration process (attenuation map and SPECT) the better the result of attenuation correction.
Key Words: Attenuation correction, Myocardial perfusion, SPECT
Iran J Nucl Med 2008; 16(2): 1-7
Corresponding author: Maryam Naji Meidani, Department of Radiation Oncology, Ghaem Hospital, Mashhad University of Medical Sciences, Mashhad, Iran
Downloaded from
http://journals.tums.ac.ir/
on Tuesday, August 14, 2012
Ir
an J Nucl Me
d
20
08, Vo
l
16
, No
2 (Ser
ial No
3
0
)
2
INTRODUCTION
Single Photon Emission Computed Tomography (SPECT) is a powerful technique in today's nuclear medicine. SPECT images represent physiologic processes and with increasing interest on quantitative analysis, the attenuation correction becomes more important.
Photon attenuation is an inevitable physical phenomenon that influence diagnostic information and may result in errors in accuracy of quantitative measurements. Especially this effect is significant in regions of body that have inhomogeneous distribution of attenuation coefficient such as thorax. Myocardial perfusion SPECT is one of the most common procedures in nuclear medicine departments and attenuation by breast tissue in women may result in erroneous diagnosis of myocardial perfusion defect (1). Two broad classes of methods have been used to calculate the attenuation map: transmissionless and transmission-based attenuation correction techniques. Whereas calculated attenuation correction belonging to the first class of methods may be appropriate for brain studies, more sophisticated methods must be used in clinical applications, where the attenuation coefficient distribution is not known a priori, and for areas of inhomogeneous attenuation such as the chest. Measured attenuation correction overcomes this problem and uses different approaches to determine this map, including transmission scanning, segmented magnetic resonance images, or appropriately scaled CT scans (1).
The aim of this study was to investigate the effect of attenuation correction using CT attenuation map for SPECT images in a specially designed heart phantom. We used different boluses of breast tissue from Rando phantom for evaluation of the effect of different sizes of breast. Also two boluses of tissue-equivalent pads were used for mimicking two different thicknesses of chest wall.
METHODS
Phantom
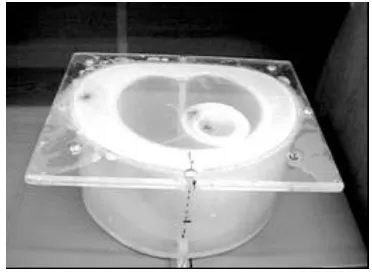
A heart phantom was made on the basis of heart SPECT phantom of PTW. This phantom consists of 4 cylindrical containers that represent soft tissue of body contour, chest wall, left ventricle and blood in heart. Soft tissue and inner part of heart was filled by water and heart wall was filled by radioactive solution (Figure 1).
Figure 1: Heart and chest wall phantom.
Imaging
Nuclear medicine imaging was performed by a dual head e.cam gamma camera (Siemens) and CT scans were acquired by a CT scanner model SOMATOM Balance (Siemens).
Downloaded from
http://journals.tums.ac.ir/
on Tuesday, August 14, 2012
Ir
an J Nucl Me
d 20 08, Vo l 16 , No 2 (Ser ial No 3 0 )
3
different thicknesses of bolus pads (f1=1, f2= 2.1 cm). Imaging was done for all sets of attenuators.
Image reconstruction
Image reconstruction was done by OSEM method. The basis of this method and its origin MLEM is to maximize the ratio of the calculated projection of images to measured projections. In successive iterations the reconstructed image becomes more and more similar to expected image. In this reconstruction method, photon emission and detection were assumed to have poison distribution. The image acquisition is physically modeled and named system matrix. In the other words the system matrix produce calculated projections. Finally the reconstruction is done by the formula [1]:
( ) ( )
∑
∑
∑
== =
+ = N
i M j n j ij i ij N i ij n j n j f a g a a f f 1 1 ' ' ' 1 1 [1]
In this formula, fj( )n is the activity of pixel in nth iteration, is the measurement in
detector , is the component of
system matrix that is probability of emission of pixel is detected in detector.
Raw data were transferred to a PC and OSEM reconstruction was done by Matlab software. 32 projections was grouped in 4 sets of 8 projections as follows: projections 1, 5, …, 29 was considered as group one and 2, 6, …,30 , group 2 and so on. Rectangular cross section model was used for emission system matrix [2]. In this model we assume that the probability of detection of emitted photon from pixel j in detector i is proportional to the cross section area of pixel j and detector i view.
Determination of attenuation map
There are different techniques for determination of attenuation map. For example Celler, et al used multiple line source array for transmission scans in
cardiac imaging and concluded that this method can be used in simultaneous transmission/emission imaging to generate accurate attenuation maps (3). Wallis, et al used 99mTc macroaggregated albumin to determine the lung contour by means of different energy window levels (4).
Calculating the attenuation map by using CT images is one of the most precise methods for determination of attenuation map (5). This method was applied in heart (6), brain (7) and lung (8) SPECT images and its efficiency was proved.
In this study CT scans were performed using CT scanner model SOMATOM Balance with 130kVp and 60mAs. For registration of SPECT and CT images, we use 2 tubes as markers. These markers filled by water in CT images and with radioactive solution in SPECT images.
First we registered CT images on SPECT images using the markers. The acquisition matrix was 64 × 64 in SPECT and 256 × 256 in CT scans, so matrix transform was done for CT images. Also the fields of views were not equal in two imaging modalities. We rescaled the CT images to the same field of view as SPECT. Then spatial transform function that transform CT image to SPECT image was calculated. In this calculation we assumed that the CT image could have a little rotation or translation with respect to SPECT image.
In the second step CT numbers were converted to linear attenuation coefficients for the photons emitted by the radionuclide using calibration curve of Larsson (9). This curve illustrated the linear attenuation coefficients for 140 keV photons of Tc-99m vs. Hounsfield numbers in 120 keV X-rays.
Attenuation correction
Downloaded from
http://journals.tums.ac.ir/
on Tuesday, August 14, 2012
Ir
an J Nucl Me
d
20
08, Vo
l
16
, No
2 (Ser
ial No
3
0
)
4
(A)
(B)
(C)
kth pixel in the path that seen by detector and so the attenuation of first to (k-1)th pixel are contributed in the photon attenuation plus the half of path length in pixel j itself.
[2]
The attenuated system matrix was calculated by formula [3]: the product of probability of detection and the attenuation.
ij ij
ij
csa
x
a
=
×
exp
μ
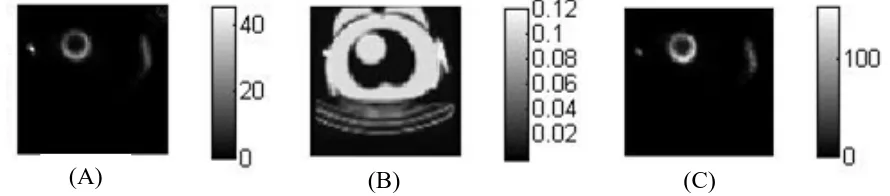
[3]Non-corrected image, attenuation map and corrected image of one of scans are shown in figure 2.
Image analysis
For qualitative evaluation, "reference image" was used for comparison. Because in clinical practices, left ventricle is segmented to six regions in mid ventricular slices, we also divide heart image to 6 segments. This work was done by determination of centers of two rings and polar coordinates of each pixel.
Quality of images was assessed using UIQI. This index compares the test image with a standard image that has high quality. More similarity of test image to standard image means the better quality (contrast) of test image (10). Ratio of this index for corrected and non-corrected images named quality factor (QL). Counts ratio of corrected and
non-corrected images used for quantitative evaluation. We named it quantity factor (QN).
RESULTS
Attenuation correction increased qualitative and quantitative factors so QN varied between 3.2 for phantom (minimum attenuation) and 5.2 for phantom with b2 and f2 (maximum attenuation) attenuators. The QL numbers were 10.2 and 19.4, respectively in these subjects. Variations of QL and QN with attenuation are illustrated in diagrams 1 and 2.
As expected attenuation correction was more effective in subjects with more attenuator tissue so that increasing the thickness of attenuator tissue was associated with increase in QL and QN factors as well. QL and QN factors were significantly higher for any attenuator tissue compared to phantom (P<0.001). However QL and QN were not significantly different between similar attenuators (b1 Vs b2, f1 Vs f2). Comparison between the effects of high and low activity was performed by dividing data in two groups: low activity (with 0.3 and 0.5 mCi of 99mTc) and high activity (with 1 and 2 mCi of 99mTc). Diagram 3 shows the variation of QL and QN with activity in heart and 6 regions.
Figure 2: Images of slice 32 of scan with 1mCi of heart activity, breast b1 and bolus f1. A: Non corrected image, B: Attenuation map, C: Attenuation corrected image.
⎟ ⎠ ⎞ ⎜
⎝
⎛ − −
=
∑
−= ( ) (, )2 1 )) ( , ( ) ( ( exp
) , (
exp 1
1 bul i b u j l i j
j i
x k
u μ μ
Downloaded from
http://journals.tums.ac.ir/
on Tuesday, August 14, 2012
Ir
an J Nucl Me
d
20
08, Vo
l
16
, No
2 (Ser
ial No
3
0
)
5
Diagram 1: Variations of QL (qualitative factor) with attenuation in different activities.
Downloaded from
http://journals.tums.ac.ir/
on Tuesday, August 14, 2012
Ir
an J Nuc
l Med
200
8
, Vo
l
16, No
2
(Se
rial No
30)
6
Diagram 3: Variation of QL and QN with activity in heart and it's 6 regions.
DISCUSSION
In our work, attenuation correction improves SPECT images qualitative and quantitatively. Results for high and low activity showed that QN value is independent of activity but QL value is decreased by increasing activity. Another point is that in each activity, QL and QN in regions 1 and 2 are higher. This result may be related to:
1- QL is dependent to activity and because of partial volume effect in regions 1 and 2, activity is lower. So QL in these regions becomes higher than other regions.
2- The closer the pixel to the attenuator tissue, the higher attenuation is expected. This may be explained by the fact that by increasing the distance, the probability of photon passing through the attenuator tissue in each projection is decreased (Figure 3). Suppose that the red circle is heart and the yellow ring is body contour. 16 lines around the body are 16 projections. We could see the emission of B is passed through heart (and attenuated) only at one projection. In comparison with A that 4 rays are passed through the heart. According to this effect, emissions from regions 1, 2
and 6 that are close to breast and body contour will have higher attenuation and consequently attenuation correction with result in higher QL and QN. This is why we see lung fields darker in patient's images when attenuation correction was done (5). Also classic attenuation artifacts include decreased anterior wall tracer uptake in women (due to breast attenuation) and decreased inferior wall uptake in men (due to diaphragmatic attenuation) (11). Therefore Attenuation correction is recommended in obese patients and/or when the injected activities are low. Full registration of CT and SPECT images are emphasized due to important role of attenuator tissue location in images (12, 13).
Downloaded from
http://journals.tums.ac.ir/
on Tuesday, August 14, 2012
Ir
an J Nucl Me
d
20
08, Vo
l
16
, No
2 (Ser
ial No
3
0
)
7
It seems that the idea of calculated and saved attenuation maps for different body sizes and styles is not practicable and reliable unless in each SPECT imaging the saved attenuation map is fully registered on SPECT image. Now we are working on this subject for further improvement.
CONCLUSION
We conclude that attenuation correction is more effective in poor count images or thick attenuators (i.e: Obese patients) and accurate image registration has great impact on attenuation correction.
AKNOWLEDGEMENT
This work is done with financial support of research vice chancellor of Mashhad University of Medical Sciences. We also appreciate the cooperation of staff of nuclear medicine department at Imam Reza hospital and staff of CT scan department of Emdadi hospital.
REFERENCES
1. Zaidi H, Hasegawa B. Attenuation correction
strategies in emission tomography. In: Zaidi H, editor. Quantitative analysis in nuclear medicine imaging. New York: Springer Science Business Media, Inc; 2006; 167-204.
2. Fessler J. Iterative methods for image
reconstruction. ISBI Tutorial. Arlington Virginia: April 2006.
3. Celler A, Sitek A, Stoub E, Hawman P, Harrop
R, Lyster D. Multiple line source array for SPECT transmission scans: simulation, phantom and patient studies. J Nucl Med 1998; 39 (12): 2183-2189.
4. Wallis J, Miller T, Koppel P. Attenuation
correction in cardiac SPECT without a transmission measurement. J Nucl Med 1995; 36 (3): 506-512.
5. Zaidi H, Hasegawa B. Determination of the
attenuation map in emission tomography. J Nucl
Med. 2003; 44(2) 291-315.
6. Kashiwagi T, Yutani K, Fukuchi M, Naruse H,
Iwasaki T, Yokozuka K et al. Correction of nonuniform attenuation and image fusion in
SPECT imaging by means of separate X-ray CT.
Ann Nucl Med 2002; 16(4):255-261.
7. Larsson A, Johansson L, Sundström T, Ahlström
KR. A method for attenuation and scatter correction of brain SPECT based on CT-images. Nucl Med Commun 2003, 24: 411-420.
8. Shiraishi S, Tomiguchi S, Utsunomiya D,
Kawanaka K, Awai K, Morishita S et al. Quantitative analysis and effect of attenuation correction on lymph node staging of non-small cell lung cancer on SPECT and CT. AJR Am J
Roentgenol 2006; 186:1450-1457.
9. Larson A. Corrections for improvement
quantitative accuracy in planar scintigraphy and
SPECT. PhD thesis. Ũmea university, Sweden;
2006.
10. Wang Z, Bovik A.C. A universal image quality
index. IEEE Signal Proc Let 2002; 9(3):81-84.
11. Araujo LI, Jimenez-Hoyuela JM, McClellan JR,
Lin E, Viggiano J, Alavi A. Improved uniformity in tomography myocardial perfusion imaging with attenuation correction and enhanced acquisition and processing. J Nucl Med 2000; 41(7): 1139-1144.
12. Hutton BF, Braun M, Thurfjell L, Lau DY.
Image registration: an essential tool for nuclear medicine. Eur J Nucl Med 2002; 29 (4):559-577.
13. Goetze S, Wahl RL. Prevalence of