A b s t r a c t. Systematic measurements of the water content at different depths below a continuous maize crop by the EASY TEST FOM soil moisture meter and their use for calibration of the SIMWASER simulation model are shortly described. The instrument provided reliable data and proved to be robust and simple to operate.
K e y w o r d s: soil water balance, maize, TDR moisture meter
INTRODUCTION
Simulation of water movement in agricultural soils has become a very valuable tool in estimating the amount of natural ground water recharge, which must be known for effective ground water use as well as for the quantification of ground water pollution by fertilisers and pesticides. In order to get realistic simulation results the respective models have to be tested extensively, taking into account different climatic conditions as well as variable soil conditions, and they also should be able to run at least for the most important agricultural crops. Therefore, long lasting and intensive field measurements of the soil water balance at different places are very important to gather the data needed for model calibration and verification. In the present paper the performance of such soil water monitoring with the EASY TEST FOM moisture meter and the results of the calibration of the SIMWASER soil water balance and plant growth model are described and some problems and shortcomings during the practical work are discussed.
MATERIAL AND METHODS
Field experiment
The experimental field is situated in the floodplain of the Mur river south of Graz in Styria/Austria and is part of
the Lysimeter Research Station of the Institute for Water Resources Management of the Joanneum Research Agency in Graz. The soil is very typical for such floodplains with loamy sands of variable thickness over a gravely and stony subsoil of several meters depth which at the same time is a valuable ground water reservoir but vulnerable to pollution by pesticides and fertilizers from the intensively managed maize fields in that area. The climate is very suitable for maize cropping with very warm summers and plenty of rain in normal years, but with dry spells increasing in recent years due to the global warming.
Besides the measuring stations of the Joanneum Research Agency on soil water content and the deep percolation of two typical cropping rotations (Fank, 2000) we established a soil moisture monitoring station within the experimental plot by which the deep percolation of continuous maize is measured using so called ‘Percolation Water Samplers’ at 150 cm depth. This monitoring station consisted of EASY TEST FP/m moisture field probes (Malicki et al., 1989) which were modified to be installed horizontally at 10, 20, 30, 40, 60, 80, 100 and 150 cm depth into a pit wall together with gypsum blocks and granular matrix sensors which had been calibrated in the laboratory to yield matrix potential after having been corrected to the ambient soil temperature which also was measured at the same depths.
The EASY TEST FP/m sensors were connected, at 30 cm depth below surface, by their 6 m long cables to a small container at the edge of the experimental plot, where they were plugged manually one after another to the EASY TEST FOM moisture meter to take the moisture readings. Matrix potential and soil temperature sensors were also connected by buried cables to an automatic battery powered data logger which was read out about every month using a note book by which all data were sent via internet to our institute.
Practical experiences with the EASY TEST FOM moisture meter in assessing the soil
water balance of a maize field
E. Stenitzer* and L. Gassner
Institute for Soil Water Management, Pollnbergstr. 1, A-3252 Petzenkirchen, Austria
Received February 4, 2004; accepted February 18, 2004
© 2004 Institute of Agrophysics, Polish Academy of Sciences *Corresponding author’s e-mail: [email protected]
A A
Agggrrroooppphhyhyysssiiicccsss w
w
SIMWASER simulation model
The SIMWASER deterministic simulation model (Stenitzer, 1988) describes the one dimensional vertical water flux within a soil profile. The water balance and the growth of plants are interrelated by the physiological interaction between transpiration and assimilation: accumulation of plant material depends on the amount of CO2incorporated via the stomata, by which at the same time water vapour is lost from the saturated vacuole into the unsaturated ambient air. Potential assimilation and therefore potential growth is only possible as long as the water supply towards the stomata can meet the potential transpiration loss. If this is not the case, stomata will close and formation of plant material will be restricted. All these processes depend on the respective plant development stage, as for example the division of the daily assimilates between leaves, stem and roots. SIMWASER calculates the actual development stage by dividing the currently accumulated growing degree days by the sum of growing degree days necessary for ripeness of the respective crop: a growing degree day corresponds to the mean daily temperature minus a base temperature which is specific to that crop.
Actual plant growth is derived from potential plant growth - which depends mainly on air temperature and global radiation – according to the proportion of the actual transpiration to the potential one. Potential evapotranspiration – PET - is calculated using the Penman-Monteith combination formula; potential transpiration, Tpot, is deduced from PET proportional to the global energy absorbed by the leaves of the crop stand. Actual transpiration, Tact, is determined by comparison of potential transpiration Tpot to the amount of water, Swr, which can be withdrawn by the roots from the soil. If Swris larger than Tpot, then Tact = Tpot; otherwise Tact = Swr, which will be the larger the deeper the roots are growing into the soil profile. Actual rooting depth depends on the respective crop as well as on the penetration resistance of the soil and is calculated for each day.
When calculating the soil water flux within the soil profile one must take into account if it may be influenced by the ground water level or not: in the latter case it may be assumed that there exists no capillary rise from the coarse aquifer, whereas in the former case the variable ground water level will form the lower boundary of the profile. Water flux between the soil layers is calculated according to DARCY’s law as a function of the capillary conductivity and the gradient of the matrix potential using small but variable time steps which restrict changes of water content to 0.1 %vol. The soil profile model may be divided into 50 layers maximum, each 5-10 cm thick, and must reach down to a depth which is outside the range of plant roots. A soil profile influenced by ground water must be deeper than the deepest ground water level at that site.
There are five main groups of input data, including general information on the simulation project, the irrigation schedule – if any, the description of the soil profile, hydraulic soil parameters of the soils in that profile, physiological plant parameters of the crops to be simulated, and weather and ground water data. Simulation results are given as daily values for each cropping element and include soil water storage, precipitation, evapotranspiration, deep percolation, capillary rise, surface runoff, leaf area index, total dry matter, root dry matter, water content and matrix potential within each soil layer.
RESULTS
Soil water content
Depending on the tillage practice at the continuous maize plot, the sensors in the upper soil layers had to be excavated each spring to enable ploughing without destroying the sensors.
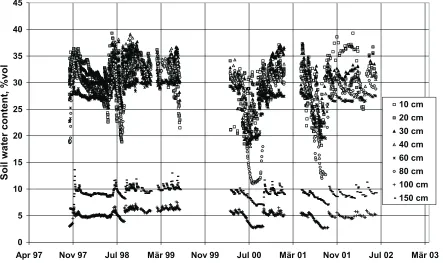
Because TDR soil moisture measurements are influenced by bulk (Malickiet al., 1996; Rothet al., 1992) water content measurements were now distinctly lower than before due to the loosened soil, and had to be corrected, an example of which is shown in Fig. 1. These corrections were necessary for the upper four sensors that were excavated and re-installed once each year. The measurements were taken at more or less regular intervals during the period of 1997 to 2001 without any larger problems except for a breakdown of the instrument in summer 1999 which caused a data gap for a period of several months length! Nonetheless, sufficient data on soil water content (Fig. 2) and on soil water suction were available for the creation of the so called field-pF-curves (Fig. 3) in order to deduce the required physical soil parameters as well as for calibration of the SIMWASER model by comparing simulated and measured soil water content.
Model calibration
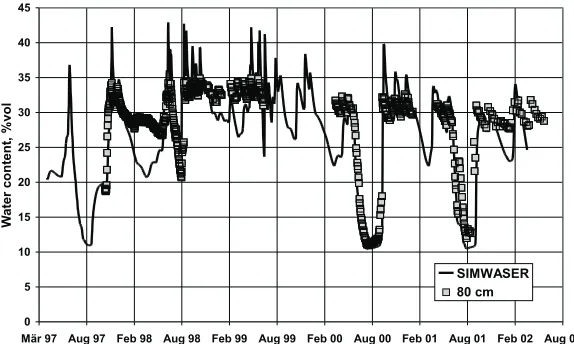
By comparing measured and simulated water content at different depths of the soil, as well as the soil water storage, one is able to assess the performance of a simulation model on soil water balance. This may be done solely by graphical examination as exemplified in the Figs 4 to 8.
DISCUSSION
a realistic manner. However, there still is a difference between simulated and measured ground water recharge, a
0 5 10 15 20 25 30 35 40 45
Apr 97 Nov 97 Jul 98 Mär 99 Nov 99 Jul 00 Mär 01 Nov 01 Jul 02 Mär 03
Soil
wat
e
r
c
ont
ent
,
%
v
ol
10 cm 20 cm
30 cm 40 cm 60 cm 80 cm 100 cm 150 cm
Fig. 2.Water content measurements with the EASY TEST FOM moisture meter.
0 5 10 15 20 25 30 35 40
Aug 97 Nov 97 Feb 98 Mai 98 Aug 98 Nov 98 Feb 99 Mai 99 Aug 99
Soil
wat
e
r
c
ont
ent
,
%
v
ol
10 cm original 10 cm corrected
0 5 10 15 20 25 30 35 40 45
Mär 97 Aug 97 Feb 98 Aug 98 Feb 99 Aug 99 Feb 00 Aug 00 Feb 01 Aug 01 Feb 02 Aug 02
W
a
ter
c
o
n
ten
t,
%
vo
l
SIMWASER 30 cm
Fig. 4.Comparison of simulated and measured water content at 30 cm depth.
0 5 10 15 20 25 30 35 40 45
Mär 97 Aug 97 Feb 98 Aug 98 Feb 99 Aug 99 Feb 00 Aug 00 Feb 01 Aug 01 Feb 02 Aug 02
W
a
ter
c
o
n
ten
t,
%
vo
l
SIMWASER 80 cm
Fig. 5.Comparison of simulated and measured water content at 80 cm depth.
0.0 5.0 10.0 15.0 20.0 25.0 30.0 35.0 40.0 45.0 50.0
1.0E-02 1.0E-01 1.0E+00 1.0E+01 1.0E+02 1.0E+03 1.0E+04 1.0E+05 1.0E+06 Soil water suction, kPa
W
a
ter
c
o
n
ten
t,
vo
l%
realistic manner. However, there still is a difference between simulated and measured ground water recharge, which may 0
50 100 150 200 250 300 350 400 450 500
Mär 97 Aug 97 Feb 98 Aug 98 Feb 99 Aug 99 Feb 00 Aug 00 Feb 01 Aug 01 Feb 02 Aug 02
S
o
il
water
s
to
rag
e
,
m
m
SIMWASER TDR-MEASUREMENTS
Fig. 7.Comparison of simulated and measured soil water storage.
0 5 10 15 20 25 30 35 40 45
Mär 97 Aug 97 Feb 98 Aug 98 Feb 99 Aug 99 Feb 00 Aug 00 Feb 01 Aug 01 Feb 02 Aug 02
W
a
te
r
C
ont
ent
,
%
v
ol
SIMWASER 150 cm
Fig. 6. Comparison of simulated and measured water content at 150 cm depth.
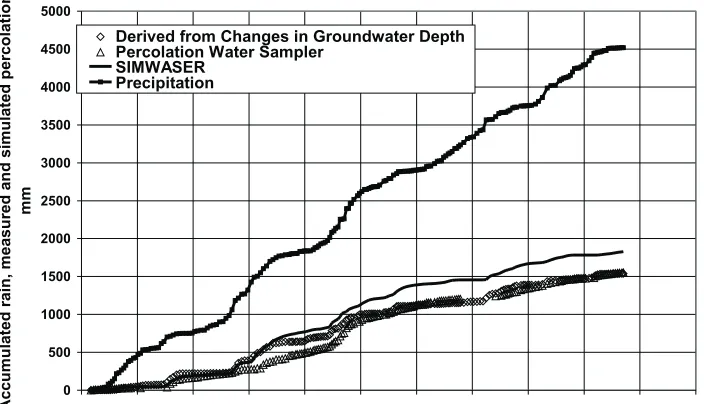
0 500 1000 1500 2000 2500 3000 3500 4000 4500 5000
Mär 97 Aug 97 Feb 98 Aug 98 Feb 99 Aug 99 Feb 00 Aug 00 Feb 01 Aug 01 Feb 02 Aug 02
Accu
m
u
lat
e
d
rain
,
m
e
asu
red
a
n
d
sim
u
lat
e
d
p
erco
lat
io
n
mm
Derived from Changes in Groundwater Depth Percolation Water Sampler
SIMWASER Precipitation
realistic manner. However, there still is a difference between simulated and measured ground water recharge, which may not be neglected! The most likely reason for this fact may be either the difference of the soil profiles found at the soil moisture monitoring site and at the percolation measuring site or some deviation of the deep percolation measurements by the water samplers from the natural seepage.
CONCLUSIONS
1. The EASY TEST FOM moisture meter proved to be a robust, reliable and easy to manage instrument, functioning at ambient temperatures ranging from -15°C to + 35°C.
2. Although the instrument was not calibrated for the soil of the experimental field, the measured water contents seem to be realistic as can be seen by the comparison of the field and laboratory-pF-curves.
3. It may be concluded that this instrument is a very valuable tool for efficient gathering of soil moisture data needed for model calibration and verification.
REFERENCES
Fank J., 2000. Die Bedeutung der ungesättigten Zone für Grundwasserneubildung und Nitratbefrachtung des Grundwassers in quartären Lockersediment-Aquiferen am Beispiel des Leibnitzer Feldes (Steiermark, Österreich). Beiträge zur Hydrogeologie 49/50, 101-388, Graz, Austria. Malicki M.A. and Skierucha W.M., 1989.A manually controlled
TDR soil moisture meter operating with 300 ps rise-time needle pulse. Irrig Sci, 10, 153-163.
Malicki M.A., Plagge R., and Roth C.H., 1996. Improving the calibration of dielectric TDR soil moisture determination taking into account the soild soil. European J. Soil Sci., 47, 357-366.
Roth C.H., Malicki M.A., and Plagge R., 1992. Empirical evaluation of the relationship between soil dielectric constant and volumetric water content as the basis for calibrating soil moisture measurements by TDR. J. Soil Sci., 43, 1-13.