Jacob Persson
Department of Computer Science Lund University
S-221 00 Lund, Sweden
Richard Johansson∗ DISI
University of Trento I-38100 Povo, Italy
[email protected] [email protected] [email protected] Pierre Nugues
Department of Computer Science Lund University
S-221 00 Lund, Sweden
Abstract
∗Most text categorization methods use the
vector space model in combination with a representation of documents based on bags of words. As its name indicates, bags of words ignore possible structures in the text and only take into account isolated, unrelated words. Although this limitation is widely acknowledged, most previous at-tempts to extend the bag-of-words model with more advanced approaches failed to produce conclusive improvements.
We propose a novel method that ex-tends the word-level representation to automatically extracted semantic and syntactic features. We investigated three
extensions: word-sense information,
subject–verb–object triples, and
role-semantic predicate–argument tuples, all
fitting within the vector space model.
We computed their contribution to the categorization results on the Reuters corpus of newswires (RCV1). We show that these three extensions, either taken individually or in combination, result in
statistically significant improvements of
the microaverageF1over a baseline using
bags of words. We found that our best extended model that uses a combination of syntactic and semantic features reduces the error of the word-level baseline by up to 10 percent for the categories having more than 1,000 documents in the training corpus.
∗Research done while at Lund University.
1 Introduction
Text categorization or classification corresponds
to the automatic assignment of a document to
one or more predefined categories. To carry out
this task, techniques using the vector space model (Salton et al., 1974) in combination with a
rep-resentation based on words – the bag-of-words
model – are considered to be standard both in practice and for evaluation purposes (Lewis et al., 2004). The bag-of-words model is both simple to
implement and enables classifiers to achieve
state-of-the-art results.
However as its name indicates, the bag-of-words model ignores possible structures in the text as it only takes into account isolated, unre-lated words present in a document. These lim-its are widely acknowledged and there has been many attempts to break them with more advanced
approaches. Approaches include the detection
and indexing of proper nouns, complex nominals,
phrases, or the identification of word-senses. To
date, they have not resulted in any conclusive im-provements (Moschitti and Basili, 2004).
In this paper, we describe novel features based on the output of syntactic and semantic parsers – subject–verb–object (SVO) triples and predicate– argument structures – to enrich the document rep-resentation. As for the words, these features are automatically extracted from raw text. We use them in the vector space model to extend the word-level representation with syntactic and semantic dimensions.
We evaluated the contribution of the syntactic and semantic representation on the Reuters cor-pus volume I of newswire articles (RCV1) with a standardized benchmark (Lewis et al., 2004). We
(SVM), where we compared the new representa-tion against the bag-of-words baseline. We could obtain an error reduction ranging from 1 to 10 per-cent for categories having more than 1,000 docu-ments in the training corpus.
2 Representing Text for Automatic Classification
2.1 The Vector Space Model
In statistical classification, thevector space model
is the standard way to represent data (Salton et al., 1974). This model uses all features that are extracted from a document collection to build a space, where each feature corresponds to a dimen-sion of this space. A single document is then rep-resented by a vector, where each coordinate
indi-cates the presence of a specific feature and weights
it. The document vectors can then be placed in the space and their location can be used to compute their similarity.
2.2 Using a Word-level Representation
The standard features in the vector space model are simply the words in the text. Let us assume that we have a document collection that only contains two documents, whose content is:
D1: Chrysler plans new investment in Latin
America.
D2: Chrysler plans major investments in Mexico.
The application of the bag-of-words model on the collection uses all the words in the documents as features and results in the document vectors shown in Table 1. The words are stemmed and the most common ones – the stop words – are not used as features, because they usually appear in all the documents. For each feature, the vector indicates how many times it appeared in the document. This
value is known as theterm frequency,tf.
In Table 1, the document vectors used the raw term frequency for each word and therefore
as-signing all words equal importance. However,
rare features are often more important than fea-tures present in many documents of the collec-tion. The spread of a feature is measured using
the document frequency, which is defined as the
number of documents in which a feature can be found. To give rare features more importance, the
term frequency is weighted with theinverted
doc-ument frequency,idf (1). This weighting scheme
is calledtf×idf and there exist many variants of
it. For a list of possible weighting schemes and
a comparative study of their influence, see Salton
and Buckley (1987) and Joachims (2002).
idf =log
collection size document frequency
(1)
2.3 Extending the Word-based
Representation with Complex Semantic Features
Word-based representations are simple and robust, but this comes at a cost. Using bags of words to represent a document misses the phrase and sen-tence organization as well as their logical struc-ture. Intuitively, the semantics of sentences in a document should help categorize it more accu-rately. To account for it, we extracted semantic features from each corpus sentence – predicate– argument tuples, subject–verb–object triples, and word-sense information – and we extended the document vectors with them.
Predicate–argument structures are core
con-structs in most formalisms dealing with knowl-edge representation. They are equally prominent in linguistic theories of compositional semantic representation. In the simplest case, predicate– argument tuples can be approximated by subject– verb–object triples or subject–verb pairs and ex-tracted from surface-syntactic dependency trees.
SVO representations have been used in vector-space approaches to a number of tasks (Lin, 1998; Padó and Lapata, 2007). In the widely publicized semantic web initiative, Berners-Lee et al. (2001)
advocated their use asa natural way to describe
the vast majority of the data processed by
ma-chines. They also correspond to binary relations
in relation algebra on which we can apply a large number of mathematical properties. Nonetheless, as far as we know, strict SVO representations have never been used in automatic text categorization. Fürnkranz et al. (1998) proposed an approximated SVO representation that could increase the pre-cision of some categorization experiments when combined with a low recall ranging from 10 to 40. However, they could not show any decisive, consistent improvement across a variety of exper-imental settings.
para-D#\Words chrysler plan new major investment latin america mexico
1 1 1 1 0 1 1 1 0
[image:3.612.144.473.59.88.2]2 1 1 0 1 1 0 0 1
Table 1: Document vectors based on the bag-of-words model.
phrasing caused by linguistic processes such as
voice alternation, Chrysler planned investments /
investments were planned by Chrysler, and
diathe-sis alternations such as dative shifts,We sold him
the car/We sold the car to him.
Chrysler plans new investment in Latin America
plan.01
LOC PMOD
NMOD NMOD
OBJ
A0
investment.01
A1 A0
A2 SBJ
[image:3.612.344.490.315.558.2]ROOT
Figure 1: Example sentence with dependency syn-tax and role semantics annotation. Upper arrows correspond to the dependency relations and the lower ones to the semantic roles.
Role semantics(Fillmore, 1968) is a formalism
that abstracts over the bare syntactic
representa-tion by means of semantic roles like AGENTand
PATIENT rather than grammatical functions such
as subject and object.
Figure 1 shows the first example sentence in
Sect. 2.2 annotated with syntactic dependencies and role-semantic information according to the PropBank (Palmer et al., 2005) and NomBank
(Meyers et al., 2004) standard. The verbplanis a
predicate defined in the PropBank lexicon, which
lists its four possible core arguments: A0, ner, A1, the thing planned, A2, grounds for
plan-ning, and A3, beneficiary. Similarly, the noun
investment is a NomBank predicate whose three
possible core arguments are: A0, investor, A1, theme, and A2 purpose. In addition to the core ar-guments, predicates also accept optional adjuncts such as locations or times.
For each predicate, PropBank and NomBank
define a number ofword senses, such as plan.01
andinvestment.01 in the example sentence.
Fea-tures based on word sense information, typically employing WordNet senses, have been used in text
classification, but have not resulted in any
conclu-sive improvements. For a review of previous stud-ies and results, see Mansuy and Hilderman (2006).
3 Automatic Semantic Role Labeling
Role-semantic structures can be automatically ex-tracted from free text – this task is referred to as
semantic role labeling(SRL). Although early SRL
systems (Hirst, 1983) used symbolic rules, modern systems to a large extent rely on statistical tech-niques (Gildea and Jurafsky, 2002). This has been made possible by the availability of training data,
first from FrameNet (Ruppenhofer et al., 2006)
and then PropBank and NomBank. Semantic role labelers can now be applied to unrestricted text, at least business text, with a satisfying level of qual-ity.
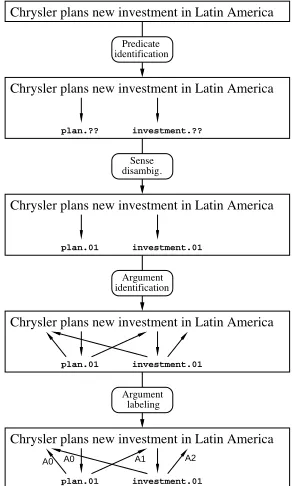
Chrysler plans new investment in Latin America
plan.?? investment.??
Chrysler plans new investment in Latin America
Predicate identification
disambig.Sense
Argument identification
Argument labeling plan.01 investment.01
Chrysler plans new investment in Latin America
plan.01 investment.01
Chrysler plans new investment in Latin America
plan.01 investment.01
Chrysler plans new investment in Latin America
A0 A0 A1 A2
Figure 3: Example processed by the semantic pipeline.
We used a freely available SRL system (Johans-son and Nugues, 2008) to extract the predicate–
argument structures1. The system relies on a
syn-tactic and a semantic subcomponent. The syntac-tic model is a bottom-up dependency parser and the semantic model uses global inference
mecha-nisms on top of a pipeline of classifiers. The
com-1Download site:
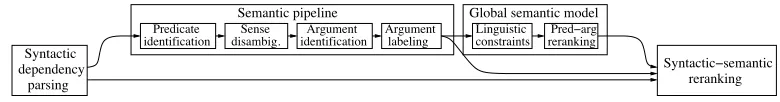
Predicate
identification disambig.Sense identificationArgument Argumentlabeling
Semantic pipeline
rerankingPred−arg
Linguistic constraints
dependency Syntactic
parsing
Global semantic model
Syntactic−semantic
[image:4.612.110.500.57.108.2]reranking
Figure 2: The architecture of the semantic role labeling system.
plete syntactic–semantic output is selected from a candidate pool generated by the subsystems. Fig-ure 2 shows the overall architectFig-ure and FigFig-ure 3 shows how the example sentence is processed by the semantic subcomponent. The system achieved the top score in the closed challenge of the CoNLL 2008 Shared Task (Surdeanu et al., 2008): a la-beled syntactic accuracy of 89.32%, a lala-beled
se-mantic F1 of 81.65, and a labeled macro F1 of
85.49.
4 Experimental Setup
We carried out a series of experiments to de-termine the contribution of the three sets of
syntactic–semantic features: word-sense
infor-mation, subject–verb–object triples, and
role-semantic predicate–argument tuples. They all
come as an extension to the baseline word-level
representation in the vector space model. Wefirst
describe the data sets, then the experimental
pa-rameters, andfinally thefigures we obtained for
different combinations of features.
4.1 Corpora
We conducted our experiments on the RCV1-v2 (Lewis et al., 2004) corpus, which is a cor-rected version of RCV1 (Reuters Corpus Volume 1). We used the LYRL2004 split, which puts ar-ticles published between August 20, 1996 to Au-gust 31, 1996 in the training set and articles be-tween September 1, 1996 to August 19, 1997 into the test set. We performed the split on the orig-inal RCV1-v1 collection which results in 23,307 training documents and 783,484 test documents. RCV1 has three sets of categories called: region code, topic code, and industry code. The region code contains the geographical locations that an article covers. The topic codes try to capture the subjects of an article, and industry codes describe
the industryfields mentioned in an article.
4.2 Classification Method
We reproduced the conditions of the SVM.1
clas-sification method described in Lewis et al. (2004).
We used the SVMlight(Joachims, 1999) classifier
with the standard parameters and the SCutFBR.1 algorithm (Yang, 2001) to choose the optimal threshold.
SCutFBR.1 replaces SVMlight’s own method for
selecting a partitioning threshold. For each
cat-egory, SVMlight computes a ranking of the
docu-ments in the form of a scoring number assigned to each document. This number determines the
doc-ument rank in the category. The goal is tofind a
threshold from the ranked training documents that
maximizes the number of correct classifications.
The purpose of SCutFBR.1 is to handle cases when there are few training documents for a
cat-egory. There is then a risk of overfitting, which
may lead to too high or too low thresholds. A high threshold results in many misses, which have
a negative impact on the macroaverageF1while a
low threshold results in a potentially large number of documents assigned to a wrong category, which has a negative impact on both the micro and the
macroaverage F1. To avoid this, theF1 score is
calculated for each category in the training set. If the score is too low, the highest ranking is chosen as the threshold for that category.
4.3 Corpus Tagging and Parsing
We annotated the RCV1 corpus with POS tags, de-pendency relations, and predicate argument struc-tures using the SRL system mentioned in Sect. 3. The POS tagger uses techniques that are similar to those described by Collins (2002).
4.4 Feature Sets
We conducted our experiments with three main
sets of features. Thefirst feature set is the
base-line bag of words. The second one uses the triples consisting of the verb, subject, and object (VSO) for given predicates. The third set corresponds to predicates, their sense, and their most frequent core arguments: A0 and A1. We exemplify the
features with the sentenceChrysler plans new
in-vestment in Latin America, whose syntactic and
Asfirst feature set, we used the bags of words corresponding to the pretokenized version of the RCV1-v2 released together with Lewis et al. (2004) without any further processing. Examples of bag-of-words features are shown in Table 1.
For the second feature set, the VSO triples, we considered the verbs corresponding to the Penn Treebank tags: VB, VBD, VBG, VBN, VBP, and VBZ. In each sentence of the corpus and for each verb, we extracted their subject and object heads from the dependency parser output. These dependencies can have other types of
grammat-ical function. We selected the subject and
ob-ject because they typically match core
seman-tic roles. We created the feature symbols by
concatenating each verb to its subject and ob-ject dependents whenever they exist. Verbs with-out any subject and object relations were ignored. The feature created from the example sentence is:
plan#Chrysler#investment.
The third feature set considers the predicates of the corpus and their most frequent arguments. We used the semantic output of the SRL system to identify all the verbs and nouns described in the PropBank and NomBank databases as well as their arguments 0 and 1. We combined them to form four different subsets of semantic features. The
first subset simply contains the predicate senses.
We created them by suffixing the predicate words
with their sense number as for instance plan.01.
The three other subsets corresponds to combina-tions of the predicate and one or two of their core
arguments,argument 0 andargument 1. As with
the VSO triples, we created the feature symbols using a concatenation of the predicate and the ar-guments. The three different combinations we used are:
1. The predicate and its first argument,
argu-ment 0. In the example,plan.01#Chrysler
2. The predicate and its second argument,
argu-ment 1. In the example,plan.01#investment
3. The predicate and its first and second
argu-ment, arguments 0 and 1. In the example,
plan.01#Chrysler#investment
We applied thelog(tf)×idf weighting scheme
to all the feature sets in all the representations. We
used the raw frequencies for thetf component.
5 Results
5.1 Evaluation Framework
Since the articles in RCV1 can be labeled with multiple categories, we carried out a multilabel
classification. This is done by applying a
classi-fier for each category and then merging the results
from them. For a classification of a single
cate-goryi, the results can be represented in a
contin-gency table (Table 2) and from this table, we can
calculate the standard measures P recision and
Recall. We summarized the results with the
har-monic meanF1ofP recisionandRecall.
+example -example
+classified ai bi
[image:5.612.354.521.432.545.2]-classified ci di
Table 2: The results of a classification represented
in a contingency table.
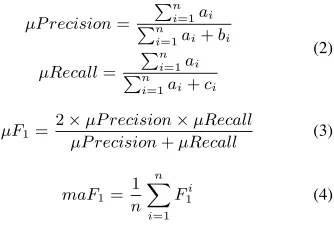
To measure the performance over all the
cate-gories, we use microaveragedF1 and
macroaver-aged F1. Macroaverage is obtained by
calculat-ing theF1score for each category and then taking
the average over all the categories (4), whereas mi-croaverage is calculated by summing all the binary
decisions together (2) and calculatingF1from that
(3).
µP recision= Pn
i=1ai
Pn
i=1ai+bi
µRecall= Pn
i=1ai
Pn
i=1ai+ci
(2)
µF1= 2×µP recisionµP recision+×µRecallµRecall (3)
maF1= 1n n
X
i=1 Fi
1 (4)
5.2 Results
The six feature sets create 64 possible representa-tions of our data. We assigned a code to the rep-resentations using a six-character string where a 1
at thefirst location indicates that the bag-of-words
set is included and so forth as shown in Table 3. To get an approximation of the performance of the representations, we conducted tests on the training set. We then ran full tests on the topics categories on the representations that showed the highest effectiveness. We measured and optimized
Feature set Code
Bag of words 100000
Predicates 010000
VSO triples 001000
Argument 0 000100
Argument 1 000010
[image:6.612.131.262.57.151.2]Arguments 0 and 1 000001
Table 3: Codes for the features sets. A code for a representation is the result of a bitwise-and be-tween the codes of the included feature sets.
representations we selected from the initial tests and their results with the full test. The represen-tations that include bag-of-words, predicates, and one or more of the argument sets or the VSO set achieved the best performance.
Feature set Microaverage Macroaverage
Baseline 81.76 62.31
c110000 81.99 62.09
c111000 82.27 62.57
c110100 82.12 62.16
c110010 82.16 62.77
c110001 81.81 62.24
c111100 82.17 62.44
Table 4: Effectiveness of microaverage and
macroaverageF1on the most promising
represen-tations. Parameters were set to optimize
respec-tively microaverage and macroaverage F1. The
baselinefigure corresponds to the bag of words.
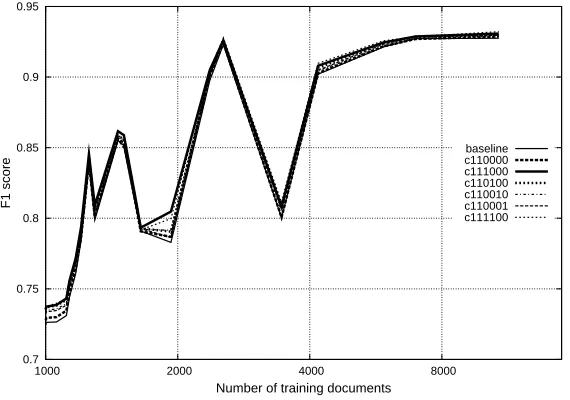
The effectiveness of the individual categories can be seen in Figures 4 and 5. The categories are sorted by training set frequency. The graphs have been smoothed with a local linear regression within a [-200, +200] range.
As scores are close in Figures 4 and 5, we show the relative error reduction in Figures 6 and 7.
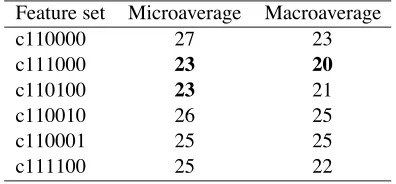
We applied the McNemar test to measure the
significance of the error reduction. In Table 5,
we list how many categories showed a significance
under 0.95 out of 103 categories in total.
We also measured the significance by
apply-ing a paired t-test on the categories with more
than 1000 training documents, where the
popula-tion consisted of theF1scores. The tests showed
p-values lower than 0.02 on all representations
for both micro and macroaverage optimized F1
scores.
-0.09 -0.08 -0.07 -0.06 -0.05 -0.04 -0.03 -0.02 -0.01 0 0.01 0.02 0.03 0.04 0.05 0.06 0.07 0.08 0.09 0.1 0.11
10 100 1000 10000
Relative error reduction
Number of training documents c110000
[image:6.612.321.530.63.209.2]c111000 c110100 c110010 c110001 c111100
Figure 6: The relative error reduction per category
for microaverage optimized classifications.
-0.09 -0.08 -0.07 -0.06 -0.05 -0.04 -0.03 -0.02 -0.01 0 0.01 0.02 0.03 0.04 0.05 0.06 0.07 0.08 0.09 0.1 0.11
10 100 1000 10000
Relative error reduction
Number of training documents c110000
[image:6.612.320.530.272.420.2]c111000 c110100 c110010 c110001 c111100
Figure 7: The relative error reduction per category
for macroaverage optimized classifications.
Feature set Microaverage Macroaverage
c110000 27 23
c111000 23 20
c110100 23 21
c110010 26 25
c110001 25 25
c111100 25 22
Table 5: Number of categories that had an signifi
-cance under 0.95 when parameters were set to
op-timize microaverage and macroaverageF1.
5.3 Conclusion
We have demonstrated that complex semantic
fea-tures can be used to achieve significant
improve-ments in text classification over a baseline
bag-of-words representation. The three extensions
[image:6.612.99.295.294.400.2] [image:6.612.319.517.478.570.2]0.7 0.75 0.8 0.85 0.9 0.95
1000 2000 4000 8000
F1 score
Number of training documents
[image:7.612.165.447.62.260.2]baseline c110000 c111000 c110100 c110010 c110001 c111100
Figure 4: F1 effectiveness per category on microaverage optimized classifications where there exists
more than 1000 training documents.
0.7 0.75 0.8 0.85 0.9 0.95
1000 2000 4000 8000
F1 score
Number of training documents
baseline c110000 c111000 c110100 c110010 c110001 c111100
Figure 5: F1 effectiveness per category on macroaverage optimized classifications where there exists
more than 1000 training documents.
triples, and predicate–argument structures, either taken individually or in combination, result in
sta-tistically significant improvements of the
microav-erageF1. The best results on average are produced
by extending the vector space model with dimen-sions representing disambiguated verb predicates and SVO triples. For classes having more than 2500 training documents, the addition of argument 0 yields the best results.
All results show an improvement over the top
microaveraged F1 result of 81.6 in Lewis et al.
(2004) which corresponds to the baseline in our experiment.
Contrary to previous studies (Mansuy and Hil-derman, 2006), the sense disambiguation step
shows improved figures over the baseline. The
possible explanation may be that:
• The PropBank/NomBank databases have
simpler sense inventories than WordNet, for
[image:7.612.164.449.322.522.2]and only one in PropBank;investmenthas six senses in WordNet, one in NomBank.
• The Penn Treebank corpus on which the
semantic parser is trained is larger than SemCor, the corpus that is commonly used to train word-sense disambiguation systems.
This means that the classifier we used is
pos-sibly more accurate.
We designed our experiments with English text for which high-performance semantic parsers are available. The results we obtained show that using
SVO triples is also an efficient way to approximate
predicate–argument structures. This may be good news for other languages where semantic parsers have not yet been developed and that only have de-pendency parsers. We plan to carry out similar ex-periments with SVO triples in other languages of the Reuters corpus and see whether they improve the categorization accuracy.
Moreover, we believe that our approach can be improved by introducing yet more abstraction. For instance, frame semantics from FrameNet (Ruppenhofer et al., 2006) could possibly be used to generalize across predicates as with
buy/acquisition. Similarly, structured dictionaries such as WordNet or ontologies such as Cyc could allow generalization across arguments.
References
Tim Berners-Lee, James Hendler, and Ora Lassila. 2001. The semantic web. Scientific American, pages 29–37, May.
Michael Collins. 2002. Discriminative training methods for hidden Markov models: Theory and experiments with per-ceptron algorithms. InProceedings of the 2002 EMNLP Conference, pages 1–8.
Charles J. Fillmore. 1968. The case for case. In Univer-sals in Linguistic Theory, pages 1–88. Holt, Rinehart, and Winston.
Johannes Fürnkranz, Tom Mitchell, and Ellen Riloff. 1998. A case study in using linguistic phrases for text categoriza-tion on the WWW. InLearning for Text Categorization: Papers from the 1998 AAAI/ICML Workshop, pages 5–13.
Daniel Gildea and Daniel Jurafsky. 2002. Automatic label-ing of semantic roles.Computational Linguistics, 28(3).
Graeme Hirst. 1983. A foundation for semantic interpreta-tion. InProceedings of the 21st Annual Meeting of the ACL, pages 64–73.
Thorsten Joachims. 1999. Making large-scale SVM learning practical. InAdvances in Kernel Methods. Support Vector Learning. MIT Press.
Thorsten Joachims. 2002. Learning to Classify Text Using Support Vector Machines. Kluwer Academic Publishers.
Richard Johansson and Pierre Nugues. 2008. Dependency-based syntactic–semantic analysis with PropBank and NomBank. InProceedings of The Twelfth Conference on Natural Language Learning (CoNLL-2008).
David D. Lewis, Yiming Yang, Tony G. Rose, and Fan Li. 2004. RCV1: A new benchmark collection for text cat-egorization research. Journal of Machine Learning Re-search, 5.
Dekang Lin. 1998. Automatic retrieval and clustering of similar words. InProceedings of the 36th Annual Meeting of the ACL and 17th International Conference on Compu-tational Linguistics, pages 768–774.
Trevor Mansuy and Robert J. Hilderman. 2006. A character-ization of WordNet features in Boolean models for text classification. In Proceedings of the Fifth Australasian Data Mining Conference (AusDM2006), pages 103–109.
Adam Meyers, Ruth Reeves, Catherine Macleod, Rachel Szekely, Veronika Zielinska, Brian Young, and Ralph Gr-ishman. 2004. The NomBank project: An interim report. InHLT-NAACL 2004 Workshop: Frontiers in Corpus An-notation, pages 24–31.
Alessandro Moschitti and Roberto Basili. 2004. Complex linguistic features for text classification: a comprehensive study. InProceedings of ECIR-04, 26th European Con-ference on Information Retrieval.
Sebastian Padó and Mirella Lapata. 2007. Dependency-based construction of semantic space models. Computa-tional Linguistics, 33(2).
Martha Palmer, Daniel Gildea, and Paul Kingsbury. 2005. The Proposition Bank: an annotated corpus of semantic roles.Computational Linguistics, 31(1).
Josef Ruppenhofer, Michael Ellsworth, Miriam R. L. Petruck, Christopher R. Johnson, and Jan Schef-fczyk. 2006. Framenet II: Theory and practice. http://framenet.icsi.berkeley.edu/book/book.html.
Gerard Salton and Chris Buckley. 1987. Term weight-ing approaches in automatic text retrieval. Technical Re-port TR87-881, Department of Computer Science, Cornell University.
Gerard Salton, A. Wong, and C. S. Yang. 1974. A vec-tor space model for automatic indexing. Technical Re-port TR74-218, Department of Computer Science, Cornell University.
Mihai Surdeanu, Richard Johansson, Adam Meyers, Lluís Màrquez, and Joakim Nivre. 2008. The CoNLL–2008 shared task on joint parsing of syntactic and semantic de-pendencies. InProceedings of The Twelfth Conference on Natural Language Learning (CoNLL-2008).